How Twilio Segment Models Growth for Two-Sided Marketplaces
Aug 27, 2015
By Andy Jiang
Here at Segment, we love frameworks and data. Frameworks help us organize and understand the world, and data helps us stay focused and monitor progress. So, it’s no surprise we use them both to help us project future growth and figure out how to hit our lofty goals.
This is the framework to understanding what vibes the hardest at Segment HQ.
In this post, we’ll share our approach to understanding our growth dynamics, which involves building a mathematical model for marketplace dynamics and aligning internal resources to focus on growth goals. You can’t really get more data-frameworky than this!
Growth Dynamics of Two-Sided Marketplaces
To start from the beginning, we’re a two-sided marketplace with customers on one side and partners on the other. This business model strongly affects how we grow.
For marketplaces like us, growth is driven by “network effects” where the value of the marketplace increases as usage increases. If you look around Silicon Valley for “unicorns,” or some of the fastest growing companies, you’ll no doubt find a few marketplaces. Uber and Airbnb have each grown to over $20B valuations in less than 7 years.
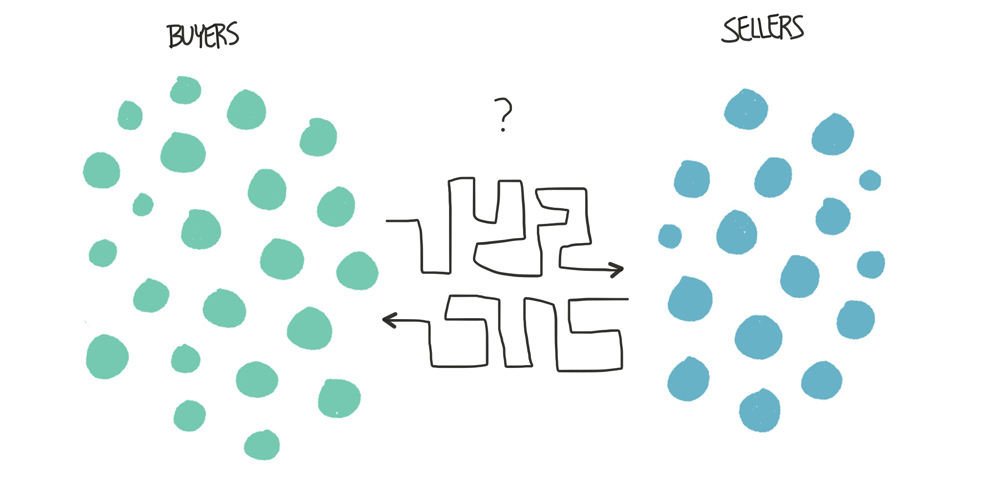
Marketplaces are awesome because, without them, buyers and sellers face complex, risky, and time-consuming transactions. For example, without Lyft and Uber, you hope a random taxi drives by at just the right time. Meanwhile, the cabbies roam around, hoping to spot someone frantically waving their arms in need of a ride. This is a crazy process for connecting riders and drivers, and it’s clearly an inefficient marketplace, especially in cities like SF where the volume of taxi drivers does not meet the demand from riders:
Uber and Lyft significantly reduce that complexity. Riders press a button to hail a driver to their GPS location, and the pair rate each other after each ride to improve trust and safety. Drivers don’t look for people waving their arms, they just wait for their phone to tell them exactly where their next ride begins. In our case, we bring together businesses that care about data and SaaS products that run on data with one API to use them all.
So, thanks to the marketplace, transacting is dramatically more efficient:
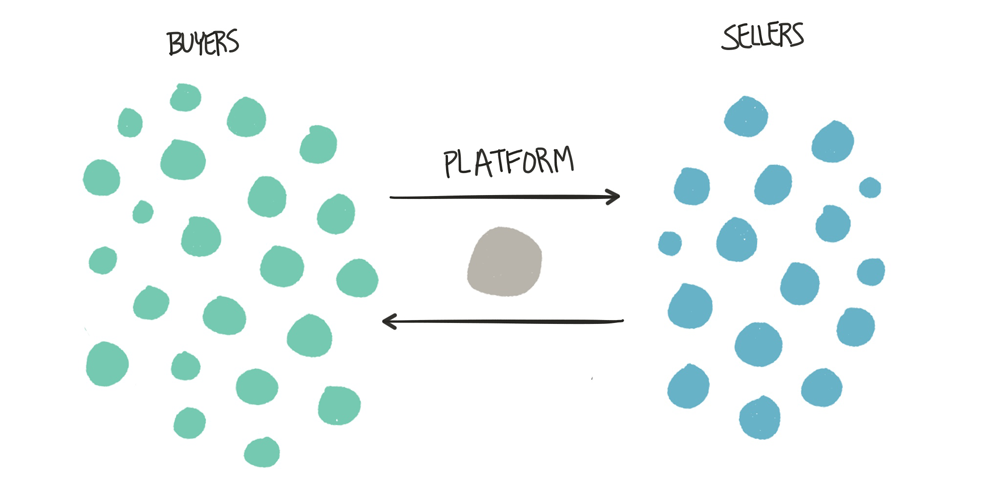
The value of the marketplace comes from the ease of transaction, marked by the availability of buyers and sellers on either side of the exchange. In other words: the value increases with the number of participants, attracting even more buyers and sellers.
Marketplace Dynamics
Knowing we’re a marketplace, we borrowed heavily from this HBR article that outlines a rigorous way to model marketplace growth with six separate dynamics:
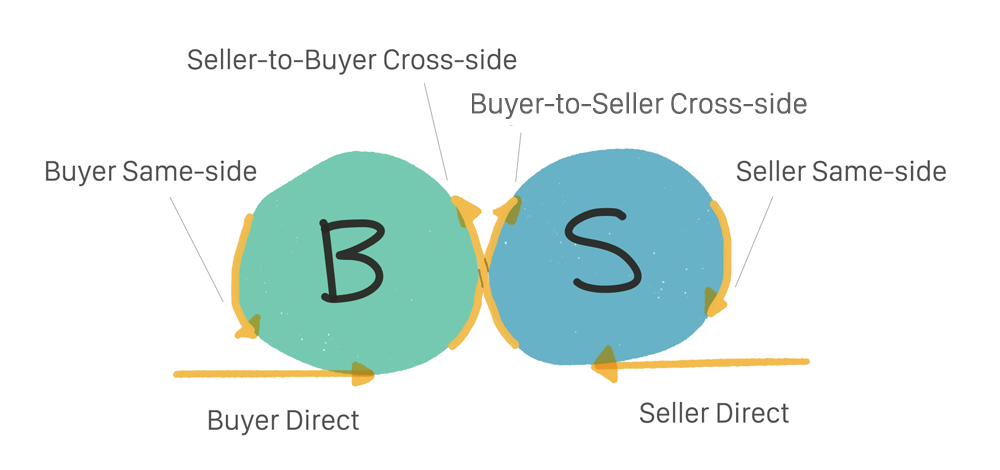
Buyer-to-Seller Cross-side — prospective buyers tell prospective sellers that they prefer to do business on the platform. “It was hard to find your place. How come you don’t list on Airbnb?”
Seller-to-Buyer Cross-side — prospective sellers expose prospective buyers to the platform. “Buy my adorable elephant mittens on Etsy.”
Buyer Same-side — buyers love the new transaction experience, and tell other prospective buyers to use the platform. “Why would you use a taxi? You should check out Lyft.”
Seller Same-side — sellers love the new transaction experience, and tell other prospective sellers to use the platform. “I made a good chunk of change while I was on vacation, renting my place on Airbnb. You should try it out!”
Direct to Buyers — the marketplace tells buyers about itself directly. “Wow, Uber has a lot of billboards here.”
Direct to Sellers — the marketplace tells sellers about itself directly. “I searched for jobs in Cincinnati and found Lyft.”
Build a Numerical Model
These internal growth dynamics let us put together a simple numerical model. The model uses the current size and growth rate of customers and partners as inputs, and then applies each of the six dynamics to project future performance.
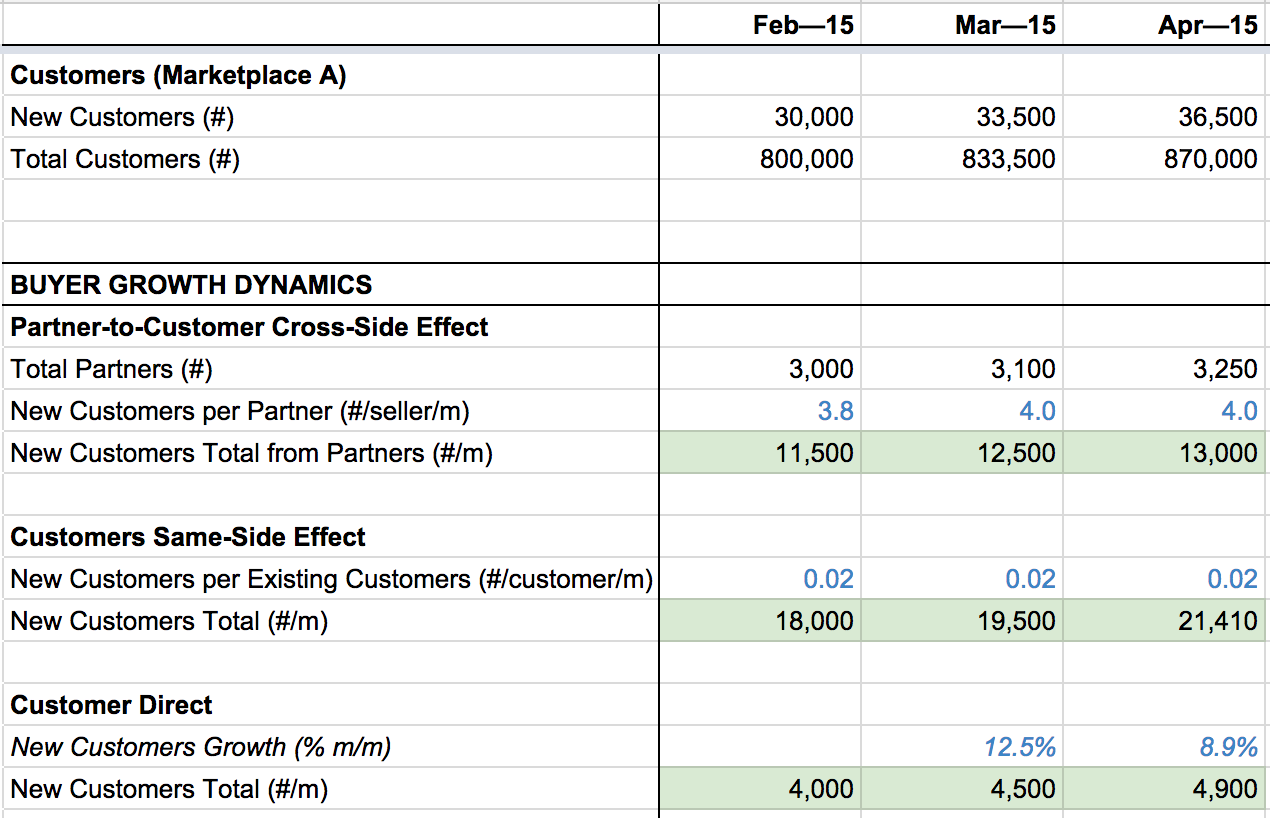
Here is a quick glance at an example growth model using fake data. (If you want to see our actual numbers, click here). Below you can see the representations of the six growth dynamics:
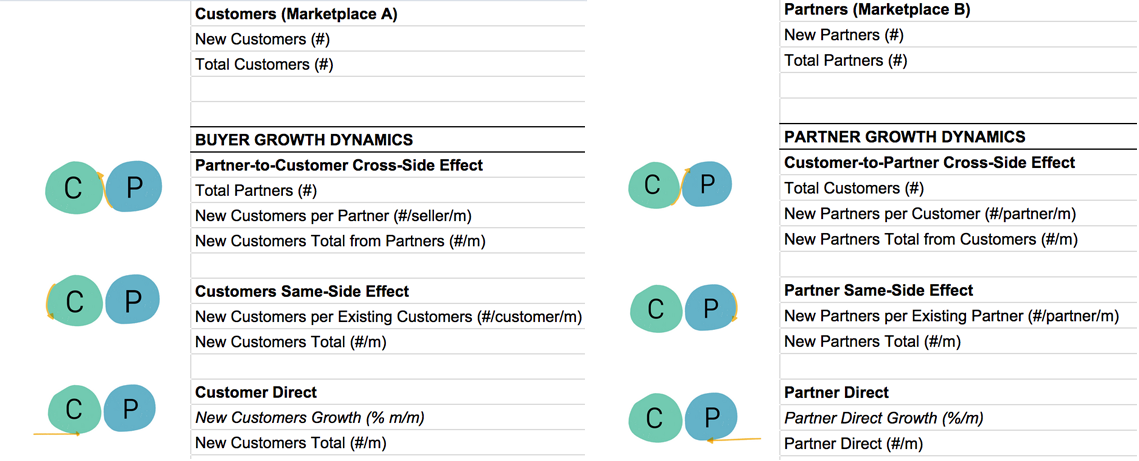
Using the model we’re able to see a range of forward projections based on conservative and aggressive goals. The chart below details two sample scenarios, the Base Case and Growth Case (again, totally made up here for the sake of example!).
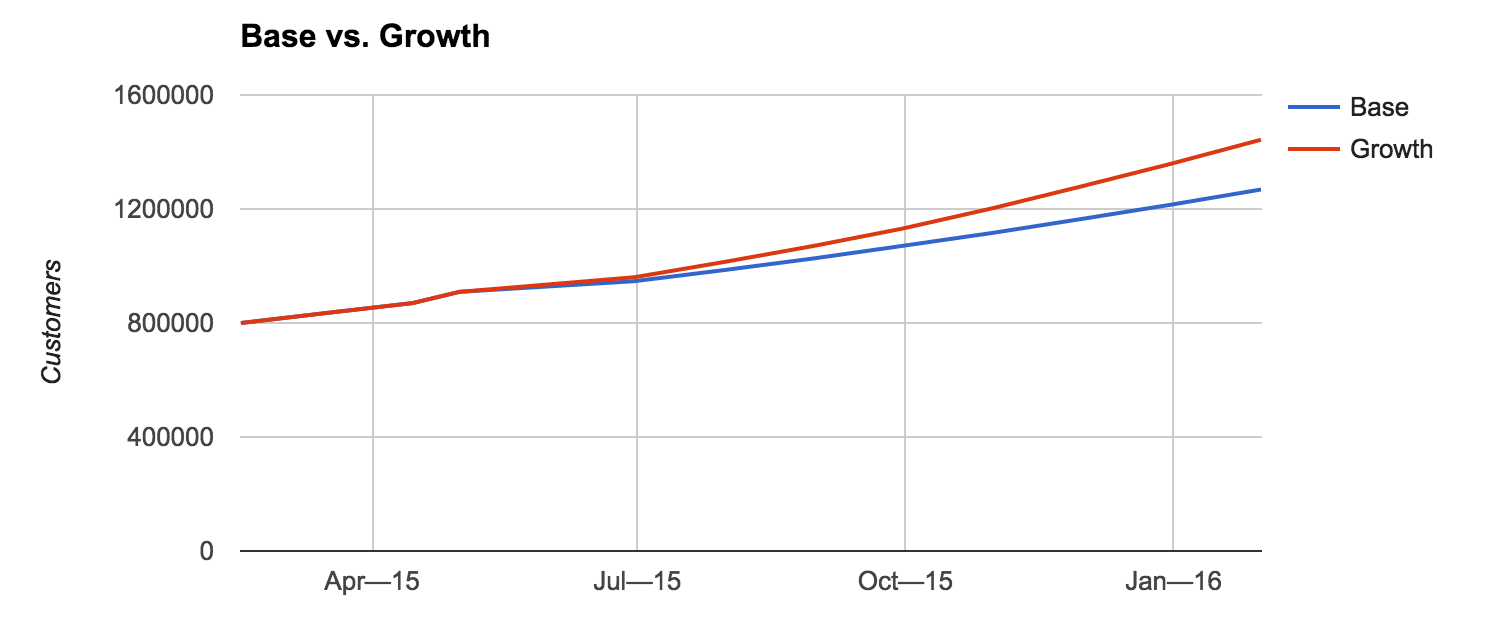
The Base case is a conservative, keep-everything-status-quo projection. Based on historic figures, there is already some cross-marketplace network effects going to work, which is great. As a result, this case predicts ~1.26 million customers by the end of the period with a steady ~%4 m/m growth and a total of %58 growth.
Not bad.
The Growth case, alternatively, assumes that we will figure out ways to get more customer signups from our partners (0.4 gradually growing to 10 new customers per partner) which represents the Seller-to-Buyer cross side effect.
This case predicts ~1.44 million customers by the end with total of 80% growth. Better! And this is only adjusting one assumption: the new customers per partner cross-side dynamic.
Define Marketplace Participants
Let’s walk through how this model was put together with our fake data, so you can do the same if you have a platform business.
To start playing around with the model, you can copy this handy sheet we built for this example. 😃
The model contains three tabs that are split up into these groups:
Aggregate top-level numbers (total customers and partners) for the entire platform
Growth dynamics for customers
Growth dynamics for partners
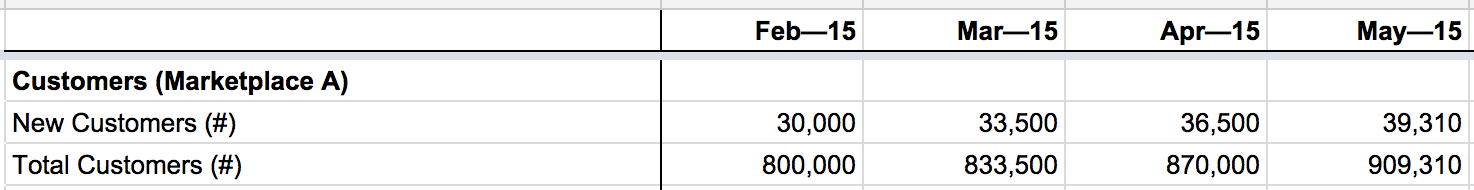
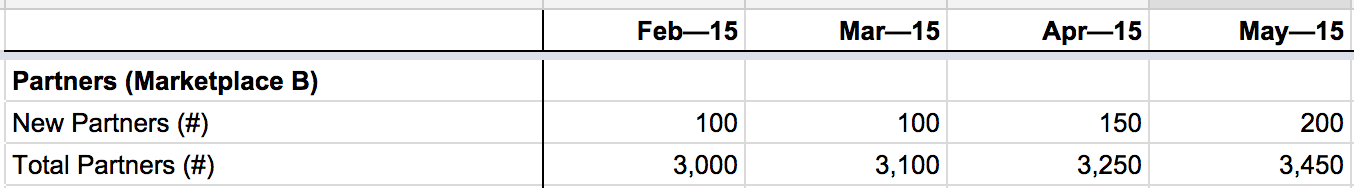
First we defined the participants of each marketplace, as this helps us measure their sizes to put into the model.
For Segment, the definitions are:
Customer: somebody who registered an account with us
Partner: an integration on our platform
We added these historic numbers to sheets 2 and 3 at the top section (reminder: fake data!):
Then, we looked at historical attribution numbers in order to determine reasonable rates for each growth dynamic.
Examine Historical Data
We’ve been fortunate enough to have been attributing our sources for customers and partners (e.g. recording where they came from) for a meaningful time period. This data is necessary to backfill historic cross-side and same-side growth dynamics.
new customers per partner: total partner referral signups
new customers per existing customer: signups that mentioned “friends” as how they heard about us
customers direct growth: signups attributed to content, paid marketing
We filled them here in the green highlighted cells (note that the blue font indicates the cell is calculated and the black font is hard coded):
Define Growth Assumptions
Once we have historical data, we filled in the future assumptions.
We determined the assumptions by looking at the historic range for that metric, thinking about the factors in our business or situation that impacted that metric, and estimating what that metric will be in the next few months.
Then we continuously adjusted them, so the overall top level growth numbers (aka sheet 1) looks reasonably achievable for us. Sanity checking the assumptions is critical, so take time to revisit them to make sure they make sense.
Let’s take use the Partner Direct growth rate as an example. Historically in this example, it has been 0%. Let’s assume in these past few months, we did nothing with regards to attracting new partners to the platform. However, we plan to put way more focus in this channel: developer evangelism, outbound business development, etc. From that information, a growth case assumption for this rate would be 30% or more.
If there is no historical data to help set the assumption, then ballpark guesses are acceptable, so long as you continue to tweak it so that the overall outputs of the model passes a sanity check later on. Ballpark guesses based on anecdotal stories can be helpful: “the majority of buyers who I talk to say they heard about us from their friends” would make the case that same-side buyers are a strong driving force.
Project Growth and Set Goals
Once we settled on reasonable assumptions, we projected future growth by applying the dynamic rates and used these to set goals. The dynamic nature of the model helps us to easily visualize how growth is impacted by different scenarios. We chose our goals after seeing where our efforts would yield the biggest change; for example, if spending more time on direct customer marketing or figuring out how to drive signups from our partners would have a greater effect.
To identifying these key opportunities, or the dynamics that would make the biggest impact with the smallest improvements, we tested different projections in the model.
Approaching this systematically, we came up with six different scenarios. Each scenario uses conservative estimates for all six assumptions except for one, which is aggressive. Going through this process, we could see which dynamic had the highest impact change in number of customers.
As a thought exercise, here are some intuitive examples of growth opportunities based on your company’s stage.
For earlier companies, it is likely that the cross-side value hasn’t reached a critical tipping point yet; i.e. the size of one marketplace is too small for it to be valuable to the other side. You likely have a classic the chicken or the egg problem. In these situations, it is wise to devote resources on propping up or subsidizing one side of the marketplace via its direct channel, of which the company has complete control (“more marketing spend will yield more users”).
In Segment’s early days, the team subsidized the partners side by building and maintaining the first 100+ integrations. The selection of integrations made Segment appealing to customers. However, now we’re fielding inbound requests from newer partners to be added to our platform—these companies see Segment’s value as a distribution mechanism to acquire users cheaply.
For marketplaces that are already experiencing positive cross-side effects, strengthening these effects can often lead to much higher growth (vs. focusing on a direct channel), due to their compounding impact.
Ultimately, once we identified which channels needed the most love, we could set more granular growth goals, such as “get X customer sign ups from partners”. With clear, quantifiable objectives that we can measure over time, it’s easier for us to stay on track!
Align Company Growth Objectives
As a result, we evaluate every effort in our Product, Marketing, and Partners teams within the platform model. We use the model as a map, helping sequence and compare alternative tactics.
Because our customers are our source of revenue, we’re focused on channels for “customer direct”, “customer same-side”, “partner-to-customer cross-side.” At our current state, partner-side growth dynamics aren’t as important until we have a fully functioning “customer-partner cross-side” effect.
We’ve used these growth channels to organize our resources: our marketing team owns the “customer direct” channel, product team owns “customer same-side”, and our partners team owns the “partner-to-customer cross-side” channel:
Customer Same-Side
Team: Product
Goal: enthuse our customer base to refer more
Metric: # Monthly signups attributed to “friends” or “colleagues”
Customer Direct
Team: Marketing
Goal: find and convert more fresh customers
Metric: # Monthly signups attributed to our content, paid acquisition
Partner-to-Customer Cross-Side
Team: Partners
Goal: experiment to figure out how to make this dynamic work
Metric: # Monthly signups attributed to our partners
We’re able to attribute the signups by asking users where they heard about Segment when they’re signing up.
Now, evaluating or comparing new projects is much clearer when your team’s goal is tied to one metric. We can just ask ourselves if the project in question will positively impact the metric, by how much, by how soon, etc.
Moreover, assigning ownership of metrics to different teams is an excellent way to modularize their efforts and keep them concentrated on a specific target.
Look Beyond the Metrics
Though this was a simplified walk through of how we currently think about our business and its growth challenges, we believe this step-by-step approach helps separate signal from noise. Instead of being overwhelmed by tracking and tackling everything under the sun, we can focus on the growth metrics and initiatives that matter.
But it’s worth noting that metrics and data aren’t everything. We can manically chase after our targets, but we risk doing so at the expense of overall quality. If we’re only concerned with page views, then our content may erode to listicles of corgi gifs. Similarly, if we focus only on sign ups, those leads may be of lower quality and never end up activating.
As such, there are mechanisms outside of this growth model that help inform our decision making. We consider quantifiable parameters, such as activation and churn rates (deliberately omitted in this example and blog post for simplicity). We also set qualitative goals, such as “Build a brand people love” (a top-level marketing team objective to complement its other goal to get more signups) and “Karma” (one of Segment’s values, against which all decisions are made, even on an individual level). These safeguards help us make sure that we don’t just amp up our numbers, but that we build a sustainable, fundamentally useful business.
The State of Personalization 2023
Our annual look at how attitudes, preferences, and experiences with personalization have evolved over the past year.
Get the report
The State of Personalization 2023
Our annual look at how attitudes, preferences, and experiences with personalization have evolved over the past year.
Get the reportShare article
Recommended articles
Using ClickHouse to count unique users at scale
By implementing semantic sharding and optimizing filtering and grouping with ClickHouse, we transformed query times from minutes to seconds, ensuring efficient handling of high-volume journeys in production while paving the way for future enhancements.
5 Myths of the Composable CDP
Composable CDP - fact or fiction? We break down the five most popular myths.
Accelerating your time to value with effective Observability
Twilio Segment provides a comprehensive suite of tools for efficiently managing, activating, and analyzing your organization's data, ensuring transparency and empowering you to unlock its full potential effortlessly.