Make Data Actionable: Embed Product Usage Data into Salesforce
Oct 13, 2015
By Andy Jiang
As a data infrastructure company, we collect a lot of data for the purposes of -airquote- “making better decisions.” But we’ve found, that just having this data doesn’t help. If our team is going to use it on a daily basis, we need to put it right in front of their faces.
For our sales and success teams, this means embedding useful customer data directly into their workflows in Salesforce and Zendesk. This gives them the context of each user, so they can be more helpful in 1:1 conversations.
This will be a two part post! The first part will go over how we embed custom dashboards in our Salesforce to help our team better anticipate the needs of our customers. The second post will be how we modified our Zendesk to minimize resolution time and to win at customer service.
Anticipate Users’ Needs
At Segment, we give our customers the ability to “raise a hand” to kick off the sales process. Some of these “hand-raises” are explicit, like sending an email asking for a sales demo or chatting with our sales team on Olark.
But some of the signals are more subtle: turning on a business-level integration or a sudden spike of API calls beyond their plan. As a result, our Salesforce needs to look a lot more like a mission control center than a CRM.

To minimize any friction for the sales team to use the data, we pull all relevant account information right into their workflow. Using iFrames and Periscope, we’ve added custom dashboards to our Salesforce Account views. This way our sales team can be proactive about reaching out to our customers and have the right context to be helpful.
Embed Custom Dashboards in Salesforce
If you use Salesforce and Periscope, then here are the steps to set this up.
Other SQL visualization and query tools that allow embeddable reports include Mode, Chartio, and Looker. Please shoot us a tweet if we’re missing any!
1. Setup Periscope queries with product usage charts that can be filtered by account
We say “product usage” charts, but any chart that makes it obvious when one account has a higher value than most others would work. The goal is to help sales team members easily determine the value of the account from a glance. A basic approach would be to look at product usage, but you could also look at # of livechats, marketing content engaged with, or something like that.
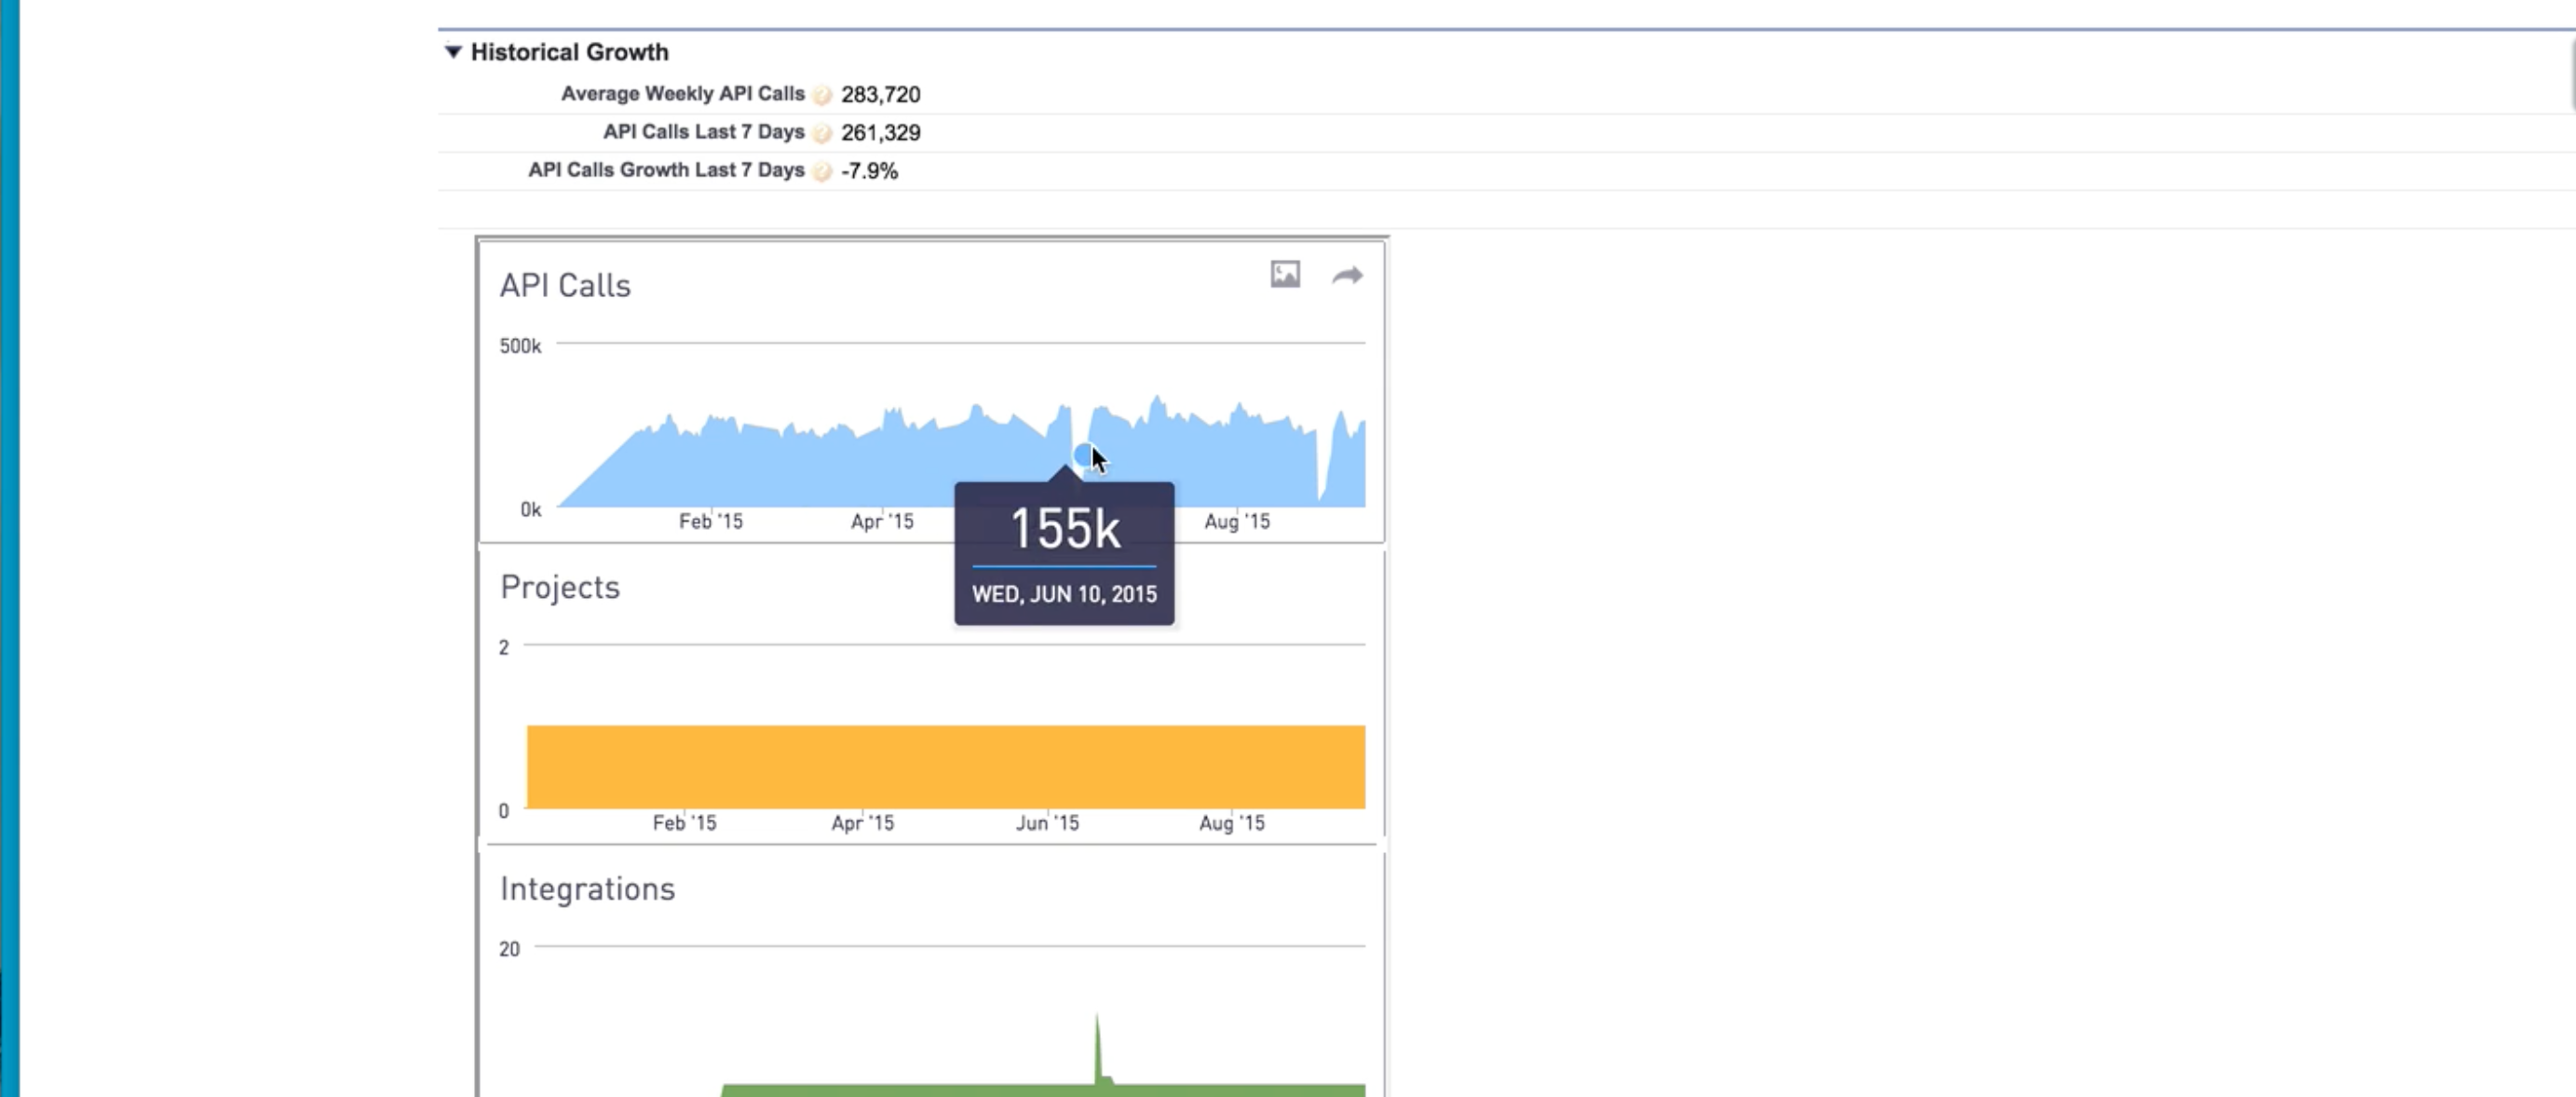
For us, our charts measure product usage via API calls, number of projects, and number of integrations. Here is the query we use to generate API calls per week. (Note: group_filter is the filtering parameter that will take the Salesforce account info to return the corresponding chart):
..which generates the top chart in this screenshot. (I added a few random group_filters so not to reveal any sensitive usage information):
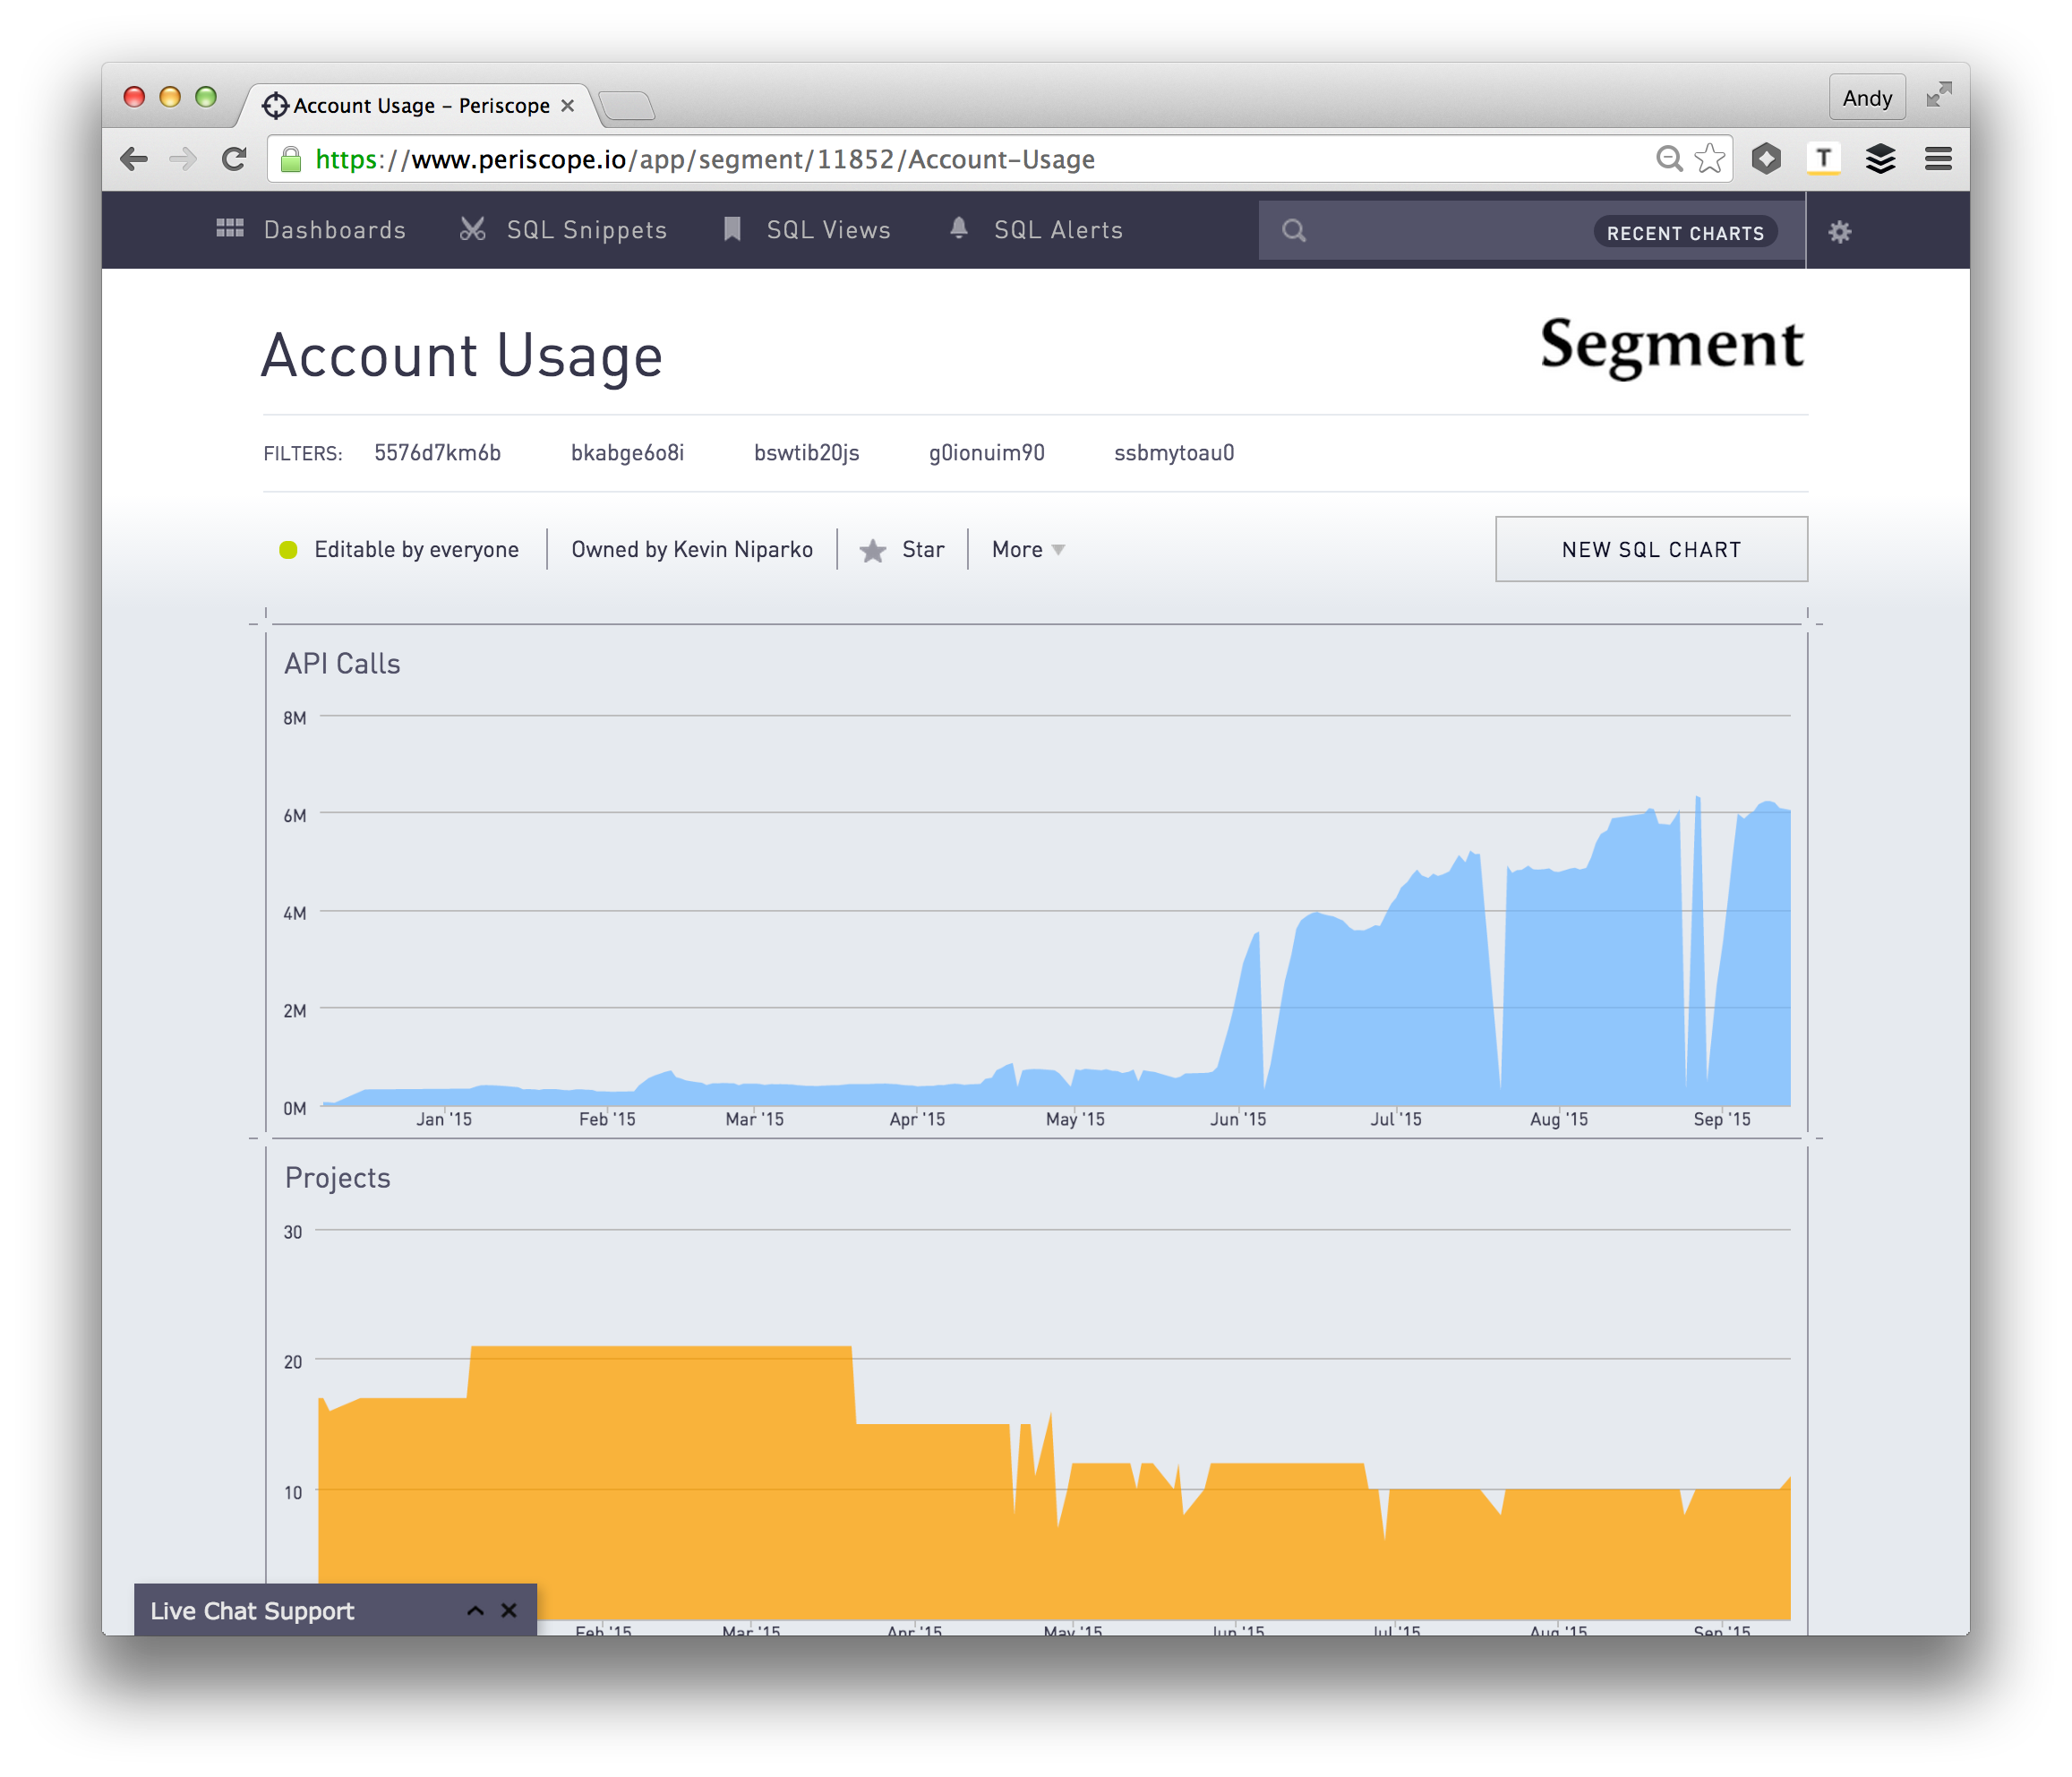
Great. Now we have to make these charts available to external domains. We achieve this by clicking “Edit Chart”, clicking the “Settings” tab, looking for “URL for CSV” on the right side, and checking off the “Enable API Access” box.
Note that the gif above is a report generated with a randomized set of data.
This will allow other domains to access the chart via this URL, which is important since we want to embed it in an iFrame in Salesforce.
2. Create a VisualForce Page with the embedded Periscope chart in Salesforce
In order to add custom visual pieces in Salesforce, you’d need to create a Visualforce Page. You can create a new Visualforce Page by first clicking “Setup” on the top right, then “Develop” and “Pages” on the left panel.
After clicking “Pages”, you’ll be sent to Visualforce Pages site, where you can create new ones or edit existing ones. Click “New” to create a new Visualforce Page.
On this page, you can write Visualforce Markup in the textbox that’ll become the HTML on the Salesforce page. Visualforce Markup consists of Visualforce tags, HTML, JavaScript, or any other web-enabled code that defines the user interface components and their appearances.
It’s in here where we add the following code:
Two things to note about this code.
Retrieve the Embeddable Periscope Dashboard
The function periscopeUrl creates a SHA signature of the apiKey with sha.js and a properly formatted Periscope URL that’ll retrieve the right dashboard.
Additionally, the data object that is passed to the periscopeUrl function follows Periscope’s embed options API requirements. The key here is to pass the appropriate filters that ensures the returned dashboard is only for this specific account. We pass {!Account.Name}, which grabs the name of the account from Salesforce.
More information on Periscope’s embed API.
Set up the iFrame
At the top, we have a div with id as container,which will be the container for the iFrame.
We assign the .src property of a new iFrame element to the URL generated by the function periscopeUrl (the .src property specifies the URL of the document to embed in the iFrame).
Then, we append the iFrame element to the #container div. The embeddable dashboard from Periscope, which is represented by a URL, now shows up in this Visualforce page.
3. Embed the Visualforce Page into the Salesforce Account view
Now that you have defined and saved a new Visualforce page, you can add this wherever you’d like in Salesforce.
In the Account page in Salesforce, click on “Edit Layout.” In the top most box, you’ll find a “Visualforce Pages” option on the left. Clicking it will show you the Visualforce Pages you have defined. Find the one you made and drag it onto the page. Finally, hit save!

Boom! Now your sales team is armed with the data they need in real-time!
Leverage Contextual Data
Aside from account usage data, we use a few other tools that help sales reps prioritize accounts and identify the right game plan.
ClearBit saves our sales team from having to visit a number of different websites (LinkedIn, Crunchbase, Twitter, etc.) to figure out the specifics of the company to whom they’re talking. Clearbit pulls in information such as and not limited to title, employee count, and even the technologies already installed on the user’s website. Ultimately, the information provided by ClearBit helps us prioritize and optimize our sales resources.
Infer helps our team immediately prioritize signups from the companies that are most likely to become our customers. Infer analyzes our historical closed transactions along with qualitative information they gather on our prospects via web-scraping to create a predictive model. Our team now gets an alert as soon as someone from a company that is likely to convert to a customer signs up for Segment, so that they can respond in less than 30 minutes.
Sure, keeping your data in a database for your product team to analyze is good, but that probably doesn’t help the other folks on your team. We’ve learned that collecting and tracking data isn’t enough. We’re continually looking for new ways to make that data actionable by surfacing it where our team makes daily decisions, like Salesforce, Zendesk and more.
How do you have your Salesforce lead or account view setup? Any custom widgets or dashboards you are using? Let us know on Twitter!
Part two of this post about customizing Zendesk to minimize resolution time can be found here.
The State of Personalization 2023
Our annual look at how attitudes, preferences, and experiences with personalization have evolved over the past year.
Get the report
The State of Personalization 2023
Our annual look at how attitudes, preferences, and experiences with personalization have evolved over the past year.
Get the reportShare article
Recommended articles
Using ClickHouse to count unique users at scale
By implementing semantic sharding and optimizing filtering and grouping with ClickHouse, we transformed query times from minutes to seconds, ensuring efficient handling of high-volume journeys in production while paving the way for future enhancements.
5 Myths of the Composable CDP
Composable CDP - fact or fiction? We break down the five most popular myths.
Accelerating your time to value with effective Observability
Twilio Segment provides a comprehensive suite of tools for efficiently managing, activating, and analyzing your organization's data, ensuring transparency and empowering you to unlock its full potential effortlessly.