How to Measure Customer Engagement (9 Key Metrics)
Discover the key metrics and KPIs to measure customer engagement effectively.
Discover the key metrics and KPIs to measure customer engagement effectively.
By tracking customer engagement metrics, businesses can uncover opportunities to improve brand experiences and proactively avoid churn. Here are three benefits that you can expect from grounding your customer engagement strategies in data.
Customer engagement metrics help businesses monitor what will ultimately determine their success: the value that customers are getting from interacting with your product or brand.
Customer experience has become the deciding factor among consumers when it comes to choosing between competitors. And 75% of consumers said they’re willing to spend more with a brand that nails it on the CX front.
By measuring customer engagement metrics, companies are able to have a clear understanding of how healthy their customer relationships are – and which areas of the business need work. This ensures that everything from product roadmaps to marketing campaigns are centered around customers’ wants, preferences, and needs.
Customer engagement metrics are also a great tool for personalization. Customer engagement metrics tell businesses what customers find to be the most valuable (e.g. certain features they favor) and what they’re interested in (e.g. listening to a specific genre or artist on Spotify).
With this information, businesses can create highly nuanced audience lists and tailor campaigns accordingly (e.g. the messaging or offers you send to your big spenders will likely differ from how you try to re-engage cart abandoners).
On the flip side, high engagement rates among employees can be just as impactful for a business (and worth tracking). A Harvard Business Review study among senior-level executives found that 71% said a high level of employee engagement was critical to business success.
Engaged employees are more motivated and passionate about the work they’re doing. By soliciting regular feedback (whether through manager one-on-ones, Net Promoter Scores, or surveys), businesses can ensure that employees feel empowered to do their jobs and have the autonomy and tools to do so, which contributes to the overall health of the business.
Every business will have different goals when it comes to customer engagement. And inside an organization, each team might be focused on their own metrics. For customer support, it could be strengthening NPS response rates, while the product team focuses on increasing active users.
However, a business should always have a “North Star” metric that all its subsequent goals are feeding into (something that’s tied to customer value, and not just revenue). Aligning teams around this goal is the first step in any winning customer engagement strategy, as it answers the question of: what are we all ultimately working toward?
Quantitative data like activation rates, churn, or product usage show what is happening with your customers. But it doesn’t necessarily tell you why.
This is where qualitative data comes in. User interviews, focus groups, and customer support interactions offer direct insight into customers’ emotions and motivations. As Segment’s former CEO Peter Reinhardt wrote: "20 hours of great interviews probably would've saved us an accrued 18 months of building useless stuff."
Customer engagement refers to all the interactions and communications that take place between a business and its (current or potential) customers. In other words: it’s a broad category.
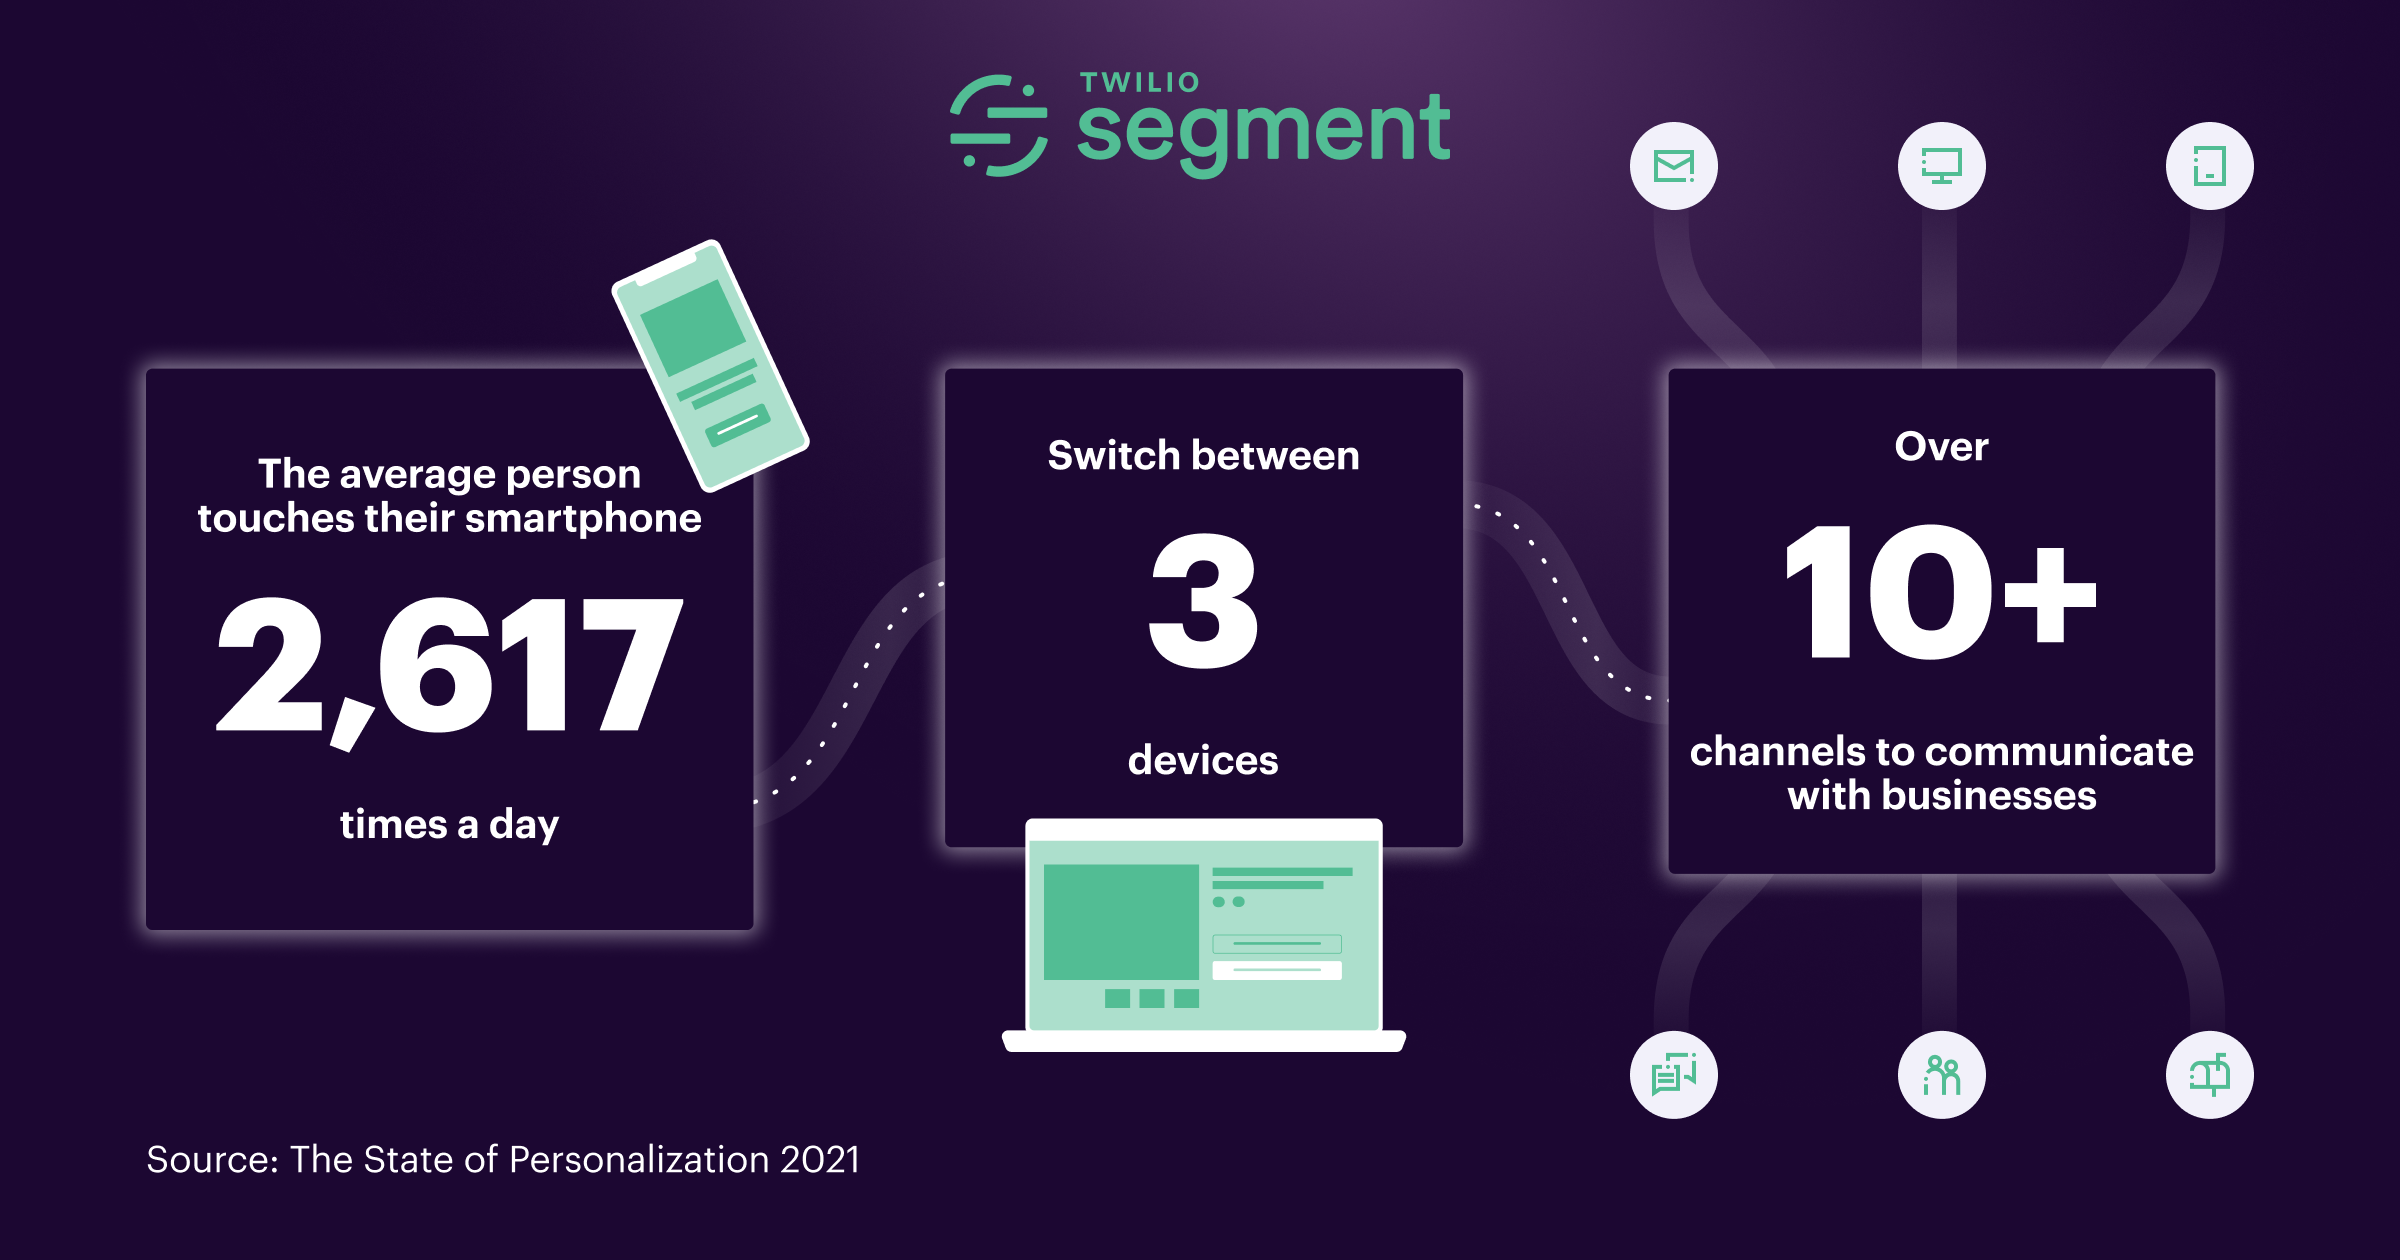
As consumers switch between devices, and use more than 10 channels (on average) to interact with a business, having a complete view of a person’s entire customer experience is tricky to say the least: 83% of companies admit they’re unable to turn fragmented data points into comprehensive user records.

This is why it’s essential for businesses to have a scalable data infrastructure in place, to not only track each customer interaction, but to clean and consolidate this data in real-time. It’s this necessity that’s been driving CDP adoption across industries:
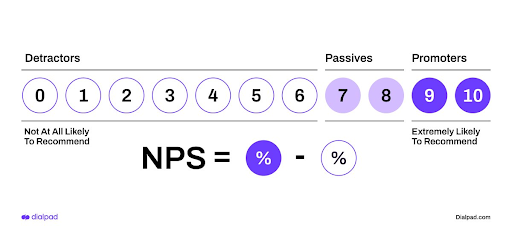
A Net Promoter Score (NPS) is a survey that highlights customer loyalty and the potential for word-of-mouth recommendations. These surveys ask people how likely they are to recommend your product or service on a scale from 0 to 10. Based on their responses, you would divide customers into three groups:
Promoters: everyone who answered 9 or 10.
Passives: people who picked 7 or 8.
Detractors: all respondents with scores from 0 to 6.

A customer satisfaction score (CSAT) asks users to rate their satisfaction with a brand or one of its products. Usually, customer satisfaction scores are done on a scale of 1–10, with the option to write in additional feedback.
While customer satisfaction scores aren’t a guarantee of people remaining loyal to your brand (or high spenders), they’re certainly a strong predictor. In fact, McKinsey found that when a cumulative customer satisfaction score went up by one point, it corresponded to a 3% revenue increase.
A customer effort score (CES) is a type of satisfaction survey that asks users to rate the ease of interacting with their brand on a scale of 1–7 (with 1 being the most difficult). A customer effort score can be used to measure the ease of everything from the ease of onboarding to their experience working with customer support to resolve a problem.
The goal of customer effort scores are – as the name suggests – to take away points of friction in the user experience, which could create a subpar customer experience (and block potential conversions).
Activation refers to the first time a customer gets value from your product or business. (It can also be described as their first “aha!” moment.) An activation rate is the percentage of users who’ve reached this milepost in a specific time frame compared to those that didn’t.
Activation rates are important to track as they can set the tone for the rest of your customer relationship. If people don’t quickly recognize the value of your product, they can start to lose faith in their investment. (Not to mention, low activation rates can point to a difficult-to-navigate interface or unsuccessful onboarding.)
And even though activation can be a slow-moving metric, it still packs a punch. In fact, at Segment we found that even a 1% increase in activation can grow to $1.5 million in annual recurring revenue (ARR) over five years.
Churn rate shows how many people abandon your service or product during a given time. Essentially, it's when someone stops engaging with your business.
Sometimes an opt-out metric determines your churn rate, like when a person un-installs an app. In other instances, a metric can be a strong predictor for churn: like a person who unsubscribes from your newsletter but continues to use your product.
Here’s how to calculate churn rate.
Say you had 10 users at the start of your measurement period and 6 at the end.
10 - 6 = 4.
4/10 = .4
0.4 x 100 = a churn rate of 40%.
Feature adoption looks at the percentage of users who interact with a specific feature of your product. This is an important metric as it relates to users’ “aha” moment. That is, have they recognized the value of this new feature? (If not, expect customer engagement, and overall interest, to wane.)
Low feature adoption can point to a variety of issues that businesses can quickly work to rectify: from targeting the wrong buyer persona to software bugs that need to be fixed.
There is no pre-defined approach to measuring feature usage. Often you do this by looking at the percentage of people in your total user base who interact with a specific feature in a given period.
Feature usage can tell you which parts of your app or service deserve further development and which to consider removing. They can also signal when users are trending toward churning if their feature usage or visit frequency takes a dip.
If you notice a user hasn’t engaged with your brand in a while, you can always leverage re-engagement campaigns to try to win back their business. These email or SMS campaigns usually consist of a few personalized messages that can flaunt your newest products and services, offer users an enticing discount, or serve up recommendations based on their past purchases or use of your product.
Social media is an excellent tool for brand awareness, promotion, and building a community of engaged customers. A few metrics that can be used to track social media engagement include:
Audience growth (along with following-to-followers ratio).
Retweets, shares, comments
Brand mentions
Post clicks
One qualitative metric that holds a goldmine of insights is customer reviews. This is direct feedback on how customers are enjoying your product, and the quality of your customer experience.
Reviews help fill in the context that’s often missing from quantitative metrics. On top of that, positive reviews can be excellent for customer referrals or word-of-mouth awareness (79% of consumers said online reviews are just as influential as personal recommendations for a business.)
Connect with a Segment expert who can share more about what Segment can do for you.
We'll get back to you shortly. For now, you can create your workspace by clicking below.
Customer satisfaction can be measured through surveys or direct feedback. Customer Satisfaction Scores (CSAT) ask users how satisfied they are with a product or brand experience (with respondents rating their answers on a numerical scale). Net Promoter Scores are somewhat similar, asking users to rate the likelihood of recommending a product or business on a scale of 1-10.
Other times, a business may ask a customer for feedback directly (e.g. asking for a review).
Customer service refers to how a business supports its customers across their lifecycle (before and after they convert). Measuring the effectiveness of customer service can be seen in customer satisfaction scores, activation rates, feature usage and product adoption, Net Promoter Scores, and more.
Customer engagement on social media can be measured with a variety of metrics, which include (but aren’t limited to):
Audience growth (e.g. number of followers)
Likes, comments, retweets, or shares
Post clicks
Brand mentions
Product engagement metrics are a measure of how people use your product. Similar to CSAT, businesses may look at a combination of metrics and customer feedback to better understand (and score) engagement. Some product engagement metrics include:
User activity (e.g. monthly active users)
How often users return to your product (AKA “stickiness”)
Feature usage
Net Promoter Scores
Conversion rate
Abandonment rate
And more!
Twilio Engage can consolidate customer data from across teams, apps, and tools in real-time to provide a complete picture of how people are engaging with your business.