Customer Segmentation Analysis: A How-to Guide
Learn how to analyze customer segmentation in 2023.
Learn how to analyze customer segmentation in 2023.
Customer segmentation analysis involves identifying the traits and behaviors that make some customer segments more valuable than others, as well as unearthing opportunities among segments you may have been underserving. With this data, you can direct most of your marketing resources to the customers who reflect those patterns to maximize ROI and retention.
Social scientist Daniel Yankelovich coined the term segmentation analysis in 1964, arguing: “Once you discover the most useful ways of segmenting a market, you have produced the beginnings of a sound marketing strategy.” At that time, companies relied on demographic data to segment their markets. But once they dug deeper, they found surprising insights that contradicted what they assumed about their customers.
Watchmakers, for example, discovered that lower-income customers were buying very expensive timepieces on special occasions. They also found that rich people were buying cheap wristwatches, only to discard them when they needed servicing or when a new style came along. So makers of cheap watches added jewels to their designs and mimicked the features of higher-end timepieces, broadening their customer base as a result.
Imagine how much more nuance you can unearth today with advanced software for data collection and customer analytics.
By the time you start customer segmentation analysis, you’ve already determined your basic customer segments based on factors you deem significant – for example, age, location, income, and device usage. Include a measure of customer value and quality, such as customer lifetime value (CLV), for each customer.
Your next step is to clear up and refine that data so you can find the patterns within it. First, you want to remove outliers – rare cases that can skew your analysis.
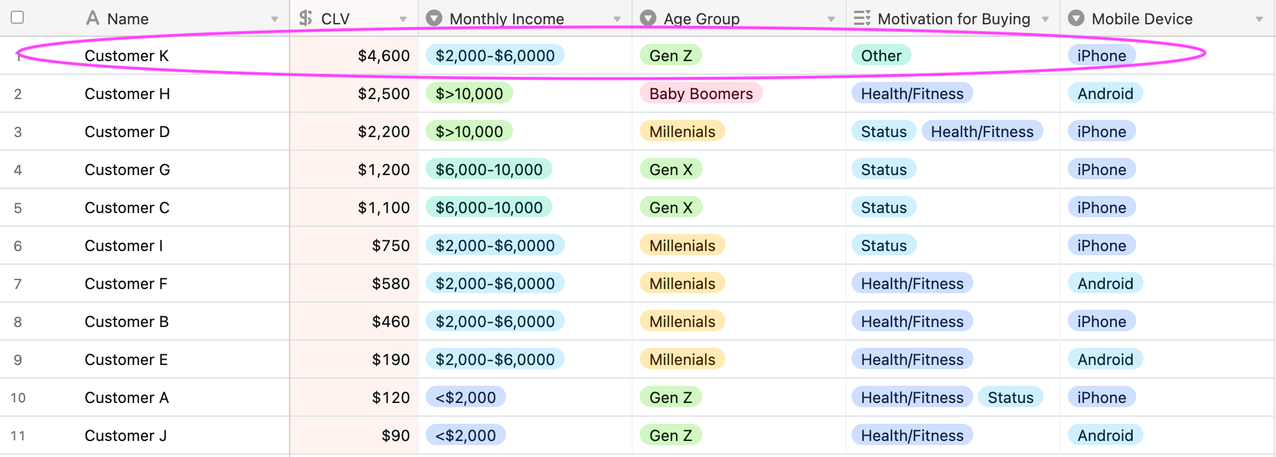
Let’s look at this hypothetical data set of smartwatch users. An oddity stands out: Customer K, the rare Gen Z consumer who bought a few of your most expensive smartwatches in one go. Turns out that even though Customer K is still a student, she’s also a YouTube influencer, so she earns more than her peers. She’s giving away the watches to her followers in a raffle, so she considers them a business expense.

As interesting as Customer K may be, you want to remove her from your data set before you start your customer segmentation analysis.
CLV is the dependent variable in your analysis. It’s influenced by customer traits and behavior patterns, which are independent variables.
It will be complicated and time-consuming to evaluate every piece of data you have about your consumers, so you’ll need to form several hypotheses about which independent variables affect CLV. You’d base your hypotheses on what you know about your business and your customers, as well as on input from your sales, customer support, marketing, and product teams.
In the (extremely simplified) hypothetical example above, we’re analyzing how the following independent variables affect CLV, which is the dependent variable, among the customers of a smartwatch company:
monthly income
age group
motivation for buying
type of mobile device owned
In real life, you’d ideally have more nuanced data about your customer segments. For example, a study on smartwatch customer segments included factors such as a person’s cultural background and whether or not they also own a traditional timepiece.
We present three analytical methods here, starting from the simplest one. You can start with either a lightweight or a tree-based clustering analysis (or both) to narrow down your hypotheses before moving on to regression analysis.
Lightweight clustering analysis is suitable for small customer bases or limited segmentation criteria. This method helps you check if there’s a correlation between a customer’s quality or CLV and individual segmentation criteria.
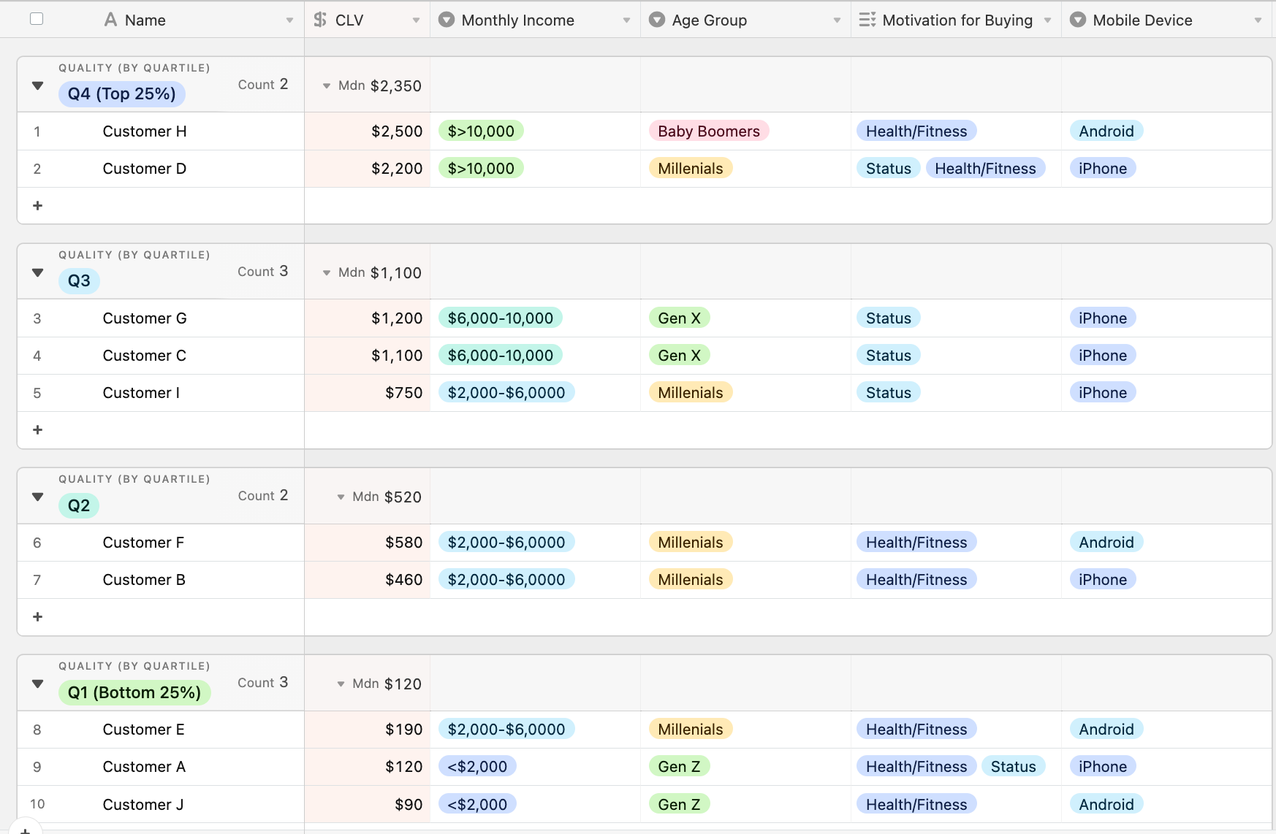
In the example below, we sorted the data set by CLV and saw that:
The customers with the highest CLV (>$2,000) earn more than $10,000 a month.
Health/fitness is a common motivation for customers who spend the most on smartwatches.

You could also sort the data set by buyers’ motives and see that:
Android users buy smartwatches for health/fitness reasons; iPhone users for status and or/ health/fitness reasons.
Gen Xers buy smartwatches as status symbols.

These are basic observations that you can use to refine your segmentation hypotheses. But you need to run them through the stress test of regression analysis (we’ll get to that soon) to find out if they’re significant indicators of CLV.
Tree-based clustering is a deeper analysis that examines the traits that set apart certain customer segments. To begin, group your customers by a quality indicator, like CLV. Divide your data set into CLV quartiles or deciles.

Next, ask questions based on your hypotheses. You can illustrate this process in branches like those you find in a decision tree. The end result should show the traits and behaviors that are both common to customers within each group and distinct from those of other groups.
For example, if your hypothesis focuses on motivation, begin by asking: Is the customer buying a smartwatch for health and fitness motives?
You’d then break this down into more clusters based on more criteria you’ve identified. Let’s say you’ve included the following in your data set:
value of accessories purchased
frequency of accessory purchases
app subscriptions
age
income
With those criteria, you’d end up with more narrowly defined clusters that describe your most valuable customer segments. And if your analysis proves your hypothesis wrong, start again with a different criterion.
Regression analysis is a statistical method for determining which variables strongly affect the desired outcome and which ones have little to no influence. Depending on the type of analysis, it can explain why the dependent variable changed (increased or decreased) or predict how a change in one factor affects the dependent variable. It also helps you understand the relationships between variables, such as whether an increase in X correlates with an increase in Y.
When it comes to customer segmentation, regression analysis validates (or invalidates) your hypothesis about which customer traits and behavior patterns affect CLV. This type of analysis is ideal for massive data sets, for which lightweight and manual tree-based clustering analyses are impractical.
Say you want to find out what factors increase CLV among Gen X buyers. You’d use regression analysis to answer the question, Which of the following variables makes Gen Xers spend more on smartwatches?
growing older
having more health problems (you can also use proxy measures like more frequent doctor’s visits)
increasing income
using an iPhone
premium pricing of smartwatches
If you find that those with increasing income and more health problems spend more on smartwatches, try taking out one of those variables and see the impact on CLV. If you take out health problems, do rich Gen Xers stop buying smartwatches? On the flip side, does stagnating income prevent Gen Xers with more health problems from spending money on smartwatches?
The answer, like Yankelovich said, will lay the foundation for a smart marketing strategy.
For example, if health turns out to be the most significant driver of smartwatch adoption among Gen Xers, adjust your four Ps of marketing accordingly: you’d sell a smartwatch product with health and fitness sensors; set a higher price; place the watches in both lifestyle and healthcare stores (virtual and physical); and tailor promotions, PR, and sales to Gen X, healthcare practitioners, and insurers.
Since regression analysis is a complex mathematical calculation, you don’t have to do it manually. You can use customer analytics tools like Qualtrics and customer engagement platforms like Twilio Engage.
Next, evaluate each segment based on:
Customer value — Segments with higher average and median CLV indicate higher customer quality. If there’s a huge difference between the highest and lowest CLV within that segment, you may need to run further analysis to narrow down that group.
Segment size — Choose segments that represent a sufficient market for you to capture, taking into consideration your goals for revenue and growth.
Potential for growth — Consider how segments will grow in the future based on market trends, demographic changes, and upcoming regulations.
To finalize your customer segments, focus on those who exhibit the variables that best predict high CLV and combine groups with many overlapping traits. Make sure it’s easy for teams across your organization to understand what makes each segment distinct. Avoid narrowing segments down so much that very few customers would fit the criteria.
Choose the customer segments to which you will direct most of your sales and marketing efforts and budgets. You want to target those with high quality and sufficient size. That’s not to say you must ignore small but high-value segments. For instance, the baby boomer who buys a smartwatch to track their health and fitness looks like a niche customer, so you need to evaluate whether that segment’s revenue and ROI compensate for its size.
Consider the segment’s potential for growth, too. The growing use of remote health monitoring apps and equipment may lead more boomers to use pricey smartwatches that can track their blood pressure, heart rate, and other health indicators.
Now that you’ve confirmed the traits and behaviors of your ideal customers, you can use them to identify and target prospects that have the most potential to become loyal, valuable customers.
Connect with a Segment expert who can share more about what Segment can do for you.
We'll get back to you shortly. For now, you can create your workspace by clicking below.
Customer segmentation analysis helps you identify the traits that significantly affect a customer’s value and determine which customer segments you should concentrate your marketing resources on.
Choose appropriate segmentation methods and validate your hypotheses through customer segmentation analysis. Identify prospects who resemble the traits and behavioral patterns of your most valuable customer segments.
Customer segments may be demographic, geographic, value-based, needs-based, psychographic, or technographic.
Your customer segmentation system may include tools for data collection and analysis, including relational databases, data warehouses, customer data platforms, and tools for running regression analysis.
Twilio Engage is a customer engagement platform that’s built on top of the Segment customer data platform. Segment unifies customer data from multiple sources to create in-depth profiles and identifies customer segments based on shared traits and behaviors.