Drive up average revenue per user (ARPU) with Segment and Mixpanel

This guide will focus on teaching you how to track e-comm data in Mixpanel to allow for meaningful explorations. You’ll be able to see how different analyses from funnel and insights reports can help you identify opportunities to make change.

Mixpanel Made by Mixpanel

What do you need?

  • Segment

  • Mixpanel

Easily personalize customer experiences with first-party data

With a huge integration catalog and plenty of no-code features, Segment provides easy-to-maintain capability to your teams with minimal engineering effort. Great data doesn't have to be hard work!

On this page

NOTE: This dashboard An icon of a outbound link arrow  based on Mixpanel’s E-Comm sample data set illustrates this recipe.

In the e-commerce industry, one of the fundamental goals is to drive up spend per user, commonly known as ARPU - average revenue per user. Driving up ARPU is an indication that our customers are getting value from our platform. Sustained ARPU increase is a strong indication of growth. 

There are many initiatives - long-term (sustainable) and short-term (to meet certain needs), that e-commerce companies take to increase this metric. Long-term initiatives can include loyalty programs to encourage repeat purchases, while short-term initiatives can include promotions to capitalize on celebrations or to meet specific metric needs. 

Some possible ways to increase ARPU include: 

  1. Start a customer loyalty program 

  2. Create order minimums for free shipping

  3. Cross-sell complementary products via bundling & promotions

  4. Offer limited time promotions

For this recipe, we are going to focus / deep-dive on “Offer Limited Time Promotions.” Our goal is to drive up ARPU by influencing our customers to buy higher-priced category items.

Step 1: Send e-commerce events with Segment’s Mixpanel (Actions) Destination

With this Segment-Mixpanel setup, you can send your products nested within arrays in the Order Completed event as described in the Segment ecommerce spec to Mixpanel without any further transformation.

Depending on the analysis you’d like to run, set Generate Purchase Event Per Product to true. This setting effectively “flattens” the array of objects in the Order Completed event by tracking a Product Purchased event for each item in the array. This enables more sophisticated analysis on a per-product basis in Mixpanel, e.g. purchase conversion by product category. NOTE - If you are using the Mixpanel Class integration, we encourage you to migrate to the new integration described above. Follow our migration guide here

Step 2: Identify which product category(s) to be targeted for promotion.

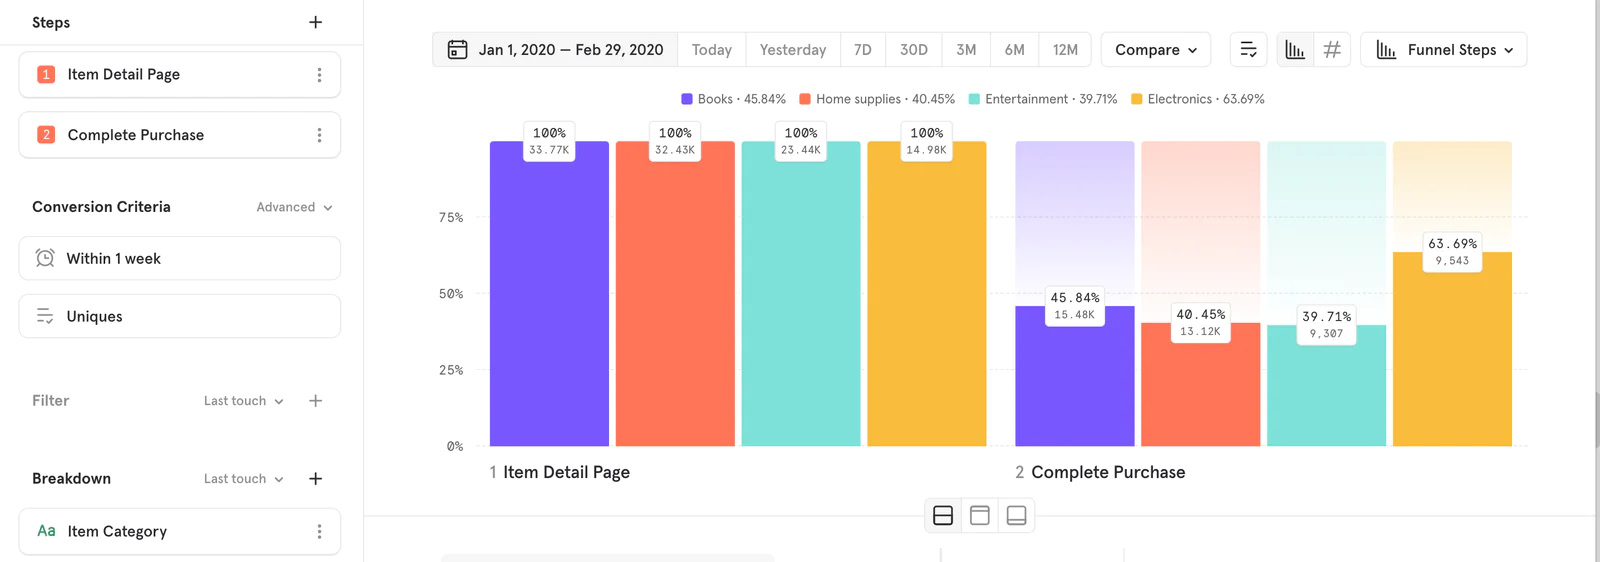
1. Identify which category(s) has low purchase conversion: view item -> complete purchase
Segment and Mixpanel integration diagram.

2. Identify which category(s) has higher priced items on average

Steps to send e-commerce events with Segment.

3. Settle on category(s) - Low purchase conversion AND high avg. price

The first 2 parts here are purely data-driven and factual. These data-points should be the main input to your decision making process. The last part, though, is more art than science. In our example above, these are some of the categories we might consider for promotions: 

  • Home Supplies

    • This is relatively low in purchase conversion at 40.45%

    • Second most ordered product category, meaning it’s a sizeable base

    • Avg price per item of this category is similar to the others at $461.20

  • Entertainment:  

    • This is lowest in purchase conversion at 39.71%

    • Third most ordered product category, meaning a slightly smaller base size 

    • Avg price per item of this category is similar to the others at $460.50

Given Home Supplies has a low purchase conversion and a larger base size, which means any change here will impact overall ARPU more significantly, we’ll start with running promotions for the “Home Supplies” Category.

Step 3: Identify user cohorts to target the promotion using ‘view users’ in drop-off funnel

For a successful campaign, it is imperative that you understand who the audience is. Who are you trying to influence based on their observed behavior? In this case - we are trying to influence users who have shown intent for the category, but stopped short of purchase. 

To identify these users, re-visit the chart created in 2.1. 

  • Click ‘view users’ on the non-converted part of the funnel to view the list of users

View users in drop-off funnel in Mixpanel.
  • Create a ‘cohort’ from this list which can be then exported to engagement tools like Twilio
Creating cohorts for targeted promotion.

Now that we’ve identified the cohort as non-converted users for the Home Supplies category, we can create a promotion using this cohort as a target.  

Step 4: Monitor and measure success or promotion 

To measure whether this promotion has worked, we’ll need to track a few key metrics. 

Remember: given this is hypothetical and no promotion is actually being run, we can't truly test the metrics.  These graphs would ideally reflect the results of our promotion.

  • Main Metric #1 - ARPU (Avg Revenue Per User). Has this gone up? 

ARPU metric tracking graph.
  • Main metric #2  - Purchase conversion rate by product categories on a time-series. Has this gone up for the “Home supplies” category?
Purchase conversion rate tracking graph.
  • Measure both the above metrics at an overall level, but also just for the cohort of users targeted with the promotion.
Insights line chart for metric changes.
  • Plot both of these metrics on an insights line chart to see how they change over time.

NOTE: A couple of things to consider before rolling out promotion  -- 

  • If you are sure this promotion will work and just want to ensure you can measure the impact, OR you have less time to drive up ARPU, the above steps and metrics should suffice.

  • If you are unsure if this promotion will work, you could set this up as an A/B test to make a decision on the promotion. 

Wrapping up

Following this recipe, you’ve learned how to go about measuring ARPU (Average Revenue per User) using Segment and Mixpanel:

  1. Reviewed how to use Segment Mixpanel (Actions) Destination to track ecommerce events in Mixpanel.

  2. Deep-dived on how to use Mixpanel to identify opportunities based on hypothesis.

  3. Learned how to identify target set of users in Mixpanel to engage with around identified opportunity.

  4. Built a dashboard to monitor and measure impact of initiative (change).

Getting started is easy

Start connecting your data with Segment.