Recipes
Mobile

Identifying the KPIs for your mobile app

In this recipe, we will explain how to determine the KPIs (key performance indicators) that marketers should understand and be able to track before launching campaigns. We will also explain how and where to calculate KPIs within a mobile measurement provider’s (MMP) dashboard and how to act on the data provided.

Adjust

Made by Adjust

What do you need?

  • Mobile tracking provider implemented—in this recipe we’re using Adjust

  • Creative formats ready (banner, video, playable, etc.)

  • List of ad networks you have chosen to run campaigns on

Identify your KPIs with Segment

With a huge integration catalog and plenty of no-code features, Segment provides easy-to-maintain capability to your teams with minimal engineering effort. Great data doesn't have to be hard work!

Get started for free

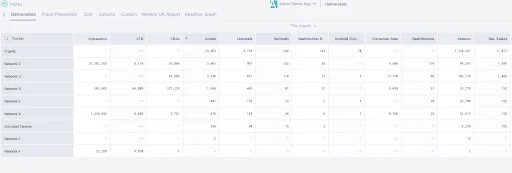
KPIs are critical to assessing the performance of your mobile application and the campaigns you are running. Some KPI examples include clicks, installs, return on ad spend (ROAS), retention rate, and so on. Below is where you can find these above KPIs within the Adjust dashboard.

adjust 1
Sample Adjust metrics dashboard

Step 1: Implement Adjust SDK for measurement/attribution

Adjust can calculate and display KPIs in real time. This way, you can get an instant view of your marketing performance and immediately identify where to drill-down for further analysis.

In order to enable this, you first need to integrate the Adjust SDK into your app.

Step 2: Connect Adjust to Segment 

There’s a ready-made integration between Adjust and Segment, whether you’re using a native SDK or using a sever-to-server integration with Segment. It isn’t difficult to set it up. You’ll just need to add a few lines of code. You will also want to make sure all of the requisite callbacks are set up to transfer data between Adjust and Segment properly. That’s what allows you to correctly attribute activities like installs, clicks, etc. in Segment.

For more detailed implementation steps, click here.

Pro-Tip: When you want to start tracking in-app events, normally, you’d have to pre-define custom events in Adjust. But if you already have your events set up with Segment, you can just link Adjust event tokens (used to map in-app events) to the Segment events you already have set up. 

Step 3: Calculate the KPIs that are most important to your company or app

Different growth stages require different approaches. If your app is just getting off the ground, then click-through rates and installs would be the KPIs you’d want to focus on. If you’re just starting to put paid marketing against a thriving app, then retention, and LTV would be what you’d optimize towards.

It’s all about figuring out what’s the most important to your business goals and using these KPIs to measure how smoothly you’re moving in your desired direction. These five are considered baseline KPIs for many mobile marketing teams, but it’s really up to you to define what performance looks like in your marketing.

KPIs and definitions

1. CTR (click-through rate): This measures if audiences click on your ad, confirming if an ad creative is effective. What you measure can be split by channel, geo, source, and more, allowing you to segment your audience. 

Calculation = Total Clicks / Total Impressions

adjust 2
Adjust product visual that displays click through rates on the different ad networks you could use

2. ROAS (Return on ad spend): ROAS tracks the return on investment you get on the campaign spend you make, defining whether there were valuable returns on your advertising efforts. 

Calculation = Total Revenue / Total Spend

3. LTV (Lifetime value): LTV is a prediction of the net profit attributed to an ongoing relationship between you and your customer. This metric provides a running estimate of how much a particular consumer is likely to spend on your app. 

Calculation = Total value of a user (in-app purchase value) - Cost to acquire user (CPI)

4. Conversion Rate: A conversion rate is the percentage of users who completed the desired action, for example, downloading your app from the app store. 

Calculation = Total number of impressions / total number of installs.

5. Retention/Churn: Retention and Churn are two separate KPIs that are very closely tied to one another. Retention rate shows the percentage of users who are still using an app after a certain number of days. Churn rate measures the rate at which users stop coming back to your app. Churn is essentially an inverse of retention. 

adjust 3
Retention rate chart in Adjust

Step 4: Set KPI goals

Examine the last few weeks of your KPI reporting and use that to inform your KPI goals for your team. A few factors to consider when setting these goals are:

  • How important it is to achieve a certain level

  • Where the KPI has been trending towards

  • How many resources you have on hand to achieve this goal

  • If there are any new strategies or tactics that can accelerate you towards the goal

Step 5: Monitor goals and optimize accordingly

Whether you use Adjust or Segment to track these KPIs, it’s important to keep a constant pulse on your performance by checking these KPIs a few times a day. With Adjust, you can see all of these KPIs in our dashboard using our Deliverables and Cohorts views.

If things are going according to plan, you can try to amplify results by dedicating more ad spend on specific campaigns. If things are not manifesting the way you want, you can pause your spend to replan your strategy.

Wrapping Up

Here is what we’ve done in this growth recipe:

  • Explained the importance of setting up KPIs

  • Defining five of the most important KPIs to measure

  • How to calculate each KPI

  • Where to locate these KPIs in the Adjust dashboard

Getting started is easy

Start connecting your data with Segment.