Build a Data Health Dashboard With Segment Protocols

Segment Connections is a powerful tool to unify data across all business tools. But not all data is good data. As the common trope goes, “garbage in, garbage out.” How do we prevent this bad data from overwhelming us?

Greg Yeutter Made by Greg Yeutter

What do you need?

  • Segment Protocols

  • Mixpanel

Easily personalize customer experiences with first-party data

With a huge integration catalog and plenty of no-code features, Segment provides easy-to-maintain capability to your teams with minimal engineering effort. Great data doesn't have to be hard work!
On this page

Segment Protocols enables Business Tier users to proactively prevent and transform bad data so it is clean and consistent across tools. The first major steps to prevent bad data are:

  1. Creating a tracking plan to define what bad data looks like

  2. Analyzing which data points are not adhering to the tracking plan

Segment Protocols provides tools to help you monitor which data points are not adhering to the tracking plan. We also provide the ability to analyze bad data in downstream analytics and business intelligence tools. In this guide, we will explore how Protocols enables you to manage your data easily.

For this recipe, we’ll use Mixpanel to build the dashboard, but the concepts are similar for other Segment-supported analytics tools. We’ll set up this dashboard for one Source, but other Sources can be added to the same dashboard by repeating steps 1-4.

Step 1: Create a Tracking Plan

Log into the Segment web application. If you have not already connected a Source, do so now.

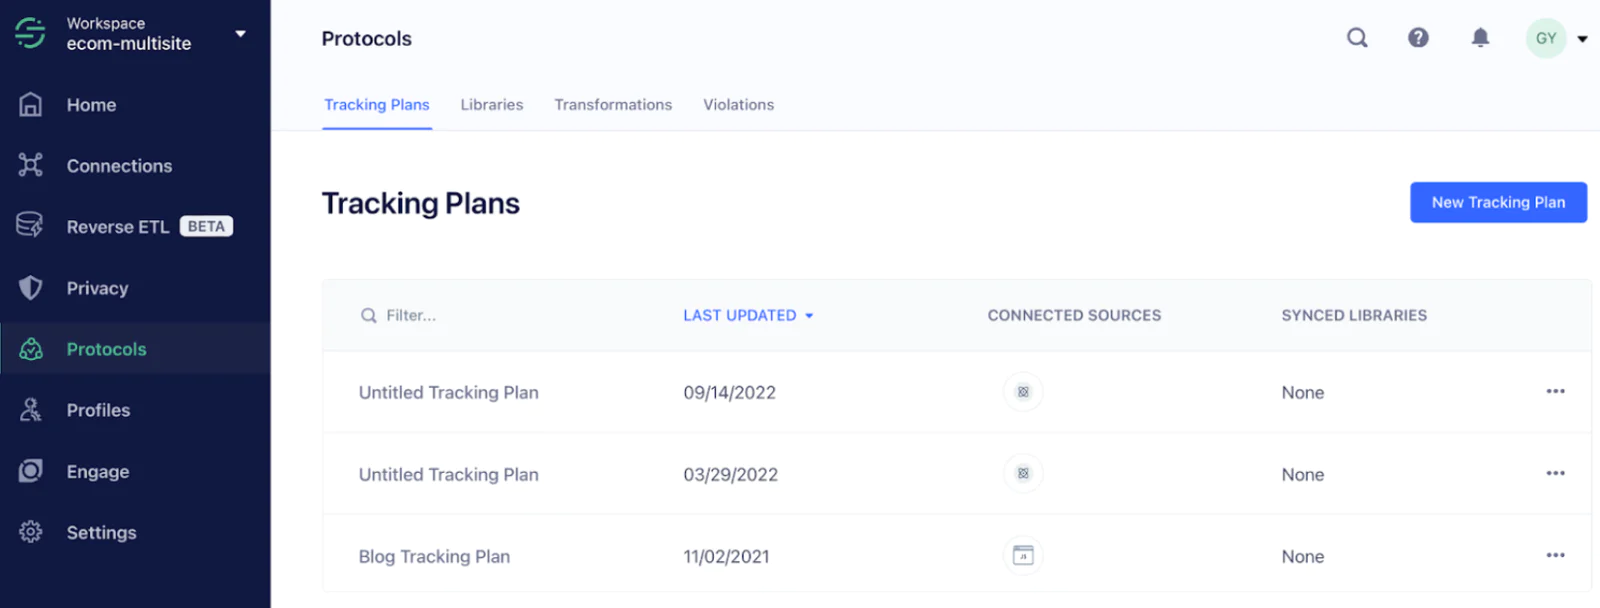
Once the Source is enabled, head to the Protocols tab, and click New Tracking Plan:

click New Tracking Plan

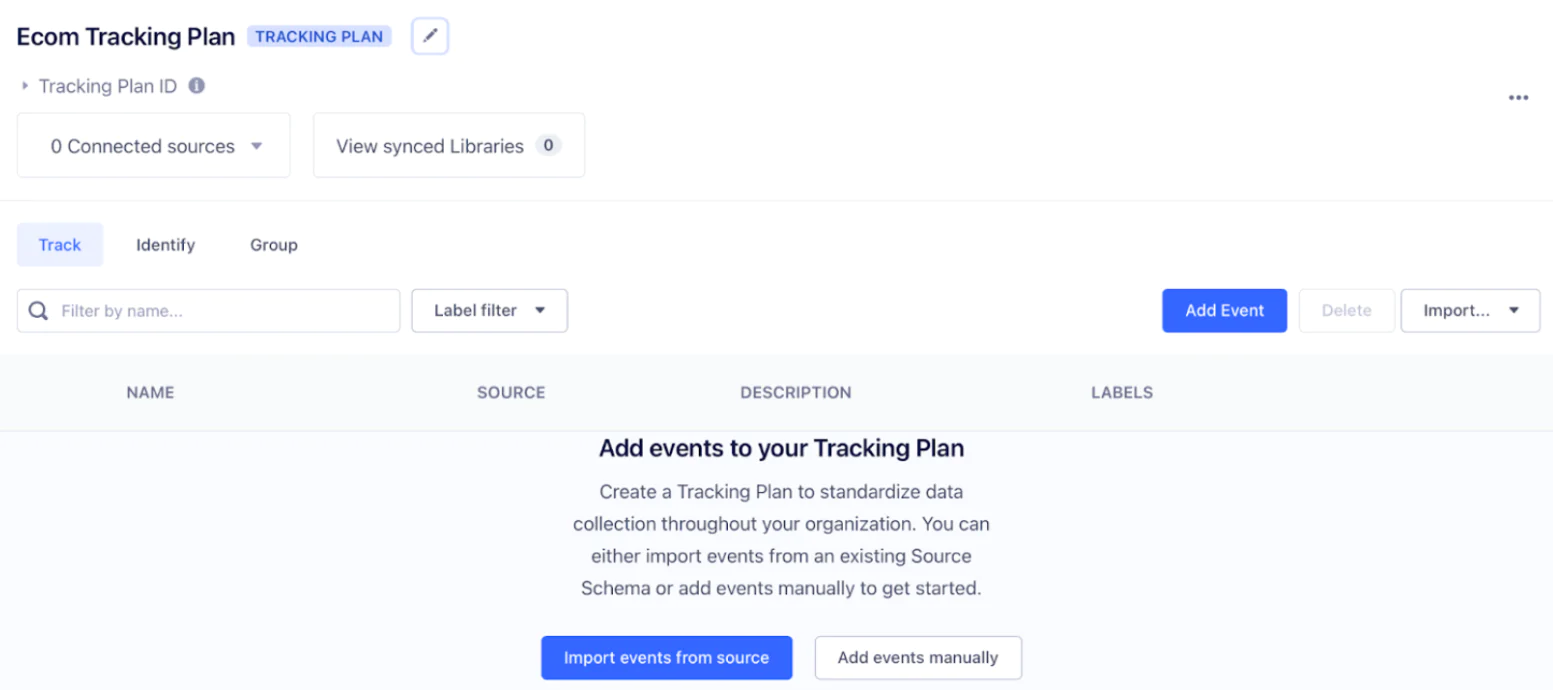
Give your tracking plan a name. If your Source has already sent in data, you can easily build your tracking plan based on events already sent in. In this case, click Import events from source. If this a new Source with no events yet, select Add events manually:

Add events manually

Select the Source, then click Import and save:

click Import and save

The tracking plan will auto-populate with events that have already flown in. If you click the arrow next to any event, you can see all properties or traits that have been seen:

tracking plan will auto-populate with events

From here, you can choose to require certain properties or even enforce the data type:

choose to require certain properties or even enforce the data type

You may also add events and properties to the tracking plan manually. Refer to the Segment documentation for a complete guide to creating your tracking plan.

Once you are happy with your tracking plan, click the dropdown that says 0 connected sources, then Connect source. Select your Source, then click Next:

Connect source
Select your Source

Review the consequences, then click Connect source:

Review the consequences

Your tracking plan should now be live for the selected Source.

Step 2: Configure the Schema

Now, we’ll choose what happens to events that violate the tracking plan. Potential reasons for violation include:

  • Missing required properties. For example, for an order_completed event, if the price property is set to required and missing, the event is in violation.

  • Invalid property value data types. For example, if you require a String but receive an integer for an order ID, throw a violation.

  • Property values that do not pass applied conditional filtering. For example, for an email_opened event, if the campaign_id property does not satisfy the regular expression, throw a violation.

Protocols can also monitor for unplanned events, properties, and traits that are not explicitly listed in the tracking plan.

We can choose to allow or block violations and unplanned events:

  • Allow: send to the Destination, despite being unplanned or in violation

  • Block: do not send to the Destination

For unplanned or violating event properties and traits, we can additionally choose to omit those properties or traits while sending the non-violating and planned properties/traits to Destinations.

To set this up in your Segment workspace, navigate to the desired Source and select Settings, then Schema Configuration:

Configure the Schema

In the first section (Unplanned Events, Properties and Values), use the matrix to decide which values are allowed, blocked, or omitted:

decide which values are allowed, blocked, or omitted

Note that this is done by Source, so the settings applied here will not apply for other Sources.

Step 3: Forward Violations & Blocked Events

To demonstrate the concept of violation forwarding, we are going to set up an additional Source, which I will call a Violation Source. The Violation Source receives violations and/or blocked events from the standard Source. From the Violation Source, events can be sent to an analytics Destination (such as Mixpanel) for monitoring.

Forward Violations & Blocked Events

To set this up, we are going to create a new Source. From the Connections tab, select Sources then Add Source:

create a new Source

Select JavaScript as the type, then Add Source:

Select JavaScript as the type
Add Source

Give it a name such as Violation Source, then click Add Source:

Give it a name

We then want to return to the Schema Configuration page from step 2. From the Segment webapp, navigate back to the standard Source (not the Violation Source) and select Settings, then Schema Configuration:

return to the Schema Configuration

Scroll to Forwarding Settings, then enable forwarding for Violations and/or Blocked Events and Traits, and select the Violation Source.

enable forwarding

Step 4: Connect Your Analytics Tool

Now, we’ll set up Mixpanel (the Segment Destination where our dashboard will live) and connect it to the Violation Source. This will be a brief overview of setting up Mixpanel, but you can refer to the full instructions within the Mixpanel (Actions) Destination Segment Documentation.

From your Segment workspace under Connections, click Destinations, then New Destination:

Connect Your Analytics Tool

Search for and select the Mixpanel (Actions) Destination. Click “Configure Mixpanel”:

Search for and select the Mixpanel
Click “Configure Mixpanel”

Connect the Violation Source, then click Next:

Connect the Violation Source

Give your Destination a name, such as Mixpanel Violation Destination, then click Save:

Give your Destination a name

If you haven’t already, in a separate tab, create a free Mixpanel account.

Log into your Mixpanel account, then go to the Mixpanel project settings and copy the unique token and API secret.

Back in Segment in the Basic Settings tab of the Destination, paste the token and secret. Turn on the switch for Enable Destination, then click Save Changes:

urn on the switch for Enable Destination
Save Changes

At this point, ensure data is flowing in from your standard Source using the Debugger tab.

Debugger

Step 5: Set Up Your Dashboard

In this step, we’ll create a basic data quality dashboard showing:

 1) all violating events over time 

 2) the events ranked by number of violations. 

This will help you understand the recency and total amount of bad data, respectively, broken down by event. You are welcome to create more, but this is a solid starting point.

Log in to Mixpanel, then select New Dashboard in the upper-left corner:

Set Up Your Dashboard

Give the dashboard a name, then click Add, then Insights Report:

Give the dashboard a name
Insights Report

Give the chart a name, such as All Violating Events, then under Events & Cohorts, select Your Top Events. Click Save:

Give the chart a name

If you go back to the Violations dashboard, you should see the first chart. Click Add content to create another chart. Select Insights Report again:

create another chart
Select Insights Report again

Give it a name, such as All Events with Violations. Under Events & Cohorts, select Your Top Events again.

Give it a name

On the right side, choose Bar chart, then click Save:

choose Bar chart

Back in your dashboard, you’ll see both charts. You did it!

Back in your dashboard, you’ll see both charts

Wrap Up

In this recipe, we created a tracking plan, defined what to do with violations, and forwarded violations to Mixpanel to create a centralized data health dashboard. There are many more possibilities to understanding your data health, such as forwarding violations to Slack and enforcing your tracking plan in code before it is even pushed to production with Typewriter. To learn more about the possibilities of Segment protocols, refer to the documentation and this video.

Getting started is easy

Start connecting your data with Segment.