This report gives us insights into the conversion funnel over a given period. The example above is over the Last Month, but this can be set to a specific window in time, like the last day, week, year, or even an absolute data range. We will talk about the benefits of using these date ranges in the final step.
Once your conversion funnel report is built, you can see what changes affect your conversion funnel. For instance, if you’ve recently changed your login flow or checkout process, you may compare your conversions from 3 months before the change against the results 3 months after. These types of comparisons allow you to see if updates or new steps in your onboarding flow are helping out with conversions or hindering them. You can also use these charts to monitor your conversion rate in real time. Even better, you can put a variety of onboarding reports, including a conversion funnel, on a Moesif Dashboard so your team can easily access the data to inform them.
In this recipe, we’ve seen how you can use Moesif and Segment together to track user actions and report on the effectiveness of your onboarding flow and how customers are converting. In all, we covered how to::
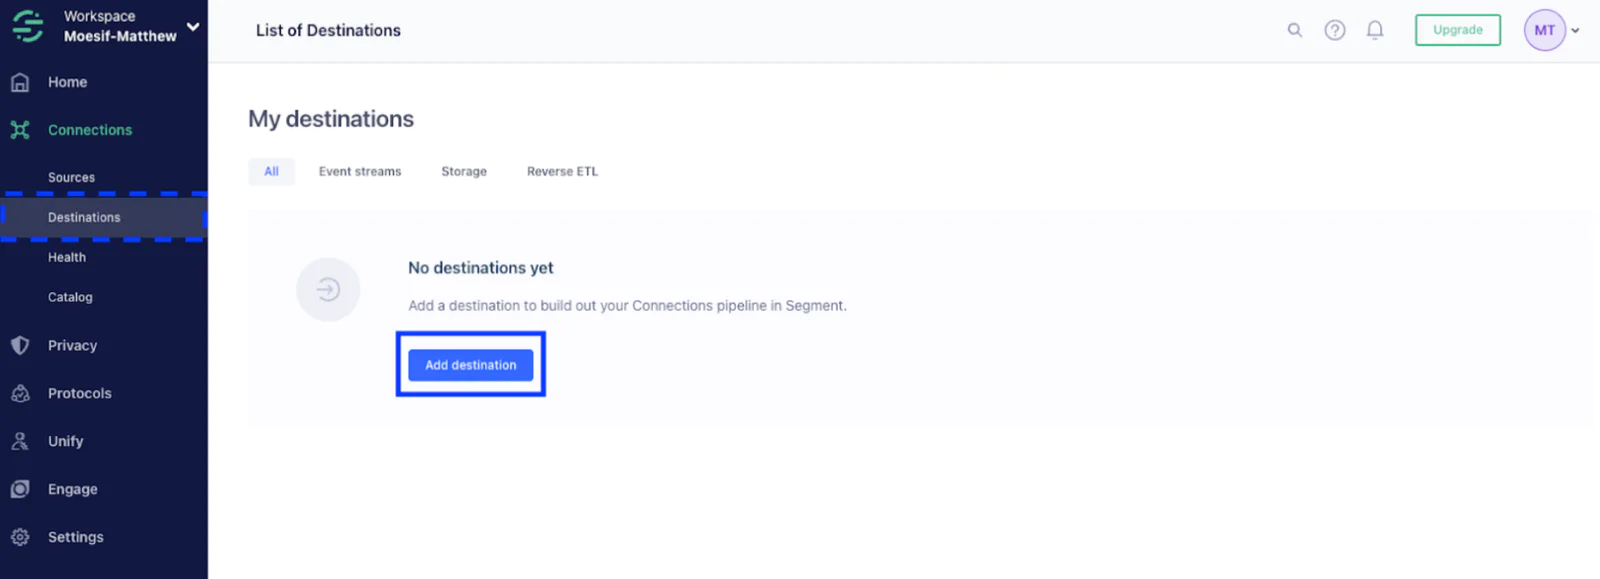
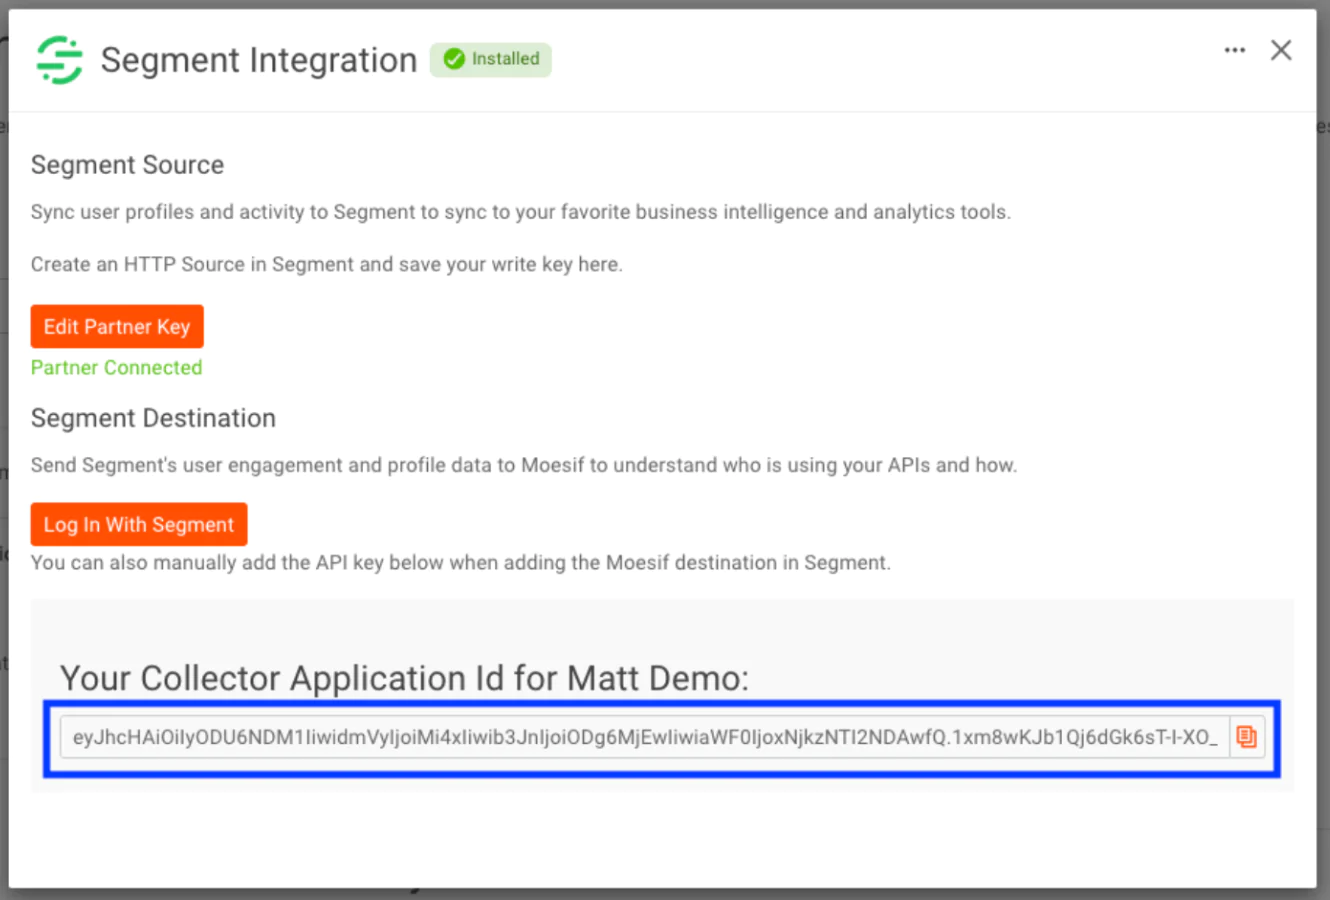
Add Moesif as a Segment destination
Confirm the integration is working correctly
Build a conversion funnel report in Moesif
Use these reports to improve onboarding and conversions within your product
As one of the most critical factors in making customers successful, seeing the entire picture when it comes to customer onboarding and conversion is crucial. Diagnosing issues within these two domains can help you attract and retain more customers and directly bump up your revenue to the next level. With Moesif and Segment, building comprehensive reports on onboarding and conversion metrics is easy, and, most importantly, holistic.
 Made by Moesif


