Measure product KPIs to determine product growth

This guide will teach you how to determine, track, implement, and measure the KPIs in Mixpanel, which will serve as leading indicators for revenue growth or churn. You’ll be able to save these reports to a Mixpanel dashboard and set up alerts, so your team can be notified when any metrics cross specific thresholds in real-time.

Outliant Made by Outliant
Mixpanel Made by Mixpanel

On this page

If you'd like help designing and implementing a data strategy to fit the needs of your business, get in touch with Outliant today!

While every product is unique, we’ve identified four KPIs shared by all products that serve as predictive indicators of product and revenue growth or decline. If all four of these KPIs are moving positively, your product's impact on the world is growing, which is a leading metric (as opposed to a lagging metric), predicting increased revenue.

Below are the four leading indicators: 

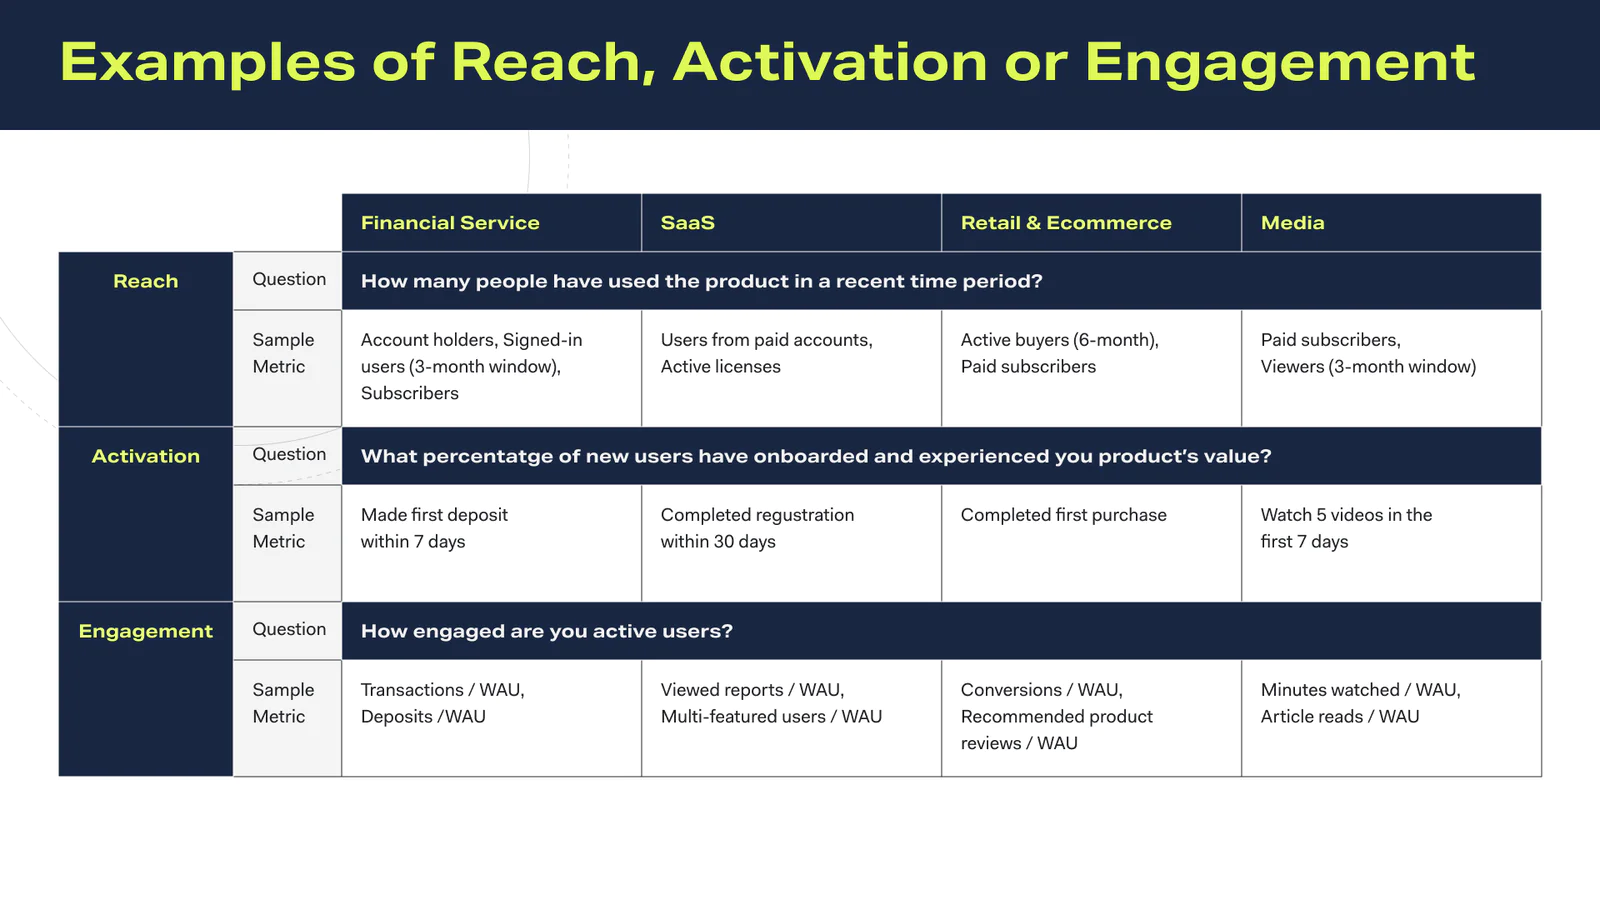
  • Reach: How many customers have signed up to use your product in a recent period? 

  • Activation: What percentage of new users have onboarded and experienced your product’s value?

  • Engagement: How deeply engaged with your product are your active users?

  • Retention: For how long does your product continue to add value to your customers' lives?


mixpanel3-image1


Closely monitoring – or ignoring – these four indicators can greatly impact your business. For example, suppose you choose not to heed these indicators. In that case, you could miss out on a critical opportunity to correct churn before the company develops a revenue problem on a massive scale.

Step 1: Determine what to track to measure these indicators

To get started, you’ll need to determine which events and properties to measure the core KPIs. In many cases, you only need a few events to measure multiple things. For instance, if we were running a video-player product company like Youtube, we’d only need to track “Signup” and “Watch Video” to measure all four KPIs.

In most cases, when it comes to tracking, less is more. Implementing a small number of highly impactful events is best practice because it creates less clutter in your data tools; it’s easier to develop/maintain, and it will prevent end-user confusion about what different events convey. 

Step 2: Implement appropriate track calls and set up Mixpanel as a destination. 

Once the correct snippets are implemented to measure reachactivationengagement, and retention, it’s time to enable Mixpanel as a destination for the data source of your choice.


mixpanel3-image2


Step 3: Analyze data in Mixpanel and build reports

Once you have everything configured, Segment will automatically start sending data to Mixpanel so that you can create the reports right within the Mixpanel UI.

Reach:

To measure reach, you’ll use Mixpanel’s insights tool. This report will show you how many signups you’re getting every week. If the number of signups is growing, that’s a leading indicator that revenue will grow. 

The image below displays signups for a video-player product broken down by the country where the user signed up. This graph shows 884 US-based signups the week of March 2nd - March 8th, 2020. 


mixpanel3-image3


Activation: 

To measure activation, you’ll use Mixpanel’s funnels tool. With this report, you’ll see how many customers sign up and experience a key moment of your product's value. If the conversion rate increases, that’s a leading indicator that revenue will grow. 

The report below shows that 45.34% of people who sign up go on to watch a video within seven days. This is a ~3% decrease compared to the 48.91% conversion rate from the same time frame in the previous month.


mixpanel3-image4


Engagement:

To measure engagement, you’ll use Mixpanel’s insights tool. The first step is to aggregate the total number of your product's value moment events. Then, you’ll aggregate the unique number of people who have performed your product value moment. Once you have these two data points, you’ll use Mixpanel’s formula feature to divide the total number of key-value moments by the unique number of people who experienced that key-value moment. 

This will result in a data point showing how often a value moment experiencer experiences that key value moment. In the reports below, the purple line indicates that users who watched a video in a given week, on average, watched between five and seven-and-a-half videos per week.

Mixpanel also allows you to create target lines. In our case, we created the target baseline of 5, represented by the orange line.


mixpanel3-image5


Retention:

To measure retention, you’ll use Mixpanel’s retention tool. To build this report, you’ll measure how many people experienced your product's value moment and then returned to experience it again. 

The chart below demonstrates that 27.85% of people who watched a video came back to watch another video five days later.


mixpanel3-image6


Step 4: Set up dashboard and alerts (advanced) 

Once you’ve built all the KPI reports in Mixpanel, you can add them to a dashboard, where you can share them with your team.


mixpanel3-image7


Set up alerts:

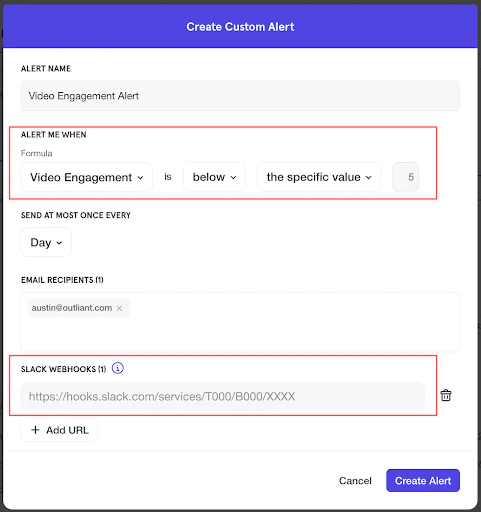
At this point, you can also add alerts to notify your team when a metric crosses a certain threshold. In the case below, we’re setting up an alert to track when our weekly video engagement drops below five videos per week. This can be extremely useful for ensuring that no metric slips through the cracks and that your team can take action before revenue is impacted.


mixpanel3-image8


Wrapping up

Here’s what we’ve done in this growth recipe:

  • Determined core KPIs that predict revenue growth (or churn) 

  • Implemented proper tracking and enabled the Mixpanel destination 

  • Built reports that show reachactivationengagement, and retention in Mixpanel

  • Added all reports to the dashboard

  • Set up alerts to notify your team in case KPIs go above or below a specified threshold   


Getting started is easy

Start connecting your data with Segment.