Multivariate Testing: When to Use It & How to Run One
A guide to multivariate testing, and when it's the right choice for your business.
A guide to multivariate testing, and when it's the right choice for your business.
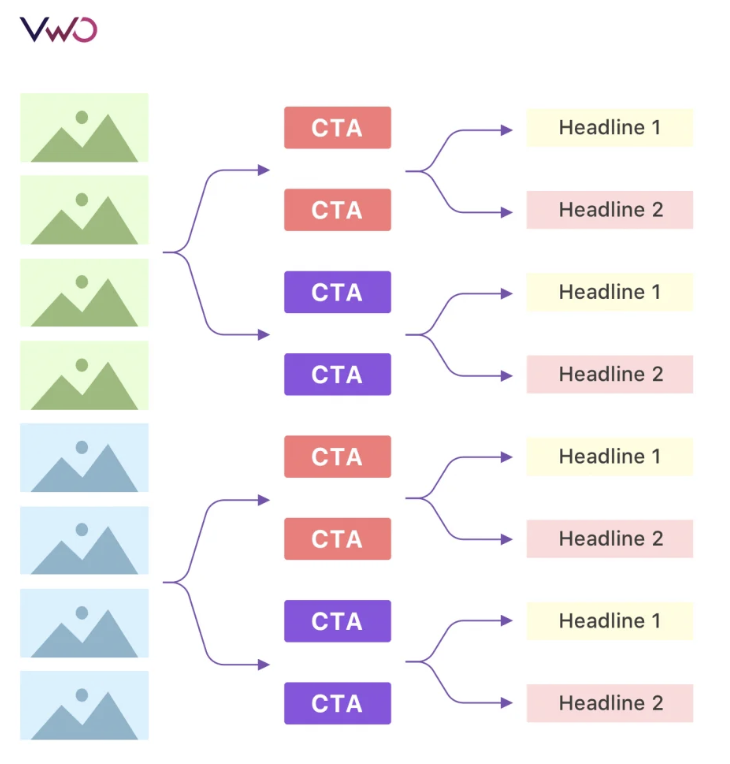
A multivariate test is a type of experiment in which multiple elements on a web page are changed to see how different combinations impact user behavior. In a multivariate test, you may have several versions of a web page that pair different images, headline copy, calls to action (that is, whatever you decide to test).

An illustration of all the different combinations of testing two different images, two different headlines, and two different CTA buttons.
In a multivariate test, the number of different web pages you’ll have running is dependent on how many elements you decide to change. Here’s the guidance to follow: multiply the number of variations of each element together to know how many web pages to create. So, if you decide to run an MVT (multivariate test) with three different versions of a CTA and three different headlines, you would need to have nine different web pages. (3 CTAs x 3 headlines = 9 different variations.)
Here’s the formula:
[# of variations for first element] x [# of variations for second element] X [# of variations for third element]... = total number of versions to test.
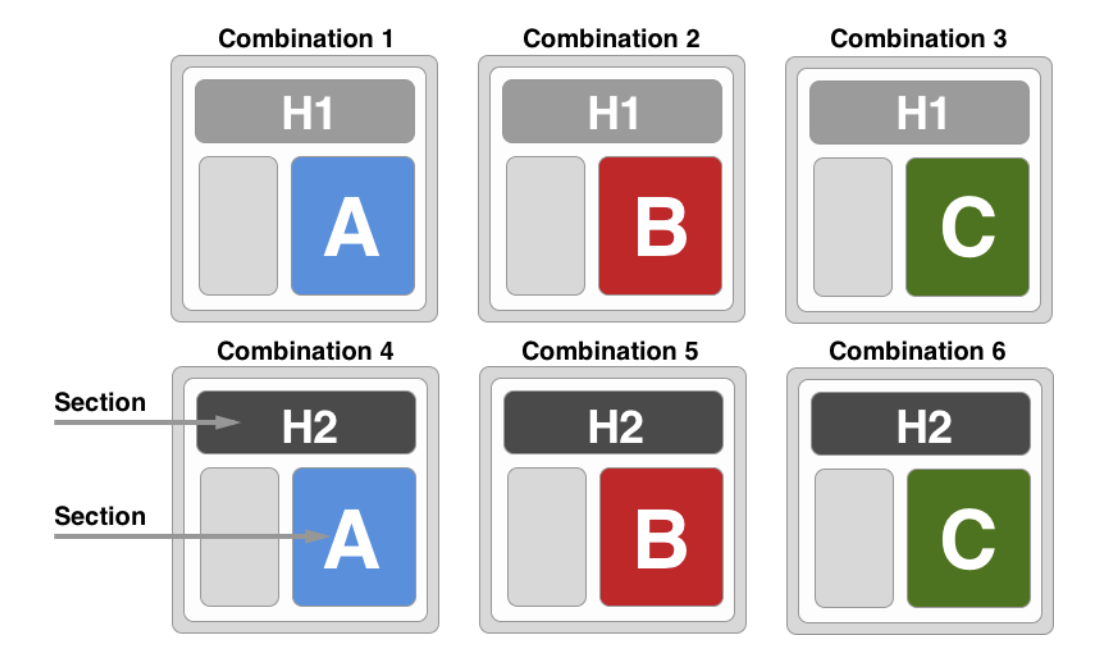
A full factorial test follows the formula we outline above, in which every possible combination of variables is tested. So, if you wanted to experiment with 2 different headlines and 2 different images, you would run 4 different pages to test all possible variations.
A partial factorial test (also known as a fractional factorial test) does not test every possible variation. This means statistical significance could be reached at a faster rate, as you would need a smaller sample size. Yet, you won’t have the same level of accuracy and understanding you would if you ran every variation.
However, sometimes it makes sense to exclude certain combinations from an experiment. For instance, if you’re testing a web page with a green background, it wouldn’t be logical to have green text as well (people wouldn’t be able to read it!).
The main difference between a multivariate and A/B test is that in A/B testing there is only one variation being compared to the control. With a multivariate test, multiple elements on a web page are changed, leading to multiple variations.
In both an A/B and multivariate test, traffic is split evenly between all versions. So for an A/B test, traffic is split 50/50 between version A and B. In a multivariate test, traffic is split evenly between however many variations are running, which means it will likely take longer to reach statistical significance. (As a reminder, statistical significance is a measure of how likely the results of an experiment are valid, or not due to chance. )
There are a few ways to determine when you should be using a multivariate test, but the most fundamental is: you want to test multiple elements on a web page at the same time.
Some people recommend starting out with an A/B test to understand the impact of larger changes, and then using MVT to continue optimizing specific elements.
Multivariate comes with its own set of pros and cons. Here are the most common ones to keep in mind.
As opposed to A/B testing, which only compares a control with one variation, multivariate testing looks at a combination of elements and their relationship to one another (sometimes referred to as the “interaction effect”).
This means multivariate tests provide an opportunity for deeper insight, as you would have to run successive A/B tests to understand the compounding effect a combination of changes might have.
On the flip side, because you’re dividing traffic between multiple different variations, multivariate tests are more complex and require a larger sample size. For low traffic pages, it may not be worth running a multivariate test as you would be spending a good portion of your time waiting for results.
The steps below provide a general outline of how to set up your own multivariate test.
Before conducting any type of experiment it’s important to understand your baseline. How are your web pages currently performing? And how does this performance measure up to your overarching business goals? This will help you prioritize what to test.
Along with analyzing user behavior via conversion rates, click-through rates, bounce rates (and so on), we recommend incorporating qualitative data into your research as well. Send surveys to customers asking them to rate their experience (this could be through an NPS pop-up on your website or in-app, or a simple questionnaire). Hearing directly from users is a great way to take out the guesswork as to what’s working and what isn’t.
Based on this quantitative and qualitative customer feedback, you can start to formulate a hypothesis for your experiment.
For example, let’s say you’re trying to improve the conversion rate of one of your landing pages. You hypothesize that the call to action isn’t visible enough on the page, so you decide to build an experiment around this: testing out several different variations of the CTA’s sizing, placement, color, and copy.
Now armed with your hypothesis, it’s time to create the different variations you want to test. Many testing platforms allow you to do this with a WYSIWYG visual editor, for easy setup.

As we mentioned above, when running a multivariate test, you have to split traffic evenly between each variation. This will require a higher sample size for the test to reach statistical significance. For a quick refresher:
Statistical significance rules out that the results of an experiment are random, or a result of chance. The general rule of thumb is that if the p-value (or probability value) is 5% or less, the test is statistically significant.
Sample size refers to the amount of people participating in the experiment. There are several calculators to help you identify how many people need to partake in the experiment to ensure that the results are sound (or statistically significant). Here’s one to try out.
Confidence level is the inverse of the p-value. The confidence level is an indication of how likely the results of your experiment are due to the changes made (i.e., not chance). So, following this, a confidence level of 95% or higher indicates a statistically significant test.
Connect with a Segment expert who can share more about what Segment can do for you.
We'll get back to you shortly. For now, you can create your workspace by clicking below.
For a multivariate test, it’s important to have the right data infrastructure in place to understand current business performance and baselines. With a customer data platform, you can easily send data between tools and seamlessly integrate with an experimentation platform (which can help set up tests, show results and reporting via built-in dashboards, and more).
An A/B test is the better choice when you’re only looking to test one element on a web page. Other points to consider include how much time and resources you’re willing to allocate to a single test: multivariate tests take longer to reach statistical significance and can be more complex to set up and interpret results.
Twilio Segment is a customer data platform that allows you to collect, unify, and manage customer data from multiple sources. This allows teams to understand how users are currently interacting with their business, and spot points for improvement. Twilio Segment also integrates with several experimentation platforms to help users set up the tests based on this first-party data.