Recipes
StartupMobileMarketplaceMediaB2BRetailAny Industry

Remove the funnel bottlenecks that are killing your conversion rate

In this recipe, you'll learn how to fix your funnel bottlenecks so you can improve your conversion rates.

Demand Curve

Made by Demand Curve

What do you need?

  • Javascript or Mobile source which tracks your funnel

  • An analytics tool to track user behavior like Google Analytics

  • Behavior-based segmentation capabilities

  • An email tool — we’re using Customer.io in this example

Remove your funnel bottlenecks with Segment

With a huge integration catalog and plenty of no-code features, Segment provides easy-to-maintain capability to your teams with minimal engineering effort. Great data doesn't have to be hard work!

Get started for free

This recipe walks you through fixing funnel bottlenecks so you can improve your conversion rates. The “funnel” that we describe here is the journey your customers take through your product or service.

Along the funnel, there are many growth optimizations a marketer can pursue. What’s needed is a process for identifying the highest impact optimizations. That’s what this recipe covers.

Central to this process is Segment. It’s the bridge connecting every growth tool we cover in this recipe. We’ll also use Segment’s Personas product to segment users based on where in the funnel they dropped off. This lets us follow up with them using personalized messaging that resonates better, which we’ll use to improve conversion.

Step 1: Assemble your toolset

To assess funnel performance, step one is having your analytics stack installed. Most companies use Google Analytics as a free foundation. Then they pair it with a user-level tracking platform such as Mixpanel, Heap, or Amplitude.

Further, if you’re a mobile app, you’ll also want a tool like AppsFlyer that attributes mobile installs to where those installs came from, for example, a Facebook or Google ad.

Don’t worry if this sounds like a lot of installation work. It’s not. Segment simplifies everything so that you only need to track funnel events one time. After that, Segment pipes the data you collect to all of your third-party tools. This saves countless hours of development work and keeps your growth stack agile.

Once you’ve set up your analytics software, you’ll need to track the events that make up your funnel or the actions that you want a user to take. We’ll do this using Segment. Once that’s done, we can start assessing the funnel.

Step 2: Track your funnel events

When considering what funnel events to track, go granular. That means tracking not only whether a visitor saw your payment page, but also tracking how many form fields they filled out, what they clicked on, and how far into the payment page they scrolled.

This will ensure that your analytics can tell you what a user is actually doing on the page, not just the pages they see. It also will help you identify whether there was a huge drop-off between smaller, interstitial steps.

Capture more than just the event

You’ll track funnel events in your codebase using a Segment track call. This function includes the name of the event plus optional metadata. Here’s an example:

The additional data (e.g. Plan and Industry) add important context to the user’s journey. They help you segment your audience into niches later on, which we’ll take advantage of to personalize outreach when trying to get folks to return after they’ve dropped off.

Further, collecting behavioral and other metadata helps you identify which segments of your users are having a much harder time moving through your funnel. Then you can do something about it.

For example, if you notice a huge amount of people abandoning their shopping carts due to a technical glitch on your site, that extra data might clue you into the fact that the bug only occurs when visitors try checking out on the “Pro Annual” plan but not your other plans.

Step 3: Analyze your funnel data

With your analytics tools and Segment tracking code set up, it’s time to dive into funnel optimization.

Our goal here is to illuminate the most important problems to work on — improvements that generate the most profit using the least effort.

Here’s the step-by-step process we’ll explore:

  1. Walk through your funnel

  2. Log the current conversion data at each step

  3. Identify drop off points

  4. Deduce why people dropped off

  5. Prioritize fixes

When we’re done, you’ll have a sheet that looks like this:

funnel_bottlenecks_1.png

3a. Walk through your funnel

First, open a spreadsheet. Go to your website and pretend to be a customer, listing out every major click you make and page you visit. At a minimum, you have to include what mechanically has to happen to make a purchase.

For example, you can’t purchase without adding credit card information. You can get to the credit card screen before entering shipping info. You have to add to cart before you check out. And so on.

For each step, add it to the spreadsheet. Your list should end up looking like this.

funnel_bottlenecks_2.png

3b. Fill in the data

Next, you need to see how many people actually got to each step. Open up your analytics platform like Google Analytics to find these numbers.

Create a table that shows how many unique people got to each step. It would look like this:

funnel_bottlenecks_3.png

If data is missing for a particular step, have your engineers add tracking for that event.

3c. Identify drop-off points

Look at the spreadsheet you made. Focus on the % rows and find the ones with the smallest percentages (meaning the biggest drop-offs). Find significant drop-offs between time periods as well — we’ll explain what these are below.

Color all these drop-offs red.

Here's an example:

funnel_bottlenecks_4.png

In the example above, Row 3 has a large drop-off between periods. Rows 9, 13, and 15 have a large drop-off relative to the rest of the funnel. These are the first places you should look to fix.

Why look for the biggest drop-offs? That's where you can make the biggest impact.

Here's an example.

Let's say that 1,000 people visit your signup page, but only 100 actually click "Sign Up". You could maybe get 20 more people to sign up with some smart tweaks. That's a 20% improvement (120 people). Plus you still have 880 people left to catch.

Now say that 1,000 people visit your signup page and 990 of them sign up. There's no way to get 20 more people to sign up! You'd be at 1010 people. So even if you made some changes, you'd barely be able to get more people to sign up.

Conclusion? Look for where there's more drop-off. You'll make a bigger dent.

3d. Systematically deduce why people dropped off

Marketing teams tend to explain drop-off the way they know: they think they need to market a product better to explain why people aren't converting. But, usually, they need to debug.

Here are the steps you should take to try to figure out why visitors drop out. In order of priority.

  1. Make sure the data is accurate

  2. Walk through the site

  3. Check for mobile issues

  4. Look for anomalies in the data

  5. Use heatmaps to study your users’ behavior

  6. Segment by referrer (e.g. Are users coming from Facebook dropping off more?)

  7. Run user surveys to ask why they dropped off

3e. Prioritize fixes

How do you pick the most important task? There are only three things you need to consider.

  1. Cost: How much will it cost to make this change?

    • To get the cost, take the hourly salary of the employees that will work on the fix, and multiply it by the time estimate

  2. Revenue: How much revenue will this change make us?

  3. Timing: How soon can we make this change?

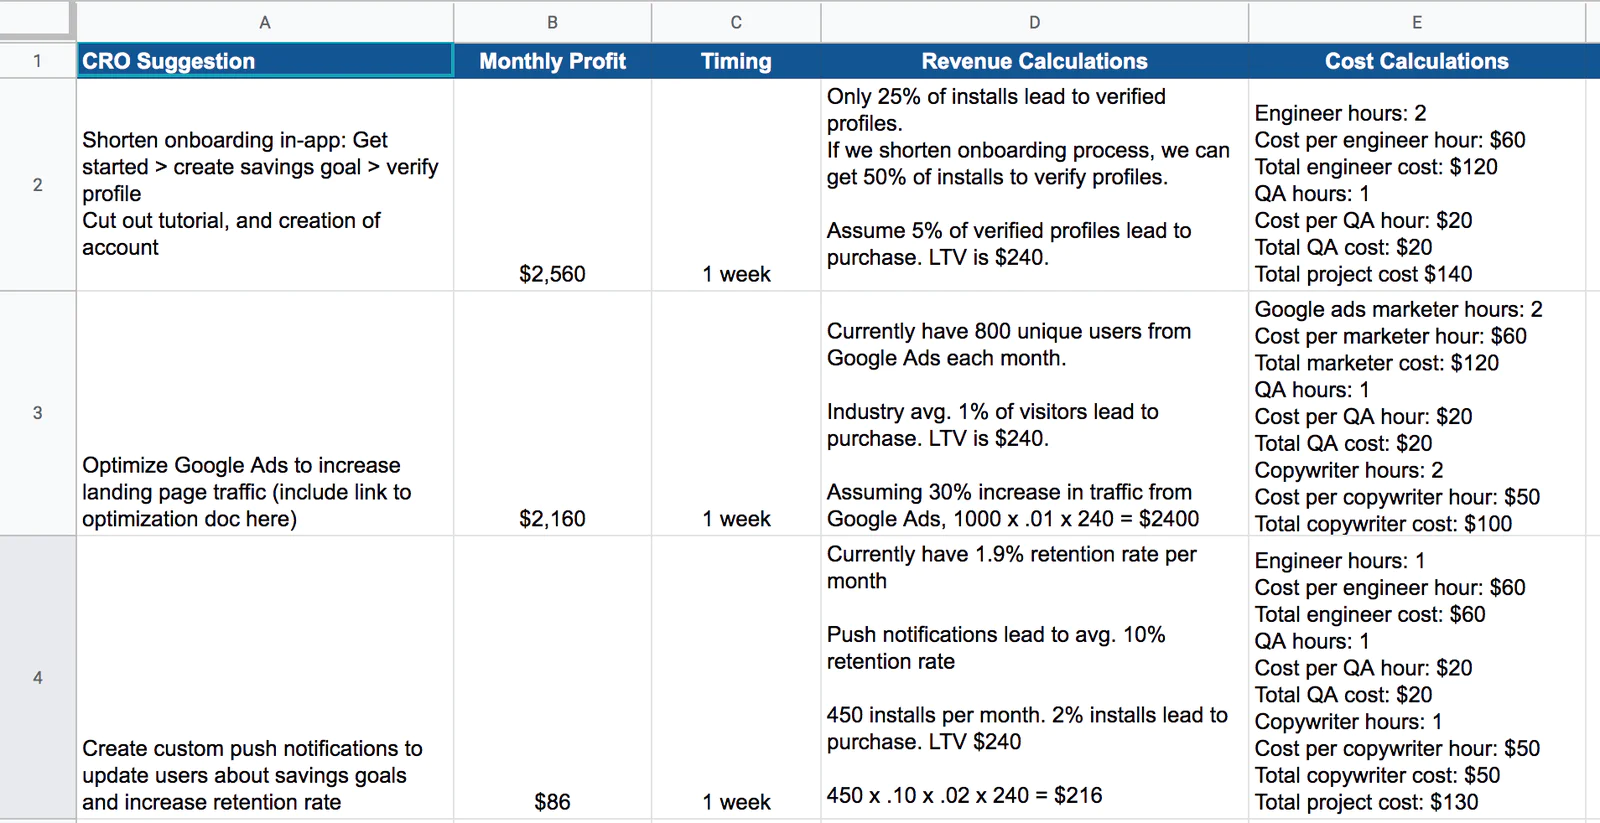
Break all this down into a spreadsheet that outlines the tasks to do, the cost, and the estimated revenue gained. If you’re not sure about exact revenue or timing, you can also set up thee chart so that it estimates impact (how big the opportunity is) and difficulty (how hard it is to make a fix). Here’s an example:

funnel_bottlenecks_5.png

Once you’ve identified the most important tasks, you can use Segment Personas to make personalized fixes for the various audiences you’re trying to reach.

Step 4. Use Twilio Engage to resolve drop-off points

Fixing funnel bottlenecks is step one in the overall process. Step two is leveraging Segment Personas to better move users along the funnel — and to resuscitate those who’ve dropped out.

Personas lets you quickly create audience segments through a drag-and-drop interface. You can segment using the data you captured in your track calls.

For example, let’s say after analyzing your funnel, you realized that most users only use your app if they’ve viewed your tutorials page first. And let’s say you resolved this by tweaking your onboarding process to encourage people to now read tutorials first.

But, how do you go about reaching out to the previous users who gave up on your app because they never read a tutorial?

Easy. Use Personas to create an audience that fits that exact criteria. Then follow up with them using an automated email.

Here are a few more examples of using Engage to augment your funnel:

  • Proactive messaging: Email product promos for the specific cart products that were abandoned pre-purchase.

  • Predictive support with unified data: Synthesize user behavior data with the information you have in your CRM on that customer to proactively help customers before they ask for it.

  • Intent-based outreach: Identify the prospects most likely to purchase and automatically reach out with an irresistible offer while you’re top of mind.

  • Reactivate former users: Automatically email users who haven’t used your app in the last 30 days with a bonus to jump back in.

  • Personalized recommendations: Leverage previous purchase data to determine what a prospect is most likely to purchase next and customize site experience and emails accordingly.

Setting up an audience in Engage

Follow these steps to get started with Engage:

  1. Log into Segment

  2. Click on Engage > Audiences > New Audience

  3. Create the filter like so:

funnel_bottlenecks_6.png
  1. Click Preview, and follow along the steps to Select Destinations.

  2. Connect it with an email marketing platform like Customer.io. The audience will automatically be available there where you could follow up with your customers.

  3. Name your audience Inactive users - Tutorials follow up and click Create Audience. Make sure to leave the “Gather historical data” checkbox toggled on.

Wrapping up

Here’s what we’ve done in this growth recipe:

  • Collected data from your website or mobile app that’s aligned to your user journey

  • Analyzed that funnel data to see where customers are dropping off

  • Prioritized fixes that address those drop-off points

  • Built email campaigns that can help re-engage stalled users

Getting started is easy

Start connecting your data with Segment.