Getting roadmap feedback from customers by understanding retention cohorts

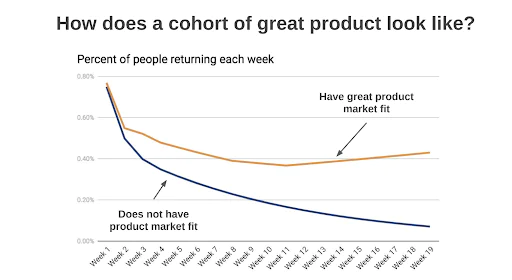
The surest sign of a great product is when users keep coming back for more. Keeping track of user retention - the percentage of users that return to your product - is a strong indicator of product-market fit. Companies large and small measure user retention to guide their decision-making. Though user retention tends to trend downward, it’s best to strike a balance between keeping your existing users happy and acquiring new ones. Otherwise, you’ll be working with a leaky bucket. In this recipe, we explain how to use product analytics to measure and improve product-market fit. By inputting the correct data, adding retention cohorts, and collecting user feedback, you can create the optimal product roadmap to boost retention.

Mixpanel Made by Mixpanel
mixpanel2-image1


Step 1: Assemble your toolset

To assess product-market fit, step one is having your analytics stack installed. Most companies use Google Analytics as a free foundation. Then they pair it with a user-level tracking platform such as Mixpanel, Heap, or Amplitude.

Don’t worry if this sounds like a lot of installation work. It’s not. Segment simplifies everything so that you only need to track funnel events one time. After that, Segment pipes the data you collect to all of your third-party tools. This saves countless hours of development work and keeps your growth stack agile.

Once you’ve set up your analytics software (documented below), you’ll need to track the events that help determine retention and engagement. We’ll do this using Segment. Once that’s done, we can start assessing the funnel.

Segment’s Sources and Destinations Segment connects your site or app to third-party growth tools (such as an analytics platform) using two types of resources: Sources and Destinations.‌

Sources

A Source represents a codebase, such as your site, app, or server. A Source is where events such as button clicks and page visits are recorded then sent to Segment. You need one Source for every codebase you have. Your engineering team will need to set up Segment Sources. It’s at this step that you’ll determine what events to track. You’ll use these to evaluate product-market fit. (Here’s the documentation on how to do this.)

Once a Source is set up, you can use Segment without touching your codebase again. All the functionality happens within Segment’s UI.

Destinations

Every Source has one or more Destinations that they’re connected to—places where Segment sends data to. These are the third-party tools you’re sending your site, app, and server data to such as Google Analytics, Mixpanel, and Amplitude.

See Segment's documentation if you need help setting up a Source or Destination.

Step 2: Create a retention cohort in your analytics tool

Now that you have your toolset in place, it’s time to start analyzing your data. Go into your analytics tool and create a retention cohort by first choosing a key retaining event—“video watched,” “page viewed,” “message sent,” etc. You should select a key retaining event or an action taken by a user in your product or app that aligns closely with your core value prop.
 

mixpanel2-image4


We recommend breaking this out by platform or acquisition channel to compare apples to apples rather than just comparing across arbitrary days. Depending on where your traffic comes from, you may also need a mobile attribution tool like AppsFlyer.

You’ll need to watch these cohorts over time. You’ll also want to compare cohorts at corresponding points of the cohorts’ timelines and see what sets higher retention groups apart from others. Remember, greater retention equals stronger product-market fit.

There’s no single benchmark for this process — it’s important to research what companies in your industry have as their benchmark and track against that. Keep reading for more on benchmarks.

Step 3: Get user feedback on why your product isn’t being retained

If you are not yet finding product-market fit or think there’s room for improvement, you need to determine the root cause with existing users. They’ll give you the clearest insight into why they either did or did not choose to continue using your product. To do this, create a survey using a tool like Survey Monkey or Typeform with the following four questions:


mixpanel2-image5


  1. How would you feel if you could no longer use [name of your product/service]?

    1. Very disappointed

    2. Somewhat disappointed

    3. Not disappointed

  2. what type of people do you think would most benefit from [name of your product/service]?

  3. What is the main benefit you receive from [name of your product/service]?

  4. How can we improve for you?

Note: If your “Very disappointed” group makes up ~40% or more of your respondents, you are close to or potentially have product-market fit. 40% is a generally agreed upon benchmark.

Step 4: Analyze your data and plot your roadmap

After collecting customer feedback, you would then go through a four-step process for optimizing product-market fit using the survey data:

  1. Understand respondent personas and commonalities. What are the common traits among those who selected “very disappointed” or “not disappointed.”

  2. Review feedback from users who selected “somewhat disappointed” to get an idea of what you need to build in order to move that cohort of users into the “very disappointed” group.

  3. Find features with the lowest cost and highest impact that “somewhat disappointed” users are asking for and focus on building them.

  4. Repeat 1–3 on a regular cadence to continue to move towards product-market fit.

The data you receive from the survey is essential to informing your ideal customer profile and product roadmap.

This recipe is based on recommendations given by Rahul Vohra, CEO of Superhuman.

Wrapping up

Here’s what we’ve accomplished in this growth recipe:

  1. Enabled the product analytics sources for tracking retention

  2. Created a retention cohort in an analytics tool

  3. Distributed a survey to help measure your product-market fit

  4. Analyzed the survey results to design a product roadmap

From here, you can use product analytics tools to learn more about your customers and make data-informed decisions.

Getting started is easy

Start connecting your data with Segment.