Segment customers who collect first-party customer data often want to be able to analyze it and to build visualizations. In this recipe, we share an easy and interactive way for Segment users to share their work with their colleagues without sending screenshots back and forth. We do so by leveraging Hex, a little bit of Python code, and Segment’s AWS S3 destination for easy data visualization and collaboration.
With Segment, you can collect, transform, send, and archive your first-party customer data. Segment simplifies the process of collecting data and connecting new tools, allowing you to spend more time using your data, and less time trying to collect it. A very popular destination for your first-party customer data is AWS S3. AWS S3 is is an object storage service offering industry-leading scalability, data availability, security, and performance.
With your data stored in AWS S3, you can now use it within Hex. Hex is a modern data workspace which makes it easy to:
Follow the documentation here to add an AWS S3 Destination to your Segment workspace and connect it to an existing source. Make note of your bucket’s name. Once set up, verify that events are flowing into your S3 bucket (you may have to wait ~1 hour for files to appear). Also take note of the path used by Segment in your S3 bucket.
- In order for Hex to read data from the S3 bucket previously set up as a Destination in your Segment workspace, you’ll need to generate a new set of AWS API credentials. Once you open the AWS Console, click on the following in this order:
Your username near the top right and select My Security Credentials
Users in the sidebar
Your username
Security Credentials tab
Create Access Key
Show User Security Credentials
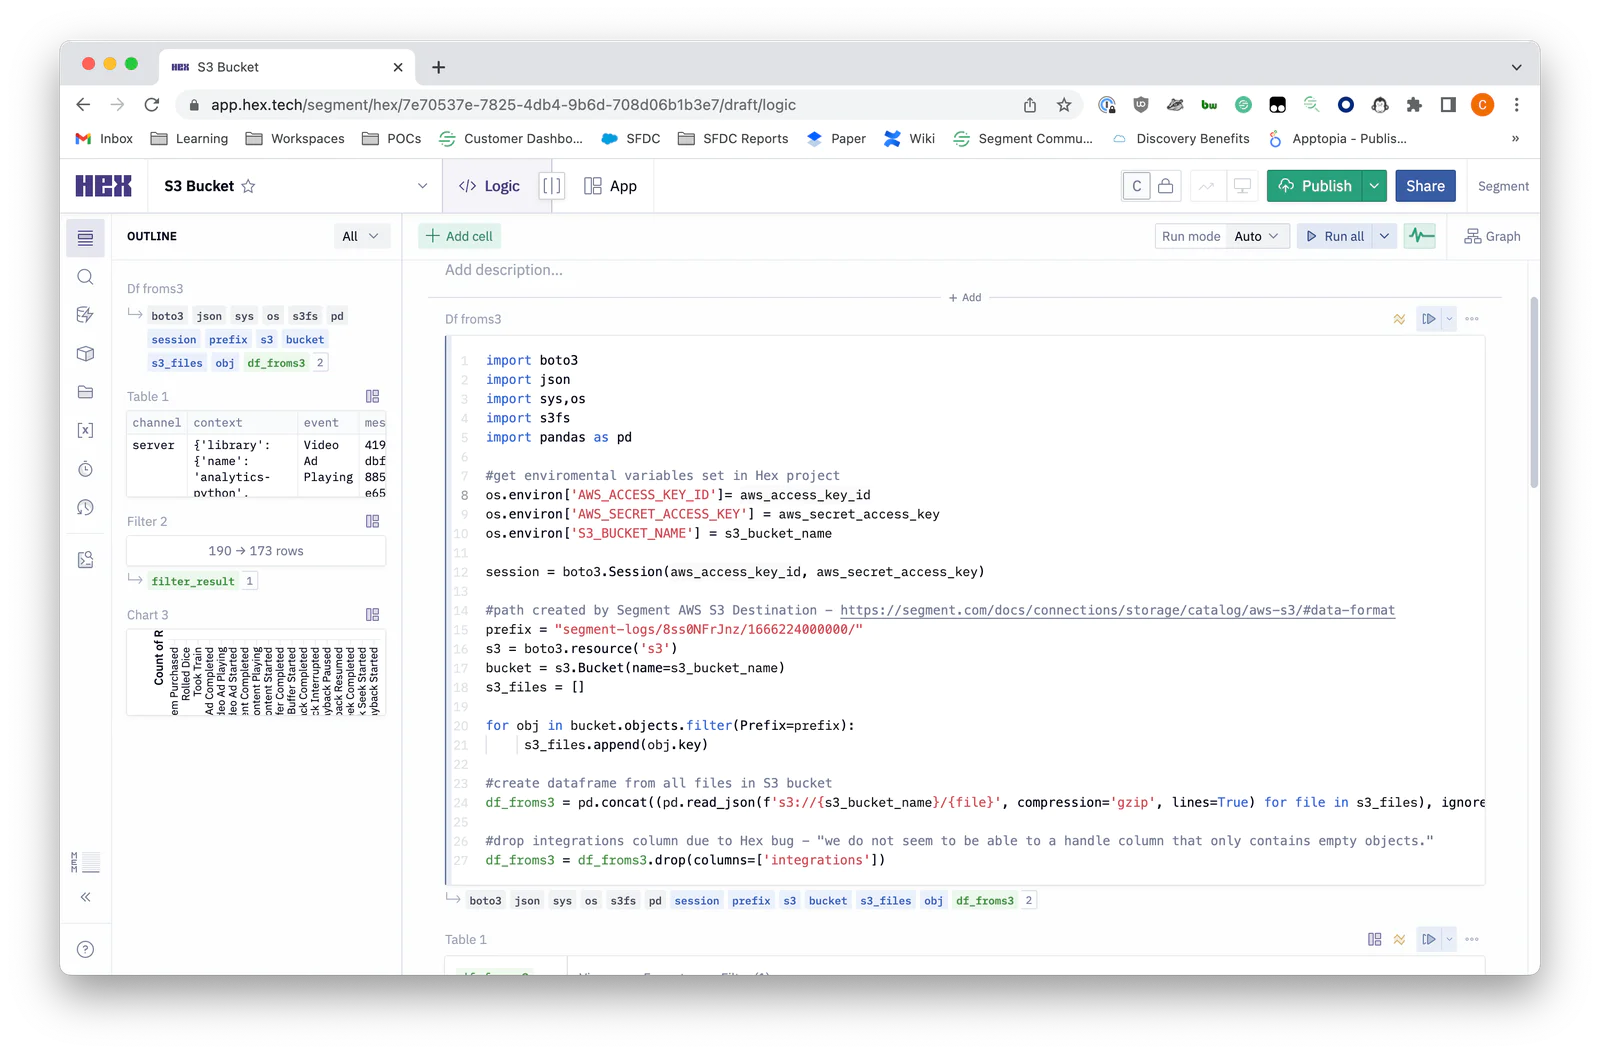
As a first step, create Secrets for the two AWS credentials: AWS_ACCESS_KEY_ID and AWS_SECRET_ACCESS_KEY. Additionally, create a Secret for the name of your S3 bucket
To create the Secrets, navigate to the Variables tab and hit the + Add button. In this example, the Secrets are named
aws_access_key_id, aws_secret_access_key, and s3_bucket_name
Add a Python cell and copy in this code...
 Made by Charlie Gerrior


