COURSE 6 • Lesson 2
Product Usability: How to Measure and Improve it
In this lesson, you'll learn how to understand your product usability metrics to better enhance adoption and engagement in your product.
COURSE 6 • Lesson 2
In this lesson, you'll learn how to understand your product usability metrics to better enhance adoption and engagement in your product.
So you've built a product that is quickly gaining traction, but you get the sense that there is something missing. Your adoption rates aren't what they should be given the amount of users who have signed on to use your product. With the few conversations you do have with customers, you start to hear a few common patterns — "I couldn't find that feature", "this step was confusing". You realize you're facing an exceedingly common problem for early products — usability.
Understanding your product usability metrics allows you to get ahead of these costly conversations, reduce customer frustration, and decrease churn risk. You can even detect usability problems before they become pervasive, establish metrics that ensure you are carefully tracking users' success with key end-to-end task completion rates, and get an exact sense of what to tackle next.
After all, what good is a product if it is unusable?
Product usability refers to how easily and intuitively the user of a product can understand how to use — and achieve their desired goal — with the product. Usability is one of the chief goals of both UI and UX design teams, and designers use various methods and metrics to measure usability throughout the product development process.
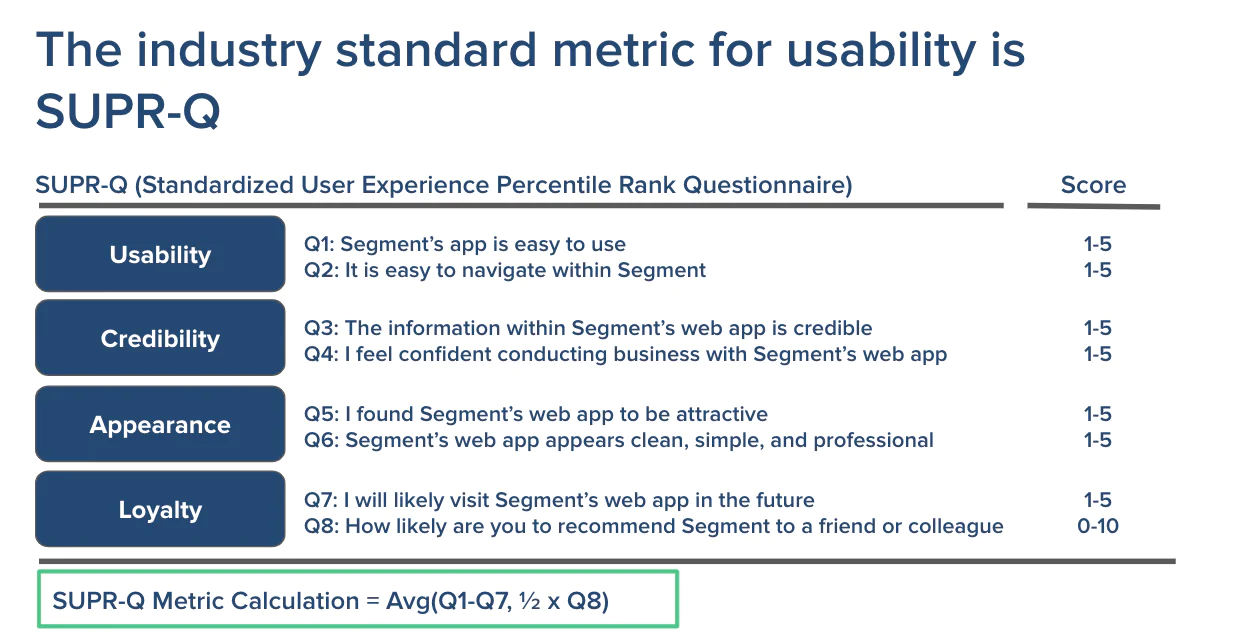
A good place to start to understand the overall trends of whether or not users are happy with your product is with user research tools like NPS and SUPR-Q (Standardized User Experience Percentile Rank Questionnaire).
While NPS allows you to see whether or not someone would recommend your product to someone else, SUPR-Q allows you to dig deeper by getting a holistic view on specific usability components within the app, measuring your product's:
Sending out a SUPR-Q survey will allow you to assess wide areas of focus that you may need to work on for your product. At Segment, we break down the questions so that NPS is folded into a component of SUPR-Q, by virtue of the last question:

While SUPR-Q is great for getting a sense for the big picture, it does little to highlight specific problems within your product. To get more granular, you're going to need to get direct user feedback on product design and usability issues from customers themselves.
Diving deeper into the problem space
You will always have some customers who are so excited about your product, and passionate about using it, that they will reach out to you when they are struggling with it. They’ll want you to help them walk them through your product’s functionality. These are likely champions of your product who rely on it so much that they want to work with you to see it get better.
The customers to worry about, though, are the ones whose frustrations quietly build up over time, who don’t have the time or desire to work with you personally to solve the inevitable problems your product will accumulate. These users are the ones who bought into your vision, but are having trouble executing parts of it.
One of the most powerful ways you can begin to analyze customer usage of your product to get ahead of these problems is customer interviews. Using tools like Appcues, you can reach out to customers as they use your app or website and invite them to participate in a customer interview. If possible, visit them in person to see how they use your app or website. This will help you understand your product’s ease of use in the real world with real users.
Of course, qualitative insight can give you a zoomed in view of your customer problems and allow you to tackle pieces of an experience, but too much focus on this kind of insight may cause you to lose sight of the bigger picture and assess whether or not the changes you are making are actually working. Ideally, your product usability stack ensures you are looking at both qualitative and quantitative data. How do you begin the journey in defining and analyzing product usability data quantitatively?
First, define the aha moment for your product. The aha moment is the moment in which your new user(s) first begin to understand the value of your product. This looks vastly different for different products. For Facebook, this is when a new Facebook user connects with 7 friends in 10 days. For Twitter, this was when a Twitter user followed 30 people. For Slack, this is when a team sends over 2000 messages between each other.
Defining and understanding your aha moment allows you to anchor your team in a vision and shared goal in what the number one task you need users to accomplish to understand what it is your product can do for them. This is the first set of tasks you can begin to measure quantitatively to begin to assess whether or not your users are finding value in your product, and how quickly they get there.
Next, define the habit moment for your product. The habit moment is when users move past initial implementation of your product and begin to truly rely on it. To begin figuring out what this moment looks like, evaluate what you'd define to be a retained user and then work backwards from there. For instance, for an e-commerce site like Amazon, a retained user would be someone who has completed a transaction, not just someone who is considered a Daily Active User for just having visited their website. For Facebook, however, being a Daily Active User is their retention metric, as they work to drive interaction and engagement through different means on their product.
Your definition of a retained user will look different based on your product type and what it is you are ultimately driving users to do. These can be broken down to sub-tasks that you can begin to track more granularly to get a better sense for how individual task-completion rates are accounting for users reaching this larger goal.

As you continue to collect both quantitative and qualitative feedback on how people are using your product and what areas need more attention, you will start to get a bigger picture of not just your customer usage, but more importantly, your customer journey.
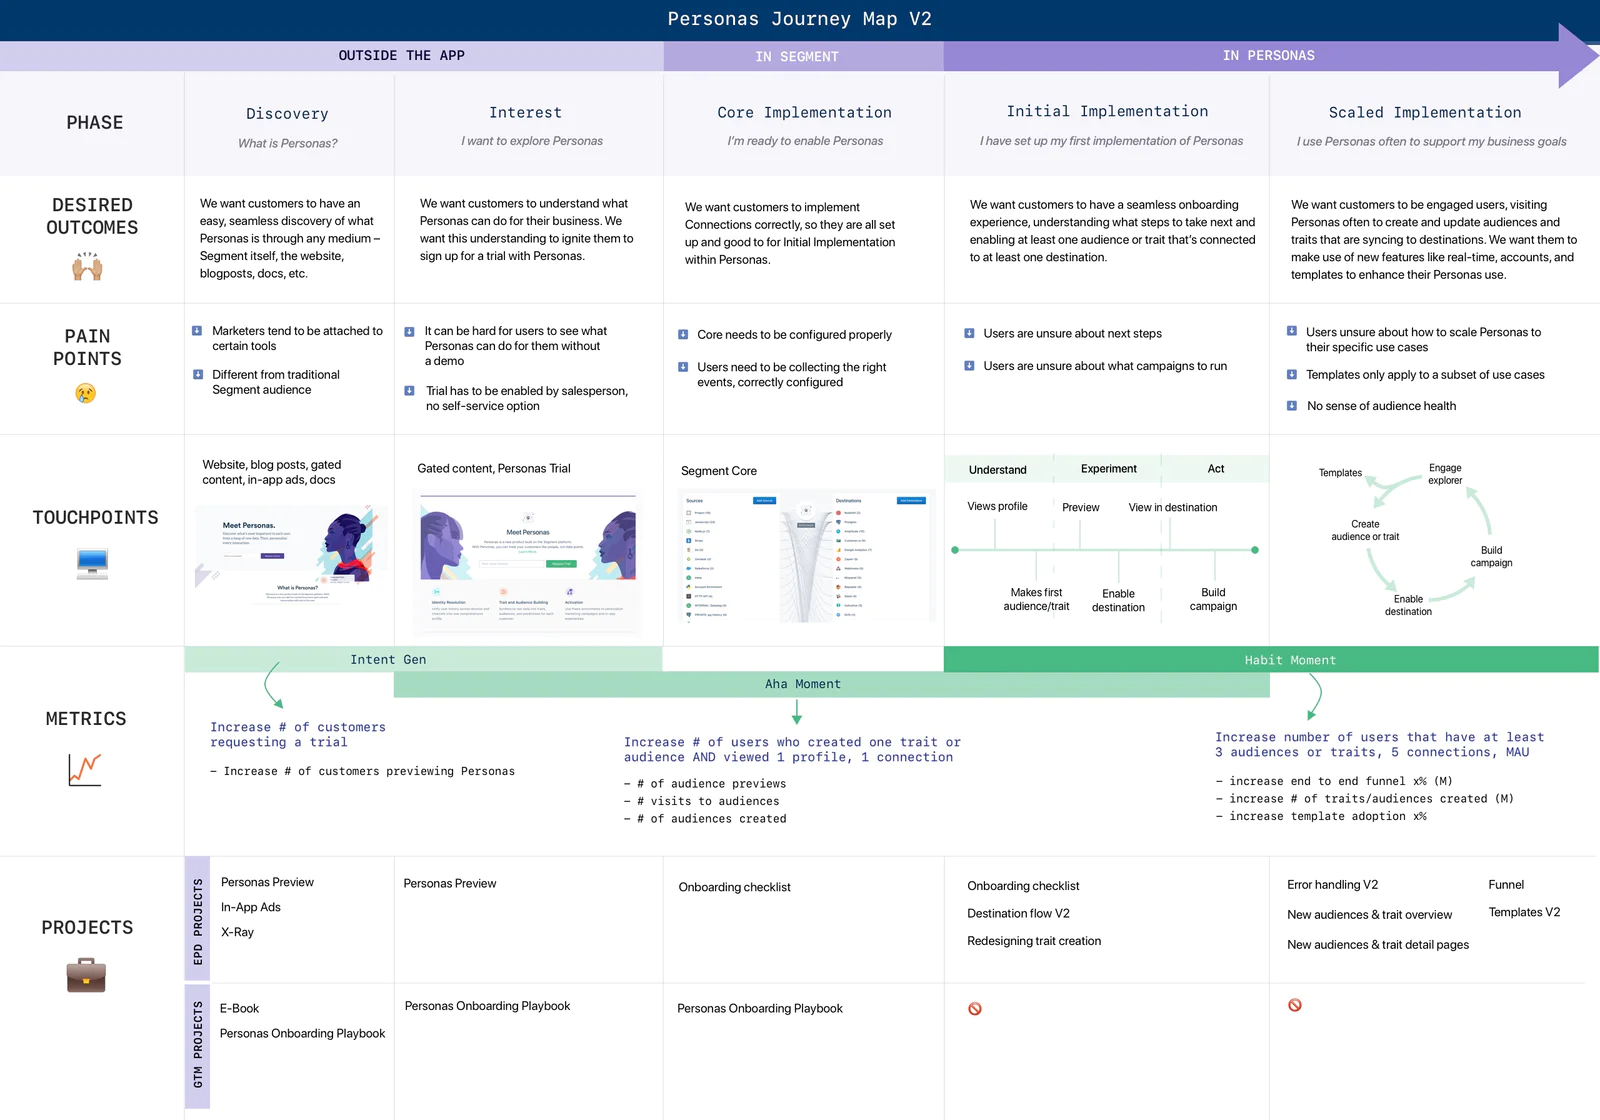
Mapping out your customer journey allows you to make more informed decisions about what parts of the product journey customers are struggling through the most in order to drive activation (through the aha moment) and retention (through the habit moment).
At Segment, we created a journey map that tied together the metrics we were collecting on enabling adoption and qualitative insights from customers to create a full understanding of how customers are using Personas and how we want them to be using it, in order to map projects to specific efforts accordingly.

Now, our roadmap is informed by efforts that are specifically designed to move a specific, measurable metric, supplemented by qualitative assessments of these efforts. For instance, this quarter, we identified initial implementation of Personas as an area of friction, based on the rate at which our users were reaching the Aha Moment.
We decided to focus our efforts on understanding what prevents users from reaching this moment in the app, and dedicating resources towards enhancing the on-boarding and set up experience, as well as begin to track more granularly what kinds of actions users take within the app the first time.
The combination of all of this data — both quantitative and qualitative — allows us to create a bigger picture of our product usability that we can begin to report out internally to give everyone a sense of how we are progressing in our journey to activate, retain, and delight our users.

This gives us a clear sense of our health right now, where we could be doing better, how we can conduct further usability testing, and what we should tackle next — all driven by a holistic view of our customers.
How will you use this product usability framework to better enhance adoption and engagement in your product? Let us know!
Product usability is defined as how easy and intuitive it is for a user to understand how a product is used and achieve their desired goal with the product.
Product usability is determined by how easily a user can learn to navigate the user interface design, how efficiently and accurately they can complete desired actions within the product, and how satisfied they are with the product. To measure the usability of a product, companies often use the SUPR-Q metric, which breaks down into the following categories: Usability, Credibility, Loyalty, & Appearance.
The most important step you can take to improve product usability is to collect qualitative and quantitative data from users on usability. Once you have this data you can use it to formulate an understanding of the real-world customer journey users have with your product, identify any areas of struggle where your product is not meeting user needs, and update the UI to improve them.
Congratulations!
You’ve completed all lessons in the Twilio Segment Analytics Academy.
Enter your email below and we’ll send lessons directly to you so you can learn at your own pace.