Category adoption
In addition to a company's specific stack changes, we can study aggregate data to see when new product teams add tool categories. The following graph shows what percent of a specific integration was added as the first integration, the second integration and so on …
For the first tools, people approach us predominantly with an "analytics use case". Over 60% of the 'first tool' installs are made up of either Mixpanel or Google Analytics. Moreover these tools have some sort of real-time interface or data QA check.
For the 3-9 tools, we start seeing a significant uptick in advertising: Facebook Pixel and Adwords. By the fourth integration that users enable, Facebook Pixel & Google Adwords have the top spots.
Lessons learned
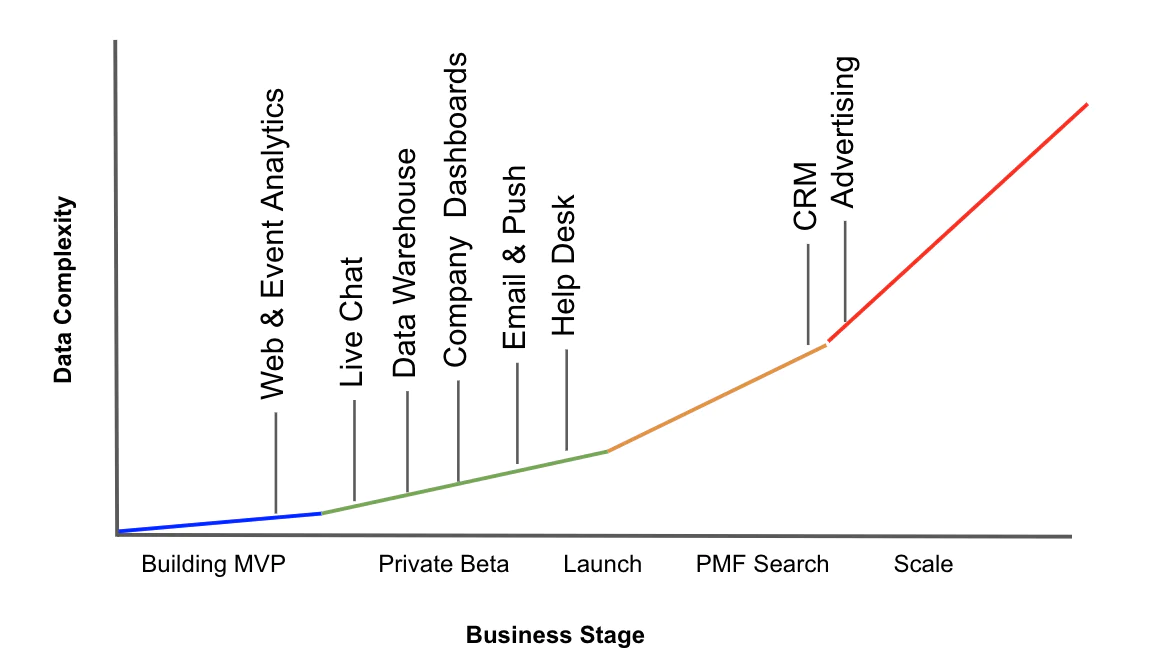
Stack changes are correlated with new hires and changing business goals. New products generally launch with a light stack of a few analytics and email marketing tools. Growth consultants and new hires are brought in during company scaling phases and try new growth strategies like A/B testing (Optimizely), retargeting (Adroll), or just new data to create audiences on (Clearbit). New product launches often cause entropy on the stack (such as new in-app messaging campaigns on Intercom). As a marketing organization becomes more mature, growth consultants will be brought in to manage acquisition, performance marketing, and any referral programs.
Scale and specialization allows more advanced tools to be introduced. When a company is small, with limited resources, they'll typically purchase more user-friendly, approachable tools that the product team can get into and understand easily (Intercom, Mailchimp, Amplitude, etc). As the company scales and gets more sophisticated, more complex and powerful tools are introduced (Salesforce Marketing Cloud, AutoPilot, Looker).
New analytics & growth tools enable serious strategy changes for businesses. Analytics tools lead to insights that shape new pricing & packaging models. They also lead to a better understanding of which marketing channels work best for a company, and where to double down marketing spend. Analytics tools help a company understand which content works best for their customers. In-app messaging drive better engagement and retention within the product, increasing growth.
Prepare for change. The average Segment customer collects data from 7 sources types (web, mobile, crm, email, ..) and integrates each source with an average of 8 destination categories (analytics, warehouses, email marketing tools, re-marketing and paid acquisition, ..). That means the average customer is utilizing 56 point to point integrations. As we learned above, new business strategies, new hires, and new regulations cause high entropy in the stack over many years.
Reduce the cost of change. In 2018, Segment hit a new record: our users enabled 86,551 new destinations over the course of the year. Assuming a 40-hour work week, our customers were turning on a new tool every 1.4 minutes of every workday. To better understand how impactful this was, we surveyed 100 of our customers. On average, they told us it took 100 engineering hours to connect a new tool, not to mention the 21 hours of recurring maintenance per month. This might sound like a long time to just add a few hundred lines of code, but to fully QA, test, and ship to production, the time quickly adds up. Throughout 2018, Segment saved engineers more than 4,000 engineering years worth of implementation time. We recommend you use an analytics platform to abstract data collection from integration.


