Maintaining a consistent naming convention is a great way to ensure your analytics data is clean and easy to use. But knowing how to send a .track() call can tremendously step up your analytics game—you’ll be able to create funnels and analyze cohorts, while still having the freedom to explore your data. Not only that, but the code footprint is smaller, so it’s easier to manage and maintain, especially if you’re using a tracking plan.
This week, we’ll show you that you can answer anything and keep your analytics scope manageable if you include the right data in your .track() call. We’ll also provide examples and reveal a little bit about what is going on beneath the hood.
Event-based analytics
Almost all analytics and marketing automation tools today are event-based. Events are actions that are triggered by something your customer performs on your site or app. Examples including Account Created or Song Played.Every time this event occurs, a new record is created in the analytics database.
To record that action, most tools have a .track() call (it may not be called “track”—this is what Segment’s API uses—but there are equivalents). If you’re smart and consistent with what you include in these .track() calls, your analysis can be flexible and powerful.
What is a '.track()' call?
A .track() call captures the most atomic piece of data in an analytics database. It represents one unique row; an action that a user performed on your site or app, with the contextual information like when, where, and (sometimes) how it happened, nested as properties. With an aggregate of these records, you can understand overall product usage, funnels, and trends. Or, you can trigger personalized messages to specific set of your users with your email tool.
Here is the anatomy of a .track() call in three different flavors: Segment, Mixpanel, and Google Analytics. Note we’re following the Object Action Framework that we laid out in the previous Academy lesson, with the property names in snake_case.
Segment (analytics.js)
Segment analytics.js documentation.
Google Analytics (analytics.js)
Google Analytics analytics.js documentation.
Mixpanel
Mixpanel's javascript documentation.
The .track() call captures more than just the event name. It includes the timestamp, the user who performed the action, and other contextual specifics that help you conduct your analysis later.
All .track() calls include the following: userId, event, properties , and timestamp:
userId: you may have noticed that userId was never explicitly sent in the .track() examples above. That’s because these calls were all sent using client-side Javascript libraries, where userId is automatically set and sent behind the scenes (we’ll dive into this more next week). What you should know is that the userId is a unique identifier of the user and that it’s important to tie events back to the user. This allows you to follow a single customer’s events over time for cohort and other useful analyses.
event: the event name. You can create trends and usage reports based on these names. This is why it’s important to stick to a consistent naming convention, so it’s easier to do analysis without having to second guess if the event is the right one. See our last lesson.
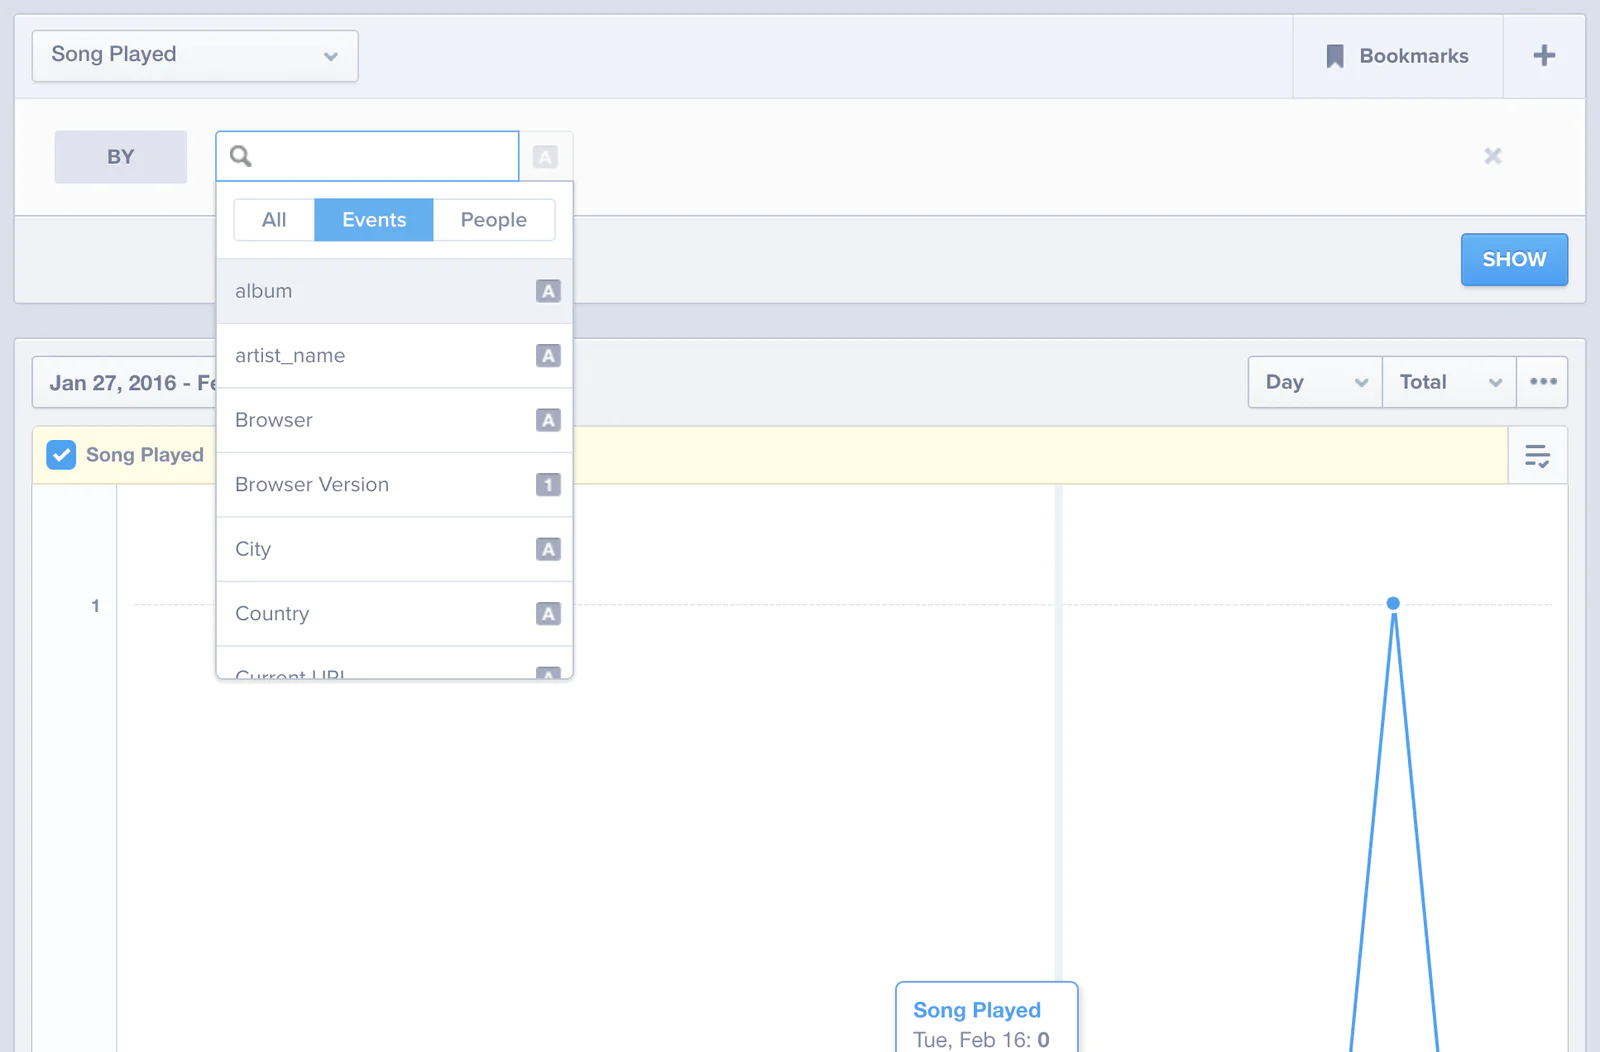
properties : this is a set of keys and values that provide more context around the event itself. For example, which song was played. These values are useful to provide additional dimensions upon which you can slice and dice your data. As such, it’s better to use them for specifics and keep the event names general.
sent_at (time stamp): again, this one wasn’t explicitly sent. However, all libraries will automatically record the time and send it. This is useful for looking at events over time or ordering events chronologically.
Though it may be confusing what pieces of data to send in each part of the .track() call, here is a peek at the underlying technology that informs what analyses is achievable.
How do they get stored?
Most analytics services will store each record as a row in a relational database (we won’t get too in the weeds, since the technical details can vary amongst companies). But this database allows the analytics tools to be able to parse your data based on your event type and any combination of its properties.
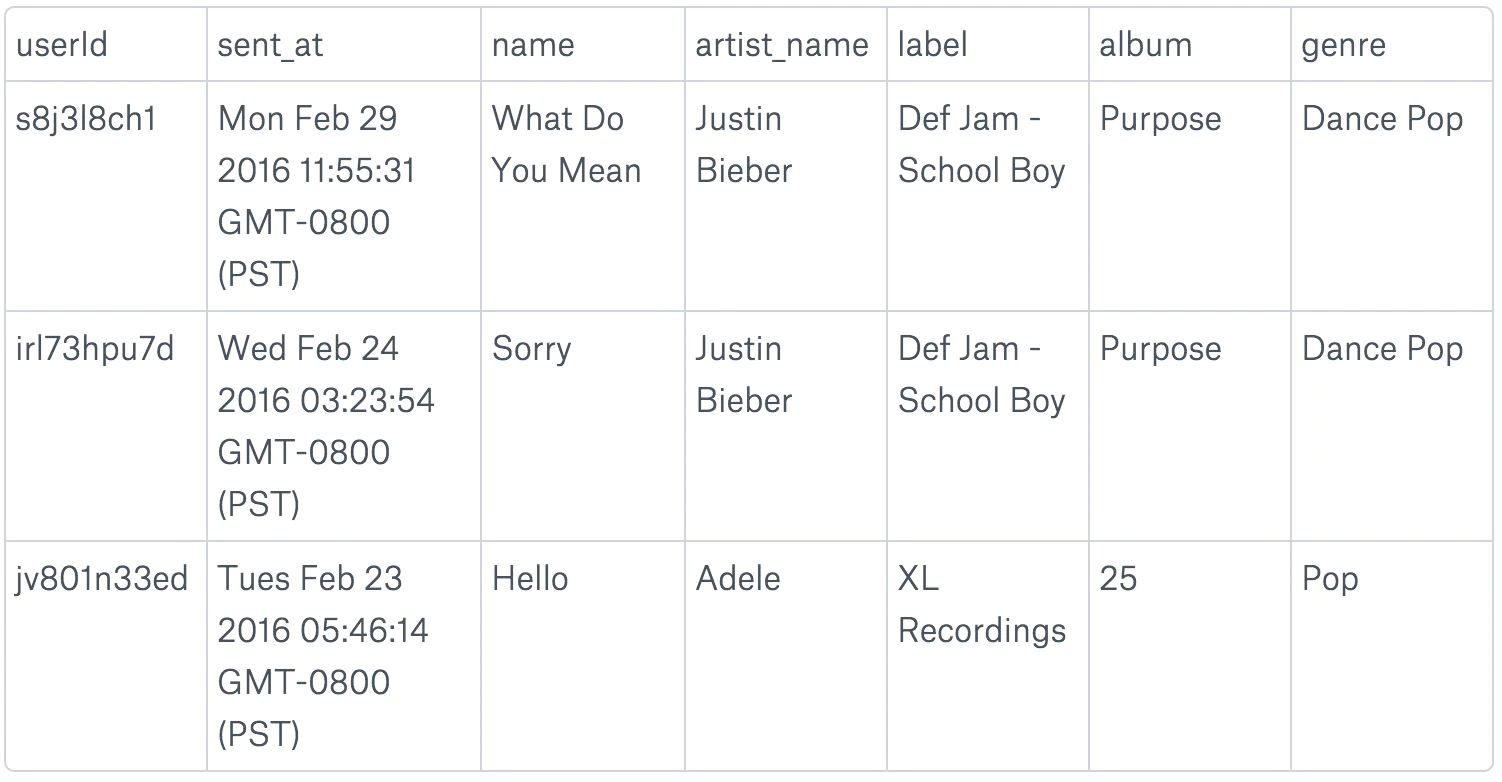
Relational databases are like spreadsheets—each row is a unique event and columns are property names. Note that since the properties can vary depending on the event, each event will have its own table. We’ll show how you can easily pivot and group this data in the analytics tools.
This is an example of the Song Played table:


