Accelerating your time to value with effective Observability

Twilio Segment provides a comprehensive suite of tools for efficiently managing, activating, and analyzing your organization's data, ensuring transparency and empowering you to unlock its full potential effortlessly.

By Peter Tuhtan

At Twilio Segment, we are trusted with the lifeblood of your organization: your data.  Whether you’re activating data to your warehouse from your website, taking data from that warehouse and sending it to integration partners, building robust profiles, or taking advantage of out of the box marketing capabilities included in Twilio Engage, Segment is the data Swiss Army Knife to deliver value.  

Managing data is a hard task, and only well managed data turns into value.  There are generally 3 problems that Segment users are trying to solve: 

  • getting data in 
  • deciding what data is good/bad/related/valuable 
  • getting data back out to activate a use case  

The major issue we face in solving this is how robust and quickly Segment’s capabilities have grown.  In the past two years, we’ve introduced Reverse ETL to activate warehouse data, automatically computed and AI predictive traits to deliver effortless access to machine learning, insert functions to enrich your data in real time from, and many other capabilities aimed at helping provide value quickly.  

Just as data is the lifeblood of an organization, Analytics and Observability are the lifeblood of great data products. Said more clearly, in order to get value out of your data, the tooling you use to manage it must be obvious, insightful, actionable. Additionally, you have to understand the ecosystem your data is built on.  

This hasn’t traditionally been simple as customers have shared that the disconnected experiences in the app between cloud, streaming, and storage data connections was cumbersome. Recently at Segment, we embraced the challenge and are working on an initiative to give you the full suite of features needed to quickly get value out of your data. 

The new mission for Segment’s Observability team is to give end-to-end coverage for all of our features. We launched our first feature in this initiative, called Delivery Overview, to public beta in 2023.  We’ve learned more about how our customers use Segment and are actively working on a complement of new features across the full suite of offerings to better monitor, visualize, and debug your CDP.

While we go on this mission of releasing new features, we’ve taken an inventory of the features you can use today to accelerate your time to value,  and we’ve included a few previews of features coming in 2024.

Feature Overview

Debugger

Streaming Sources Debugger

Let’s start with the long standing staple, the Debugger. It’s elegant in how simple it is, and is easily the most widely used feature within the Segment website.  Find the debugger by clicking into a source you want to inspect (Connections -> Sources -> Source Name) and select the debugger tab. You’ll find a live stream of your data entering Segment, with only seconds of delay, so that you can see a sample of your events as they flow in the front door of your source.  It also shows how events are being blocked by your tracking plan or source filters.  However, it's limited in that it only shows a sample and relatively new events, so high volume sources or users needing more historical data may need additional features.  

Functions Errors Debugger

If you’re a user of Source Functions, you will see the Errors tab under your source. This stream of data is all of the errors that get surfaced out of your Source function (hopefully none…).  We also track these errors on your Delivery Overview pages as aggregates of all the error messages you receive over time.  

Unify Debugger

This little gadget is well hidden, but valuable! If you’re curious about the data that Segment generates for your Audiences and traits, here is where you can dig into the raw stream of events as they are created and synced back to your profiles. You can find the Unify Debugger under a Unify Space’s Settings (Unify -> Space -> Unify Settings).  

Source Overview and Schema

Your streaming sources are one of the major entry points for customer data into Segment.  We have product features like Source Functions, Source Transformations, Source Filters, and Protocols which give you fine grained control over what your data looks like and where it can go.  Streaming sources are a key differentiator, and our tools Source Overview and Schema provide insightful analytics on the volume of events and properties that Segment is receiving.  

In Source Overview, you can view your event volume from minute to daily granularity over the past 30 days, breakdown your source by type, event name, or app version - and then use this data to configure source volume alerts (see below).  You also get an at a glance view of all of your destinations configured for this source.  

The schema page is all about the information in each event.  You can view the unique trait names on your identify events, how recently events and properties were received for track events, and see which events are being blocked by your tracking plans.  Additionally, you can configure which events you want to go to which integrations with a simple slide toggle. 

Delivery Overview

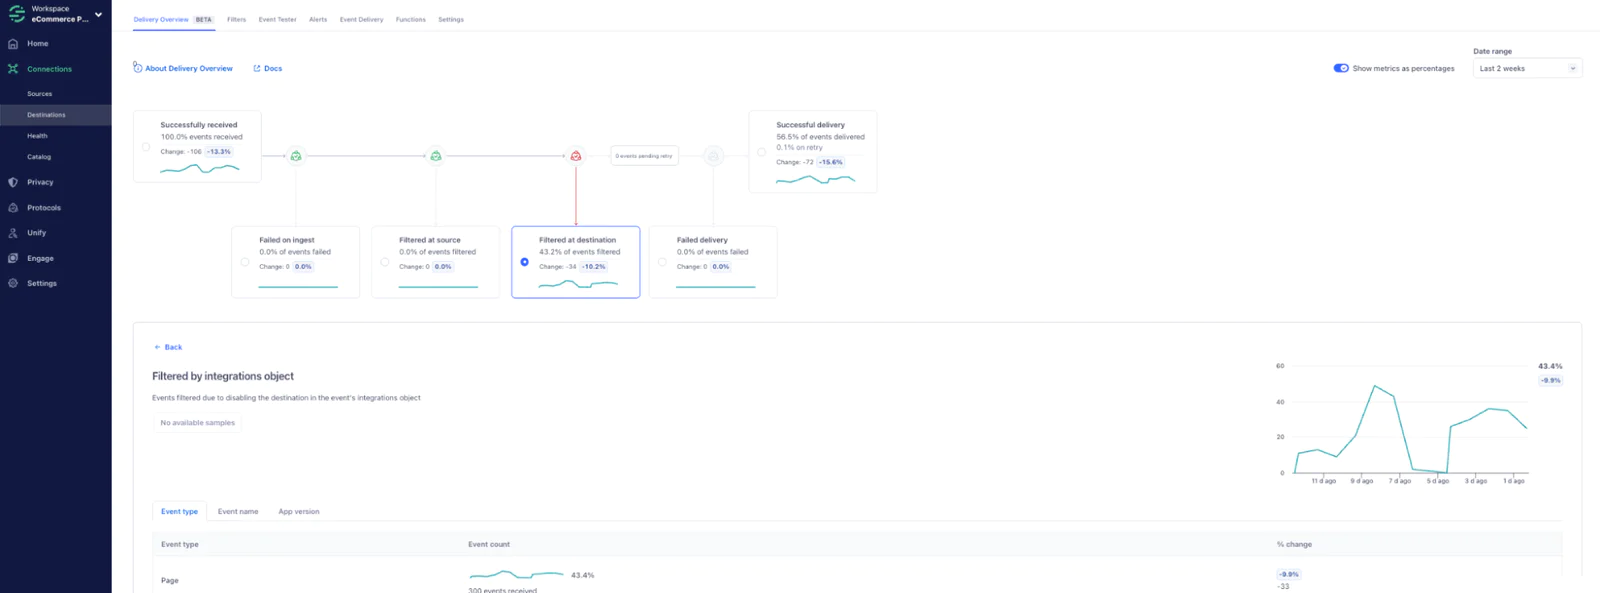
Delivery Overview (or “DO” as we call it between our digital cubicles) is the most recent observability feature released within Segment, and it begins to explore the complexity of our features, such as tracking plans, functions, and destination filters.  Delivery Overview is a data funnel for every source to every destination. It starts with the number of events you sent, and ends with the number of events actually delivered.  Every customer's usage of Segment is a little bit different, so Delivery Overview aims to show you all the various ways your business’ logic can affect data delivery.  

Delivery Overview supports viewing samples related to events that dropped at Ingest Failure and Delivery Failure. It supports all Classic and Actions destinations - including Destination Functions, with breakdowns by Mapping subscription.  Additionally, it also supports Insert Functions - surfacing the data to the filtered at destination (soon) or failed delivery step depending on how you write your logic.  

While customers will be constrained to the manner in which the metrics found in DO are presented to them via the app, we are sprinting to bring DO’s new insights into our Public API. This will allow for much more creativity and flexibility in how you may want to consume the available data. More on this, when we talk about our alerting enhancements 🙂.

Event Delivery

Event Delivery is our oldguard for providing observability into your Connections and how their delivery performance is trending. However, Event Delivery solely focuses on the delivery attempt/transaction at the end of your data’s journey through Segment; hence the development of Delivery Overview, to give you the full picture. While DO remains in beta, you can still access Event Delivery and it will remain available until DO has full parity with a few final details (latency, etc).

In the case of Audiences syncing to a destination, Segment is creating the events (Audience Entered, Audience Exited) when your audience profiles change.  There’s a lot of complexity under the hood to track that, so stay tuned for a Delivery Overview experience for Audience Syncs in 2024, with an emphasis on improved observability into the Audience(s), Profiles, and/or Entities as they travel towards the intended destination. 

In the meantime, use Event Delivery to understand how your Destination is performing for Audience Syncs, such as successful event counts, failed event reasons and samples, and latency from event creation.  

Warehouse Overview

Warehouses are absolutely on the rise (again? 🙃), but we’ve been in the game since 2016.  Use the Warehouse Overview page to view the status and details of each sync Segment creates.  You can see the volume of each collection, and how it has changed over time. 

With this current offering, we’re once again focusing on the delivery of data to the destination, so, you guessed it, there is a Delivery Overview for you coming this year! The data moving to your storage destinations still adheres to the same various rules and filters made available to you throughout Segment, so we’re hard at work making sure those are represented from start to finish across your syncs downstream.  

Reverse ETL 

In today’s Reverse ETL (RETL) observability offering, you can check the status of your data extractions and see details of your syncs. 

Examining this will allow you to understand how many records were extracted, as well as a breakdown of the number of records added, updated, and deleted. Additionally, you can view the load results, to understand how many successful records were synced as well as how many records were updated, deleted, or are new. Click into failed syncs to view additional details on the error(s), sample payloads to help you debug the issue, and recommended actions.

Unsurprisingly, we believe (and have customers that believe) that there is a Delivery Overview that would fit right in here; once again giving us the full end-to-end picture of your RETL Connection’s performance over time. We’ll be actively seeking customer feedback on this soon (please reachout to ptuhtan@twilio.com if interested in participating)!

Profile Insights

Profiles are the key to value for Segment, and understanding how your data across all of your sources builds those profiles is vital.  With Profiles Insights, you can troubleshoot event data with transparent insight into your Unify profiles. You can view errors and violations, success logs, and an audit trail for configuration changes that impacted your profile resolution. 

We provide a wide range of filtering capabilities to ensure you can find the data you are looking for - by identifier, event type, date range, or source.  Recently, we removed the restriction of only being able to view the last 30 days of data, so new events will be accessible for all time.  Next up is visualizing how this data changes over time, so stay tuned!

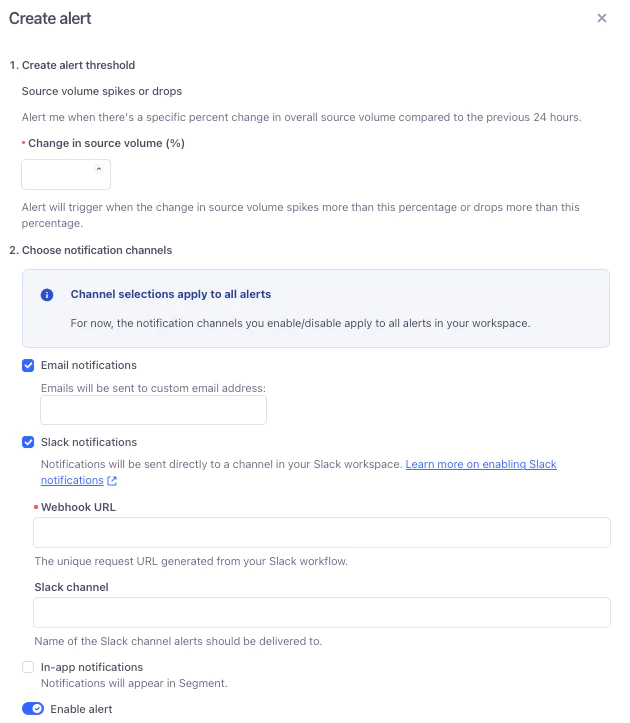
Monitoring and Alerting

We know you don’t live in the Segment app all day (like us).  And you really only care about Segment when you want to generate some new value or when things aren’t working.  So automated monitoring and alerts are near and dear to the vision we have of our future. Today, you can get push notifications in the app or to your Segment email for a number of events that happen, and periodic alerts when your data isn’t behaving to your standards. Just released, we also support Slack and custom email channels for Connections Alerting so you can integrate your monitoring with the tools you use. We’re constantly evaluating new channels to ensure your Segment monitoring plugs and plays just as easily as your Segment data. 

Activity Notifications

We know mistakes happen, and we keep track of all of your Segment configuration changes in the Audit Trail so you can pinpoint what changed when issues occur. Additionally, you can subscribe to changes to many of these settings by navigating to Settings > User Preferences > Activity Notifications and selecting the tab for the feature you want to subscribe to.  

Connections Alerting

We like to think data can be predictable, but in any ecosystem anomalies can happen. That's where data quality alerts like Source Volume Spikes and Destination Delivery Failure subscriptions come in.  Find these configurations under your Source or Destination instance Alerts tabs.  You can easily set the acceptable bounds for your integration and subscribe to alerts to your Segment user, a slack channel, or a custom email address. 

Closing

Whether you’re a long time user of Segment or new to the ecosystem, we won’t be satisfied until your business unlocks the power of your data.  Segment’s long time mission has been to bring data to the fingertips of anyone in your business who needs it.  Those users rely on Segment, so we want to build the tooling for you to trust our platform.  If you have ideas, please don’t hesitate to reach out.

Test drive Segment CDP today

It’s free to connect your data sources and destinations to the Segment CDP. Use one API to collect analytics data across any platform.

Recommended articles

Loading

Want to keep updated on Segment launches, events, and updates?