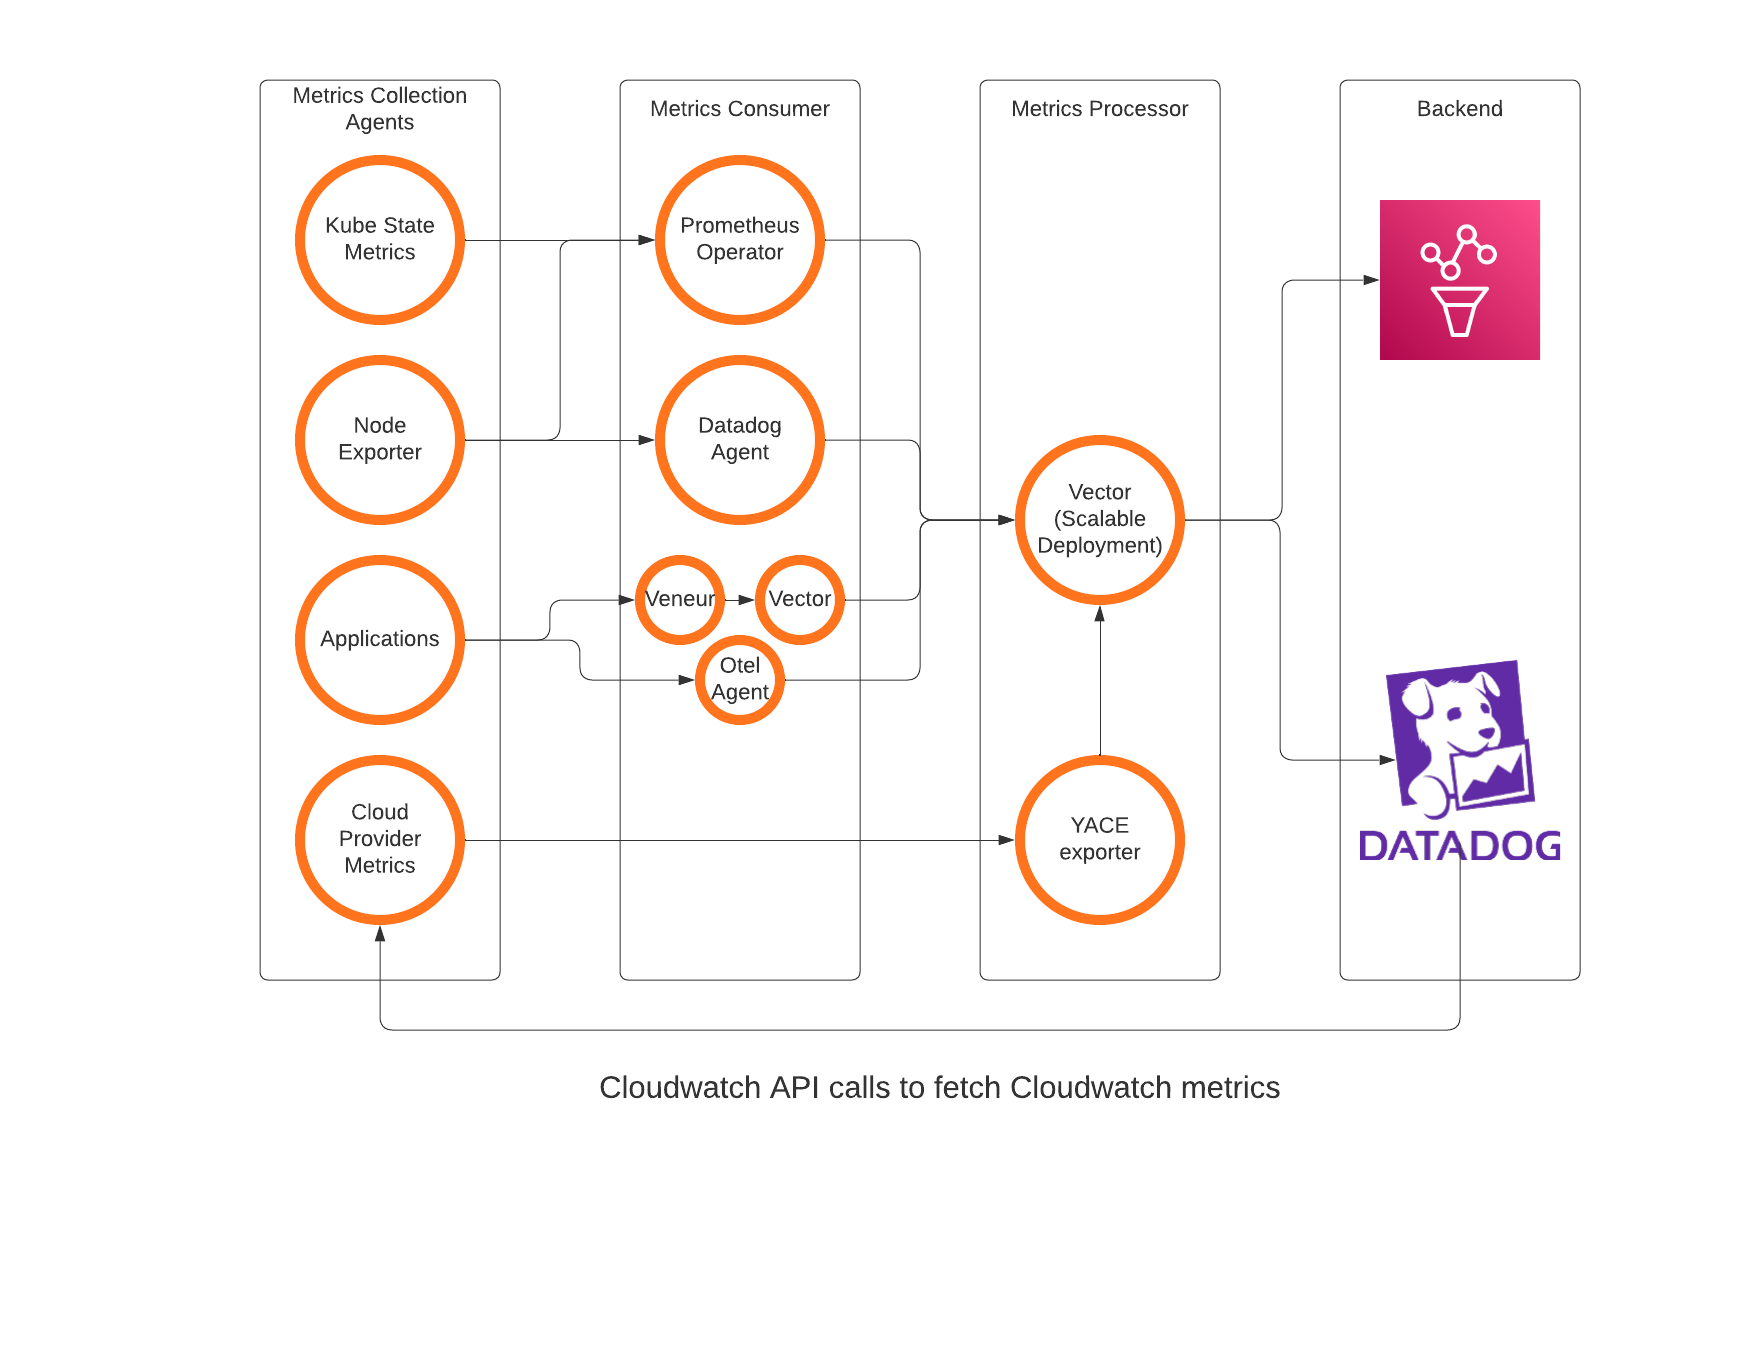
The metrics data pipeline provides end users the flexibility to easily pass their metrics to desired destinations without the need to make any major changes in the instrumentation within the code. Let us dive deeper into the components that make up the pipeline.
Kube State Metrics & Node Exporter
These applications are responsible for gathering metrics in and around Kubernetes infrastructure. The metrics from Kube State Metrics pods are collected by Prometheus Operator while Datadog agent has an embedded Kube state metrics library for faster performance. For node exporters, both Datadog agent and Prometheus operator continuously scrape the agents on each node.
Prometheus Operator
Prometheus Operator is used specifically for collecting the Kubernetes system metrics and sending them to Amazon Managed Prometheus. Prometheus operator supports recording rules which helps us pre-process certain complex metric equations in order to speed up the queries in Grafana. Additionally, we are also able to control the volume of metrics and cost thereby as we completely block the actual metrics from being sent to Amazon Managed Prometheus. This adds some overhead of modifying rules when in need of new metrics. However, over time it has gotten quite stable and we have all we need.
Open telemetry agent (Otel Agent)
In order to overcome the scalability problems of Prometheus and prevent application metrics from having downtime due to the same, we modernized our approach for scraping Prometheus metrics from the applications. While considering a 20-30% increase in the metrics being published, we shifted the recording rules for some of our applications onto Amazon Managed Prometheus (AMP) thereby sending all the application metrics data to AMP via Otel agent.
Veneur
Veneur is a metric aggregation agent that ingests metrics from multiple pods on the node, aggregates them over a period of 10 seconds (configurable) and publishes them eventually to Datadog. With the new metrics pipeline, a vector agent runs alongside veneur to consume data from veneur that eventually reaches Datadog.
Vector agent
Vector running as an agent is responsible to inject a few common cluster level tags and buffer the metrics data when the central unit is overloaded or restarting. The buffering ability helps ensure decrease in data loss when the central unit restarts. As a general rule, we attempt to restart this agent only in an event of standard version upgrades to ensure minimal data loss.
Datadog agent
Datadog agent is the system metrics consumer for Datadog. It scrapes metrics from Node Exporter, uses Kube State metrics as a library to gather K8s and nodes related metrics. Additionally, Datadog agent is also responsible to scrape Prometheus metrics that need to be sent to Datadog and consume distribution metrics from certain applications. There is a Datadog cluster agent that does the job of running standard checks and commanding the agents to scrape the metrics. This is primarily to reduce the load on K8s API as well as Datadog agent by reducing the number of agents querying Kubernetes resources.
Vector Deployment
As our central unit, our choice was fairly clear - we had to go with Vector. It is the only application that supports Datadog agent, Prometheus Remote write, as well as StatsD as a source. Using it as an agent as well as a central unit helps reduce the learning curve too. We did not really use the StatsD source for the central unit but intend to replace Veneur in the long run by consuming StatsD metrics directly. The central unit runs as a deployment that’s autoscaled using an HPA.
YACE Exporter
YACE Exporter is an excellent tool that allowed us to scrape Cloudwatch metrics and push them onto Prometheus backend. Although it was in alpha version and not actively being developed, we quickly gained knowledge into the tool and contributed a couple of PRs for enhancing its ability. It allows you to query Cloudwatch metrics in an optimal and highly configurable way along with resource tags. Tags is the key here - directly querying Cloudwatch metrics would not allow you to query metrics with resource tags. YACE made it possible.
Amazon Managed Prometheus
Amazon Managed Prometheus team from AWS has been a great partner for Twilio since we started using it. Over time, it has improved its performance and support massively. As of today, we leverage it as our backend for Prometheus metrics. Grafana supports Sigv4 authentication which makes it easy to integrate as well. AMP in its early days had a constraint of supporting hardly 5M active series from which it has scaled to a massive 500M active series support now. This made it possible for us to make it a single backend for all our Prometheus metrics.
The only drawback with AMP is its support for Alerting. As of today, it only supports SNS as the Alertmanager sink and there is no user interface that can be used for creation of alerts. We did manage to simplify alert creation by building an abstract Terraform module for the same.
Datadog
Datadog has been the backend for about 80% of our metrics in use today. It serves well, has a great user interface and end-users find it to be great too. We use it for Metrics dashboards, monitors, and SLO dashboards. We started using Datadog a while back and the main intent behind that was to have a simplified user experience while keeping the cost manageable. However, over the time, the costs have grown considerably leading to this entire Metrics pipeline initiative.
The drawback we observe with Datadog is primarily the cost of using other telemetry signals on Datadog. They tend to be relatively costly and can spike the costs randomly without providing sufficient visibility into what caused it.
Building the above pipeline and maintaining it was certainly a complex affair. Let us dive deeper into the technical challenges we have today and how we plan to navigate it.
Too many components
As evident from the large component list above, we have an elaborate list of components today that make this entire pipeline possible. In the long run, we certainly aim to get rid of some of these components by being opinionated about what we support and thereby move to a unified standard. One of the reasons for having these many components is our technical debt of every team trying to do what worked for them in the past.
In order for us to standardize the stack, there is considerable effort involved in migrating/modifying dashboards and monitors to use common metrics. As an end goal, we aim to completely get rid of Veneur as well as the Prometheus operator.
Non-standard approaches
In a couple of special cases, we had to drift away from standard approaches like scraping Prometheus metrics using Open telemetry agent. We’d eventually overcome the restrictions and get rid of Prometheus Operator entirely. The primary reason for doing this is that Prometheus is a Single Point of Failure today. It consumes large amounts of memory and auto-scaling has not been easy. With Open telemetry agent, on the other hand, it is simple. As the nodes spin up, we’d have a dedicated agent for each node. The only downside of getting rid of the Prometheus operator is that we’d have to push all the metrics onto Amazon Managed Prometheus and apply the recording rules there. This has a minor cost impact - which is to some extent balanced by our current dedicated Prometheus infrastructure.
Single Backend
Our present approach of multiple backend serves the flexibility that the user requires. However, it’s definitely not the end state we’d expect. Multiple metric backends add to the responsibility of maintaining infrastructure, contracts, and thereby uptime of multiple components, too. We’re not presently opinionated about the backend we’d choose, however, the pipeline definitely makes it a lot simpler to switch to a single backend. We’d invest effort towards automating this entire transition by transforming the expressions based on the decided backend.
Unified Observability UI
One of the key gaps we’ve had in our Observability stack is the lack of a single user interface where users can view all the telemetry data and much more. Grafana Cloud plays a key role at alleviating this complexity. It enables our end-users to plot their metrics, logs, and traces in the future on a single UI, providing a uniform experience across the stack. This is indeed the end-state we’re looking to reach with the process of modernizing our observability stack.
With the metrics data pipeline running successfully in Production for a while now, it has massively improved our metrics platform uptime. It has allowed us to control costs and data, as well as bring in tagging standards to the data sent out.
The pipeline opens doors to imagination of what more we can do with our metrics data. Today, we can confidently serve a high cardinality, or high ingestion rate, for the metrics data without any massive change to developer code. Additionally, we could easily route metrics to totally different solutions for any specific use cases or long term storage for future analytics of the same too.

