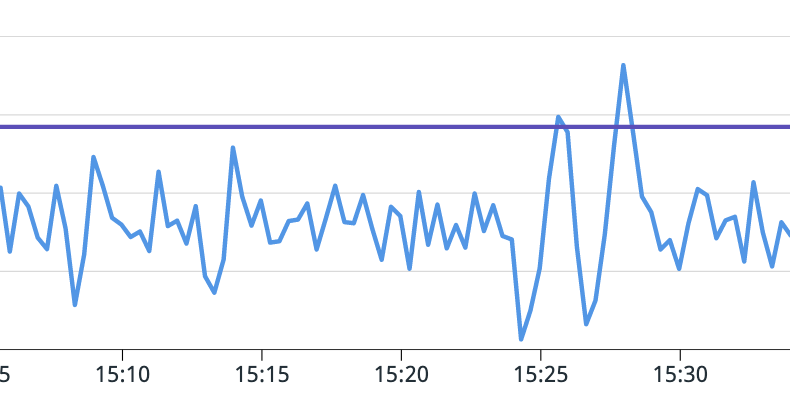
Horizontal scaling is a common scaling strategy for resource-constrained, stateless workloads. It works by changing the number of individual processes serving the workload, as opposed to the sizeof the resources allocated to those processes. The latter is typically known as vertical scaling. HTTP servers, stream processors, and batch processors are all examples of workloads which can benefit from horizontal scaling.
At Twilio Segment, we use horizontal scaling to optimize our compute resources. Our systems experience fluctuations in workload volume on many different timescales, from minute-to-minute changes to seasonal variation. Horizontal scaling allows us to address this without changing anything about the individual deployment unit, decoupling this operational concern from the day-to-day development workflow.
We deploy most services with Kubernetes, which means our most common tool for scaling them is the Horizontal Pod Autoscaler, or HPA. While appearing simple on the surface, the HPA can be tricky to configure properly.
Today we’ll look at basic and advanced HPA configuration, as well as a case where proper tuning led to a doubling in service efficiency and over $100,000 of monthly cloud compute value saved.
The HPA is included with Kubernetes out of the box. It is a controller, which means it works by continuously watching and mutating Kubernetes API resources. In this particular case, it reads HorizontalPodAutoscaler resources for configuration values, and calculates how many pods to run for associated Deployment objects. The calculation solves for the number of pods to run by attempting to project how many more or fewer are necessary to bring an observed metric value close to a target metric value.
Basic Usage
To use the HPA, we first must choose a suitable metric to target. To find the right metric, ask: for each additional unit of work, which additional resource does the service consistently need the most of? In the vast majority of cases this will be CPU utilization. The HPA controller supports memory and CPU as target metrics out of the box, and can be configured to target external metric sources as well. Throughout this guide, we will assume that CPU utilization is our target metric.
The primary parameters that the HPA exposes are minReplicas, maxReplicas, and target utilization. Minimum and maximum replicas are simple enough; they define the limits that the HPA will work within choosing a new number of pods. The target utilization is the resource utilization level that you want your service to use at steady-state.
To illustrate how the target utilization works, consider a basic HTTP server configured to use 1 CPU core per pod. At a given request rate, say 1k rps, the service might require eight pods to maintain a normalized average CPU utilization rate of 50%.
Now say that traffic increases to 1.5k rps, a 50% increase. At this level of traffic, our service exhibits a 75% CPU utilization.
If we wanted to bring the utilization back down to 50%, how would we do it? Well, with eight pods and 1k rps, our utilization was 50%. If we assume a linear relationship between the number of pods and CPU utilization, we can expect that the new number will simply be the current number, multiplied by the ratio of new to old utilization, i.e., 8 * (0.75/0.5) = 8 * 1.5 = 12. Thus the HPA will set the new desired number of pods to 12.
Tuning your target value
The target utilization should be set sufficiently low such that any rapid changes in usage don’t saturate the service before additional pods can come online, but high enough that compute resources aren’t wasted. In the best case, additional pods can be brought online within several seconds; in the worst it may take several minutes. The time required depends on a variety of factors, such as image size, image cache hit rate, process startup time, scheduler availability, and node startup time.
The final value will depend on the workload and its SLOs. We find that for well-behaved services, a CPU utilization target of 50% is a good place to start.
Monitoring
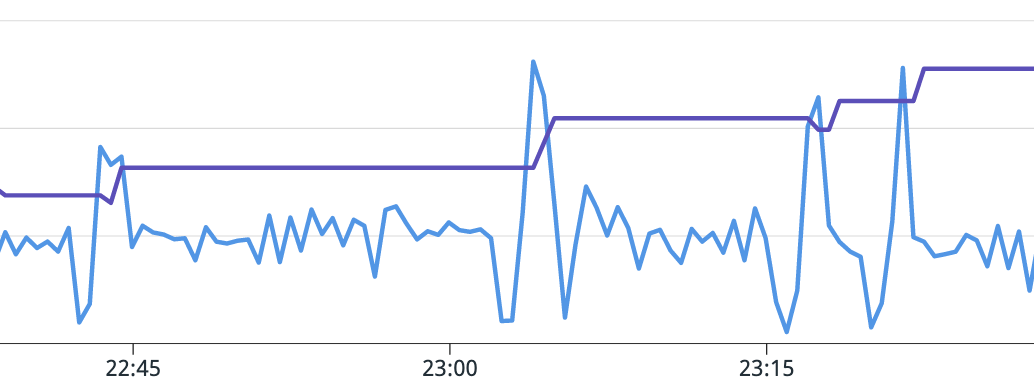
In order to better understand your service’s scaling behavior, we recommend exporting certain HPA metrics, which are available via kube-state-metrics. The most important is kube_horizontalpodautoscaler_status_desired_replicas, which allows you to see how many pods the HPA controller wants to run for your service at any given time. This lets you see how your scaling configuration is working, especially when combined with utilization metrics.
Kubernetes 1.23 brought the HPA v2 API to GA; previously it was available as the v2beta2 API. It exposes additional options for modifying the HPA’s scaling behavior. You can use these options to craft a more efficient autoscaling policy.
Understand your utilization patterns
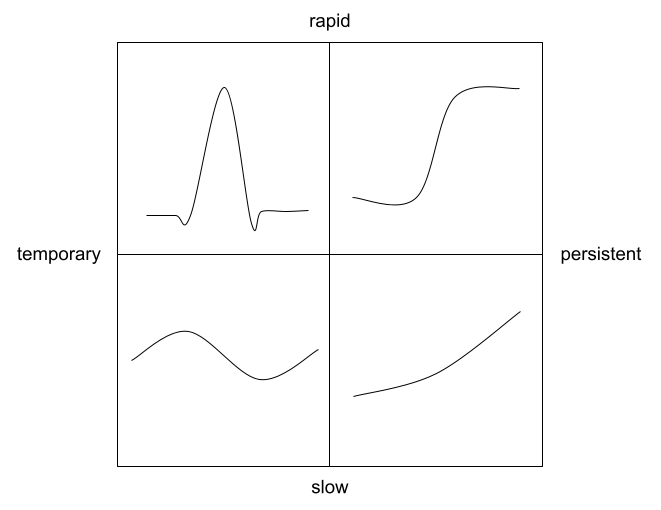
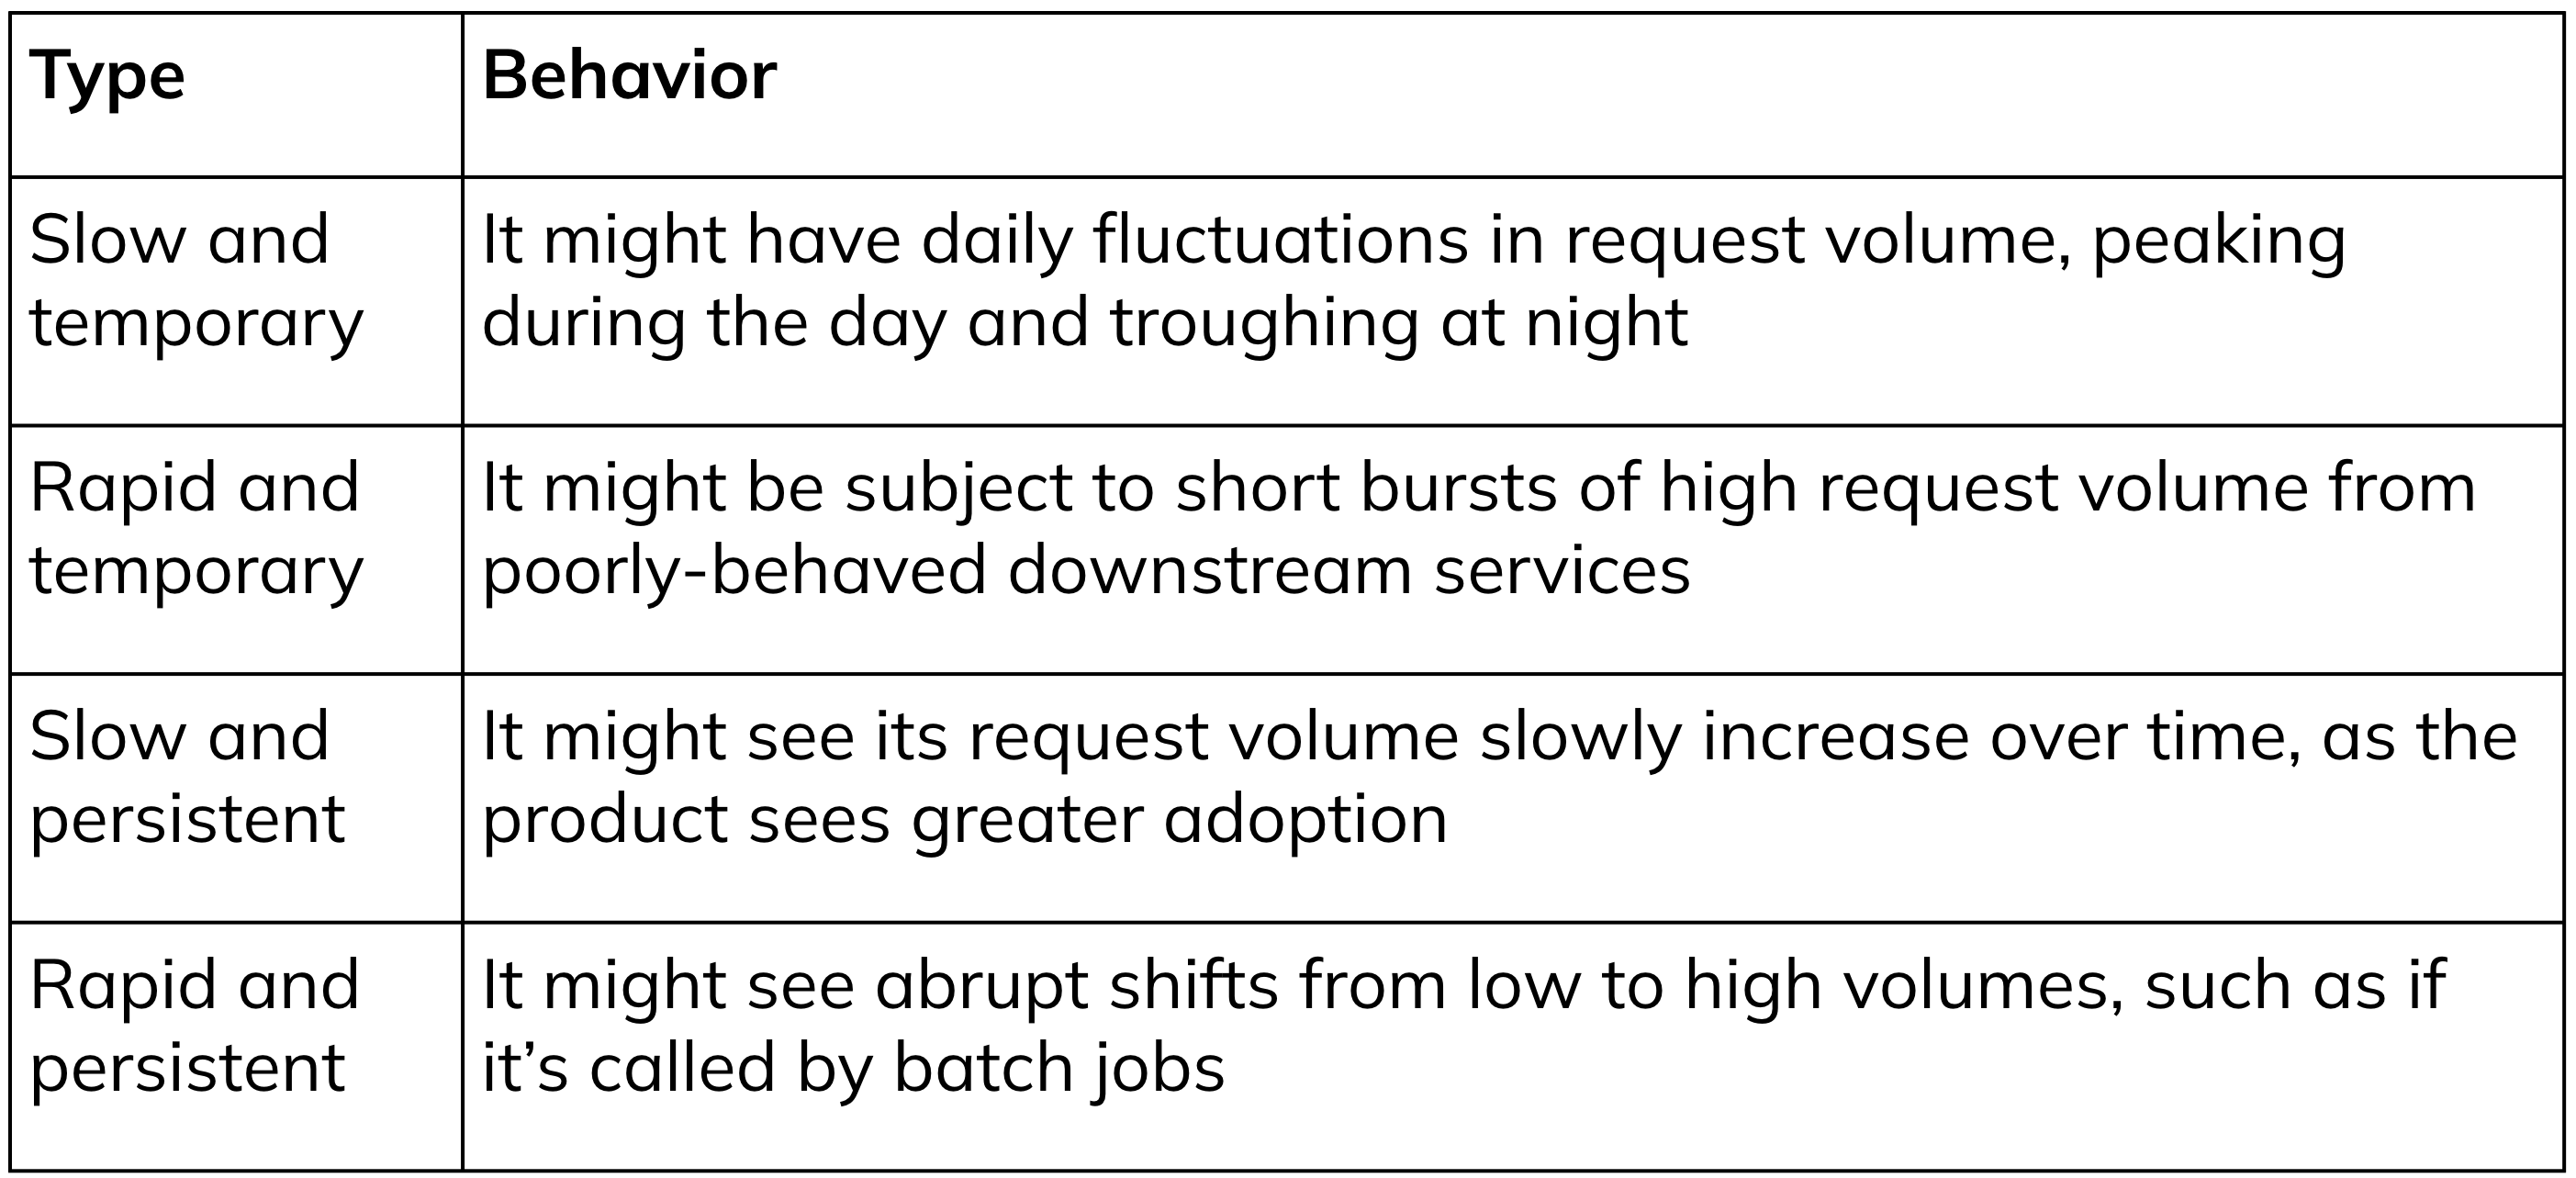
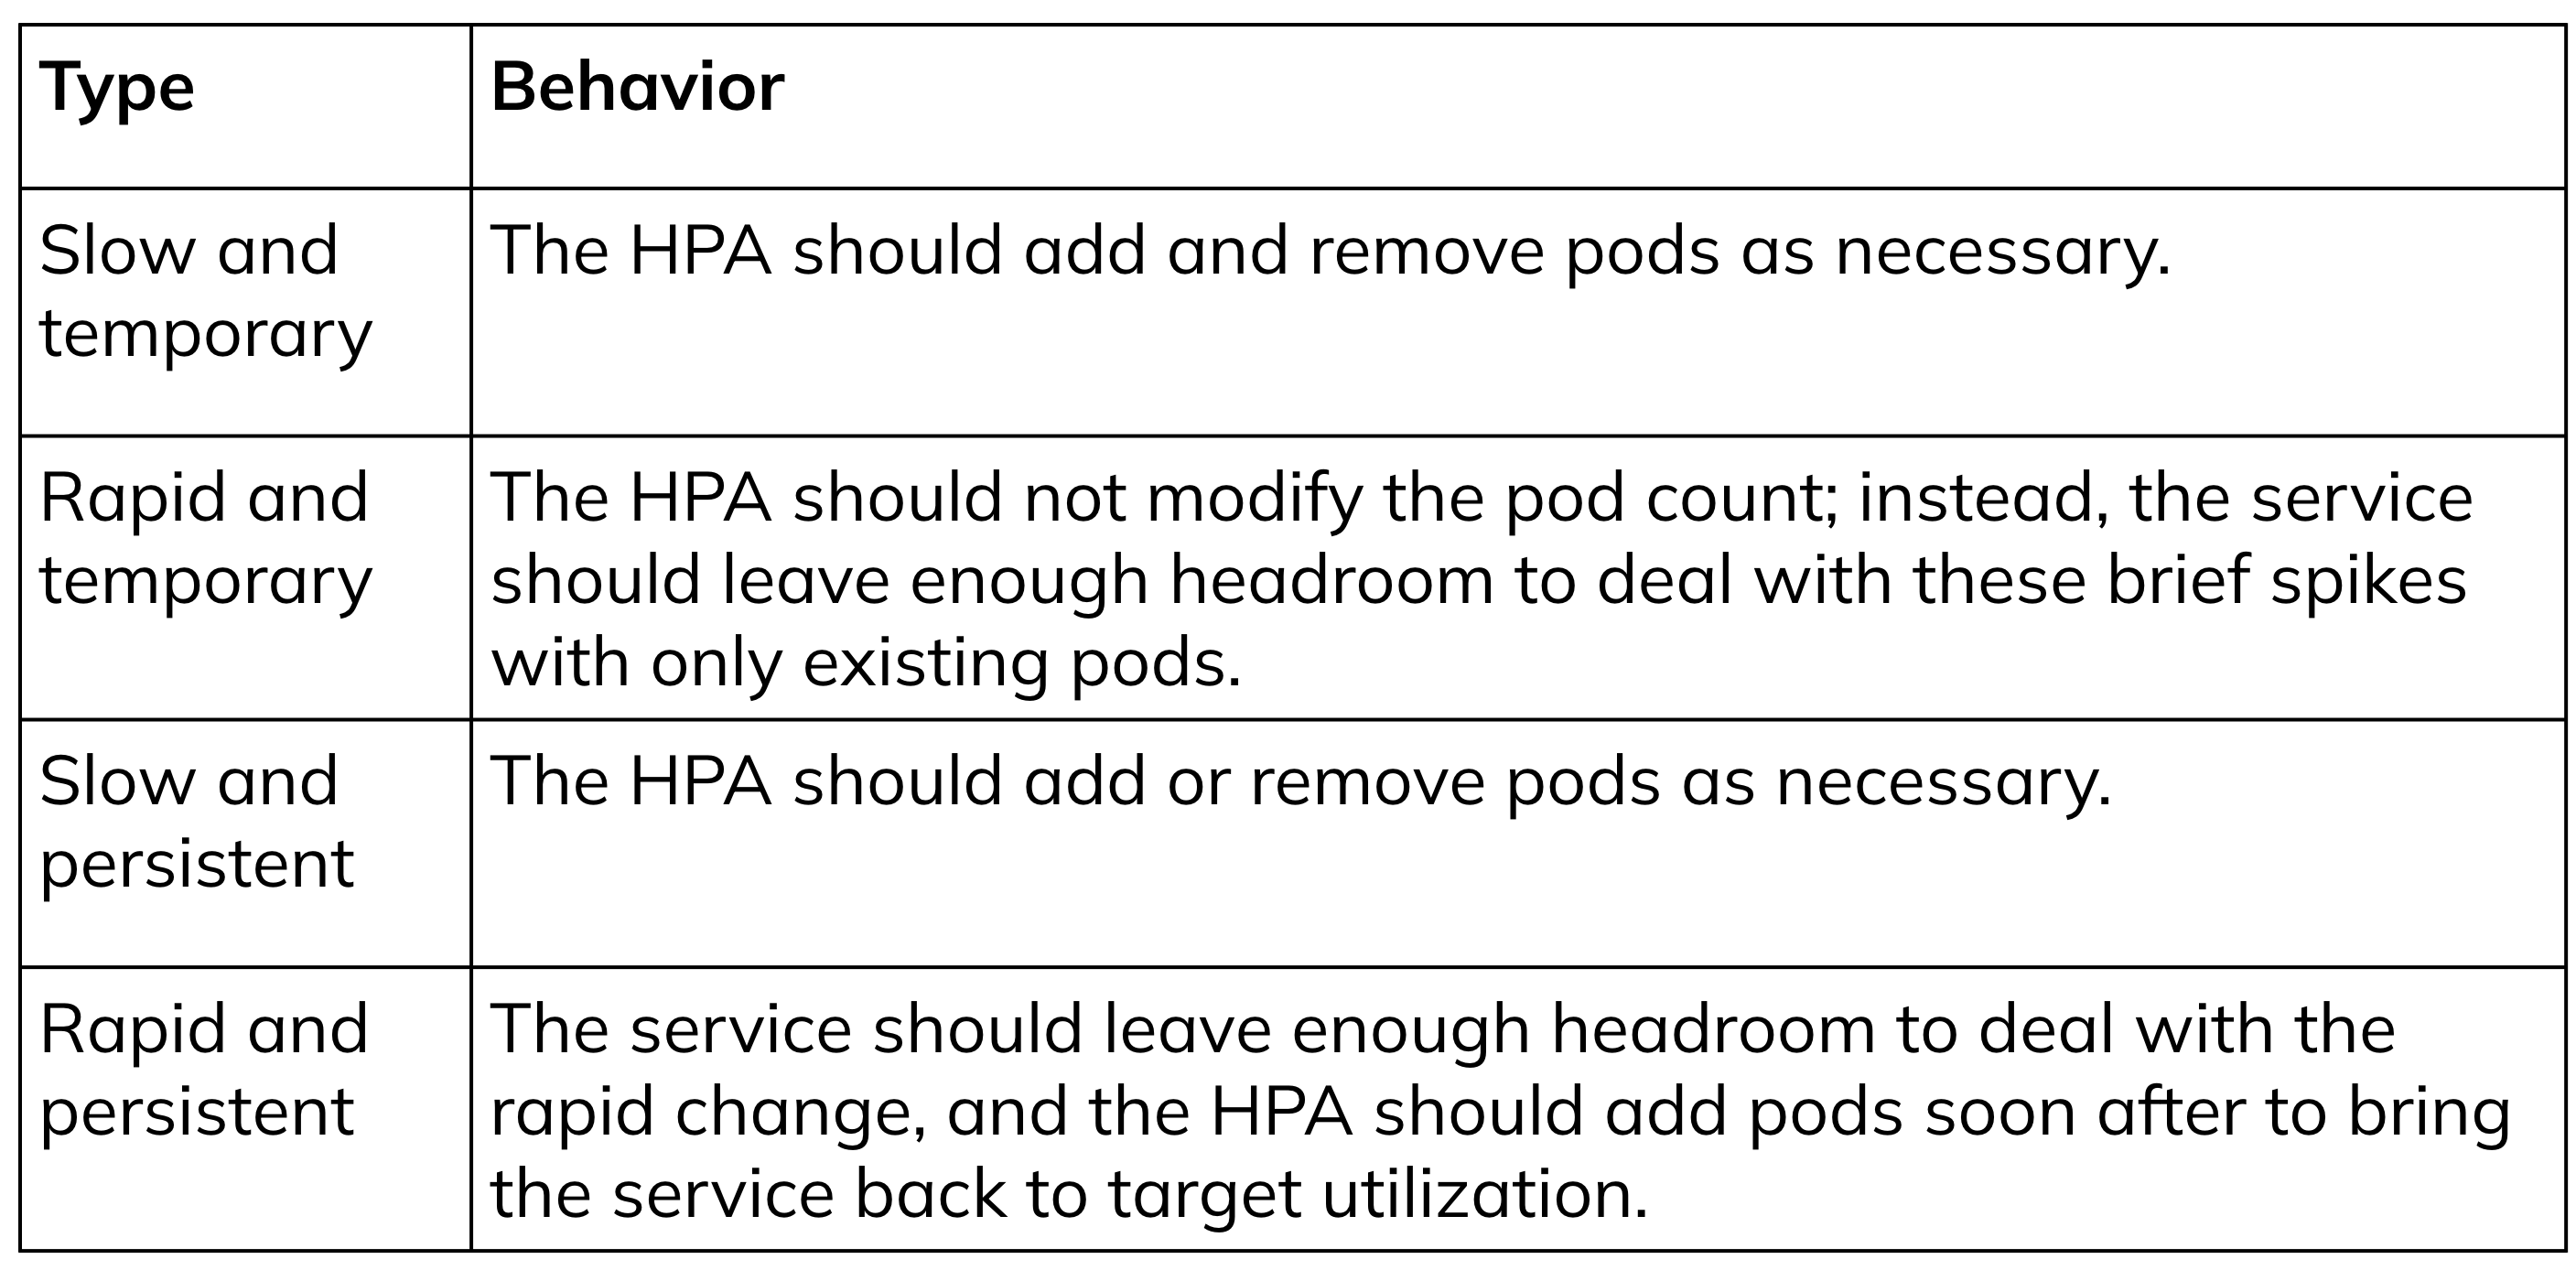
To take advantage of the v2beta2 options, you have to understand how your service’s workload varies in its typical operation. You can think of the overall variation as a combination of the following types of variations:
