Tracking Meaningful Security Product Metrics
Meaningful security metrics demonstrate that your security organization is mitigating risk and driving sales.
By Leif Dreizler
Meaningful security metrics demonstrate that your security organization is mitigating risk and driving sales.
Many security teams struggle to quantify and demonstrate the value that they bring to their company. There are a lot of complex reasons behind this, but I think a lot of it boils down to “the business doesn’t know enough about security” and “security doesn’t know enough about the business.” Luckily, being the savvy security practitioner that you are, these are both things that you can change. Unfortunately, like pretty much every other fundamental problem in security, it’s harder than it sounds.
I think one area that really stands out is the difficulty many security organizations have tracking meaningful metrics. Security metrics are hard.
The right metrics empower teams to communicate cross-functionally, and help educate other departments about what’s important and how things are getting better (or worse) over time. As a security leader you may also be able to show new metrics that demonstrate that your organization is not only mitigating risk, but also helping drive sales. This will make your security org quite a bit more popular with go-to-market folks and business-minded engineering leaders.
This type of thinking helps you break people out of the “security is a cost center” mindset. Demonstrating that you’re helping the company's top line helps get you more funding for next year, or in today’s economy–protect what you already have.
Let’s jump into some ideas about how you can supercharge your security metrics.
I think context is important, so here’s a brief summary of what our team works on. We are the Security Features Team and our primary focus is user and API authentication for the Segment application, maintenance and enhancement of Access Service (an internal tool that facilitates time-based, peer-reviewed access), and some tooling that helps keep our company’s own use of the Segment product safe.
You can think of us as a team of software engineers within the security organization that work on customer-facing security features (SSO, MFA, SCIM, etc.) and internal tools.
Being responsible for product engineering work makes tracking metrics a bit easier than it is for many other teams within security, and some of the learnings may sound obvious to engineering leaders and experienced engineers, but I am hopeful that people from these groups will still find the rest of the blog interesting and useful.
Throughout the rest of the post, I’ll walk through our metrics journey using tangible examples. Hopefully you can generalize these concepts and apply them to your own team.
Creating a robust system to track metrics is time-consuming.
Hopefully after reading the introduction you’re already somewhat bought into the idea that tracking metrics is important. But, as with any meaningfully-sized project, you should also be asking “is this the right thing to work on right now?” Folks across Twilio have no shortage of good ideas, far too many to build and maintain, and the engineers on my team are no exception. After all, they could’ve spent this time building new things for customers or improving our internal tooling that engineers depend on.
In addition to the higher-level goals discussed above, we also ran into a few problems that emphasized the need for this work:
The Access Service Database hit 100% utilization during a migration and we didn’t realize it until the service crashed and we reviewed the logs to understand what happened
There was a semi-important scheduled task that stopped running, and it took us a couple weeks to realize
There were a few engineering projects that were hampered by insufficient instrumentation
Our team had already baked time into our yearly plan to overhaul our metrics, but these challenges gave us the push we needed to prioritize a major investment in both health and product metrics.
You can think of health metrics as things that help determine if the service is stable, performant, and maintainable, and product metrics as ways to demonstrate the value the service provides to the organization and its customers (internal and/or external).
This was a major investment by our team. The project was completed by two engineers working part-time for three months.
Thousands of internal and external customers rely on the services that our team maintains. We want to run these critical services in a reliable way and also feel more confident in future planning efforts.
Certain types of engineers love to work on upgrades, refactoring, etc. Sometimes it can be hard to justify this work when you have customers clamoring for new features to solve their problems.
Metrics can make justifying investment in the refactoring easier, you have the data to say “loading this page takes 5 seconds, and web standards recommend a maximum load time of 1 second, or else users feel like they’re being slowed down. This is an internal tool, so maybe 2-3 seconds is ok, but 5 seconds is way too long. Let's shoot for a 50% reduction.”
Maybe you do some analysis and you think that this is possible in 2 weeks. You look at your other priorities and you decide that this is a project you can tackle right now. Or, maybe you decide it isn’t possible until next quarter and internal folks will just have to put up with the load times a bit longer. Either way you have data and an estimated amount of effort, which makes whatever you decide to do more defensible.
Without tracking, project planning and reporting on your progress is much more gut feel. Sometimes this is ok, but data can really drive home the impact of your work.
Without tracking and metrics:
Access Service felt slow so we sped it up by rewriting some backend queries!
With tracking and metrics:
Prior to the “speed-up Access Service project,” the average page load time was 4.8 seconds. The average load time is now 2.2 seconds, a 55% decrease.
Like any project of a reasonable size, you need a plan. For a project like this, you need to know what your team is responsible for (hopefully you already know this), the current state, and some idea of what you want your metrics program to look like. It’s okay if you don’t know everything you want to track, you’ll come up with things along the way!
The information gathering and plan writing took a couple weeks. We own a variety of services and features. Some were originally built by people no longer at the company, some built by us when we knew less about building services, and some built with the best-practices of the time, but are no longer using the recommended tool sets for Segment engineers.
The health metrics were pretty standard across services. We wanted to send errors to Sentry, send observability data to Datadog, and use Segment’s standard logging infrastructure. Any problems should be surfaced to the team via Slack.
Product metrics naturally differ from service to service as they are based on the service’s purpose, but we wanted to be able to clearly articulate “what value does this service provide?” so that we can track improvements over time, or at the very least, rationalize the maintenance costs.
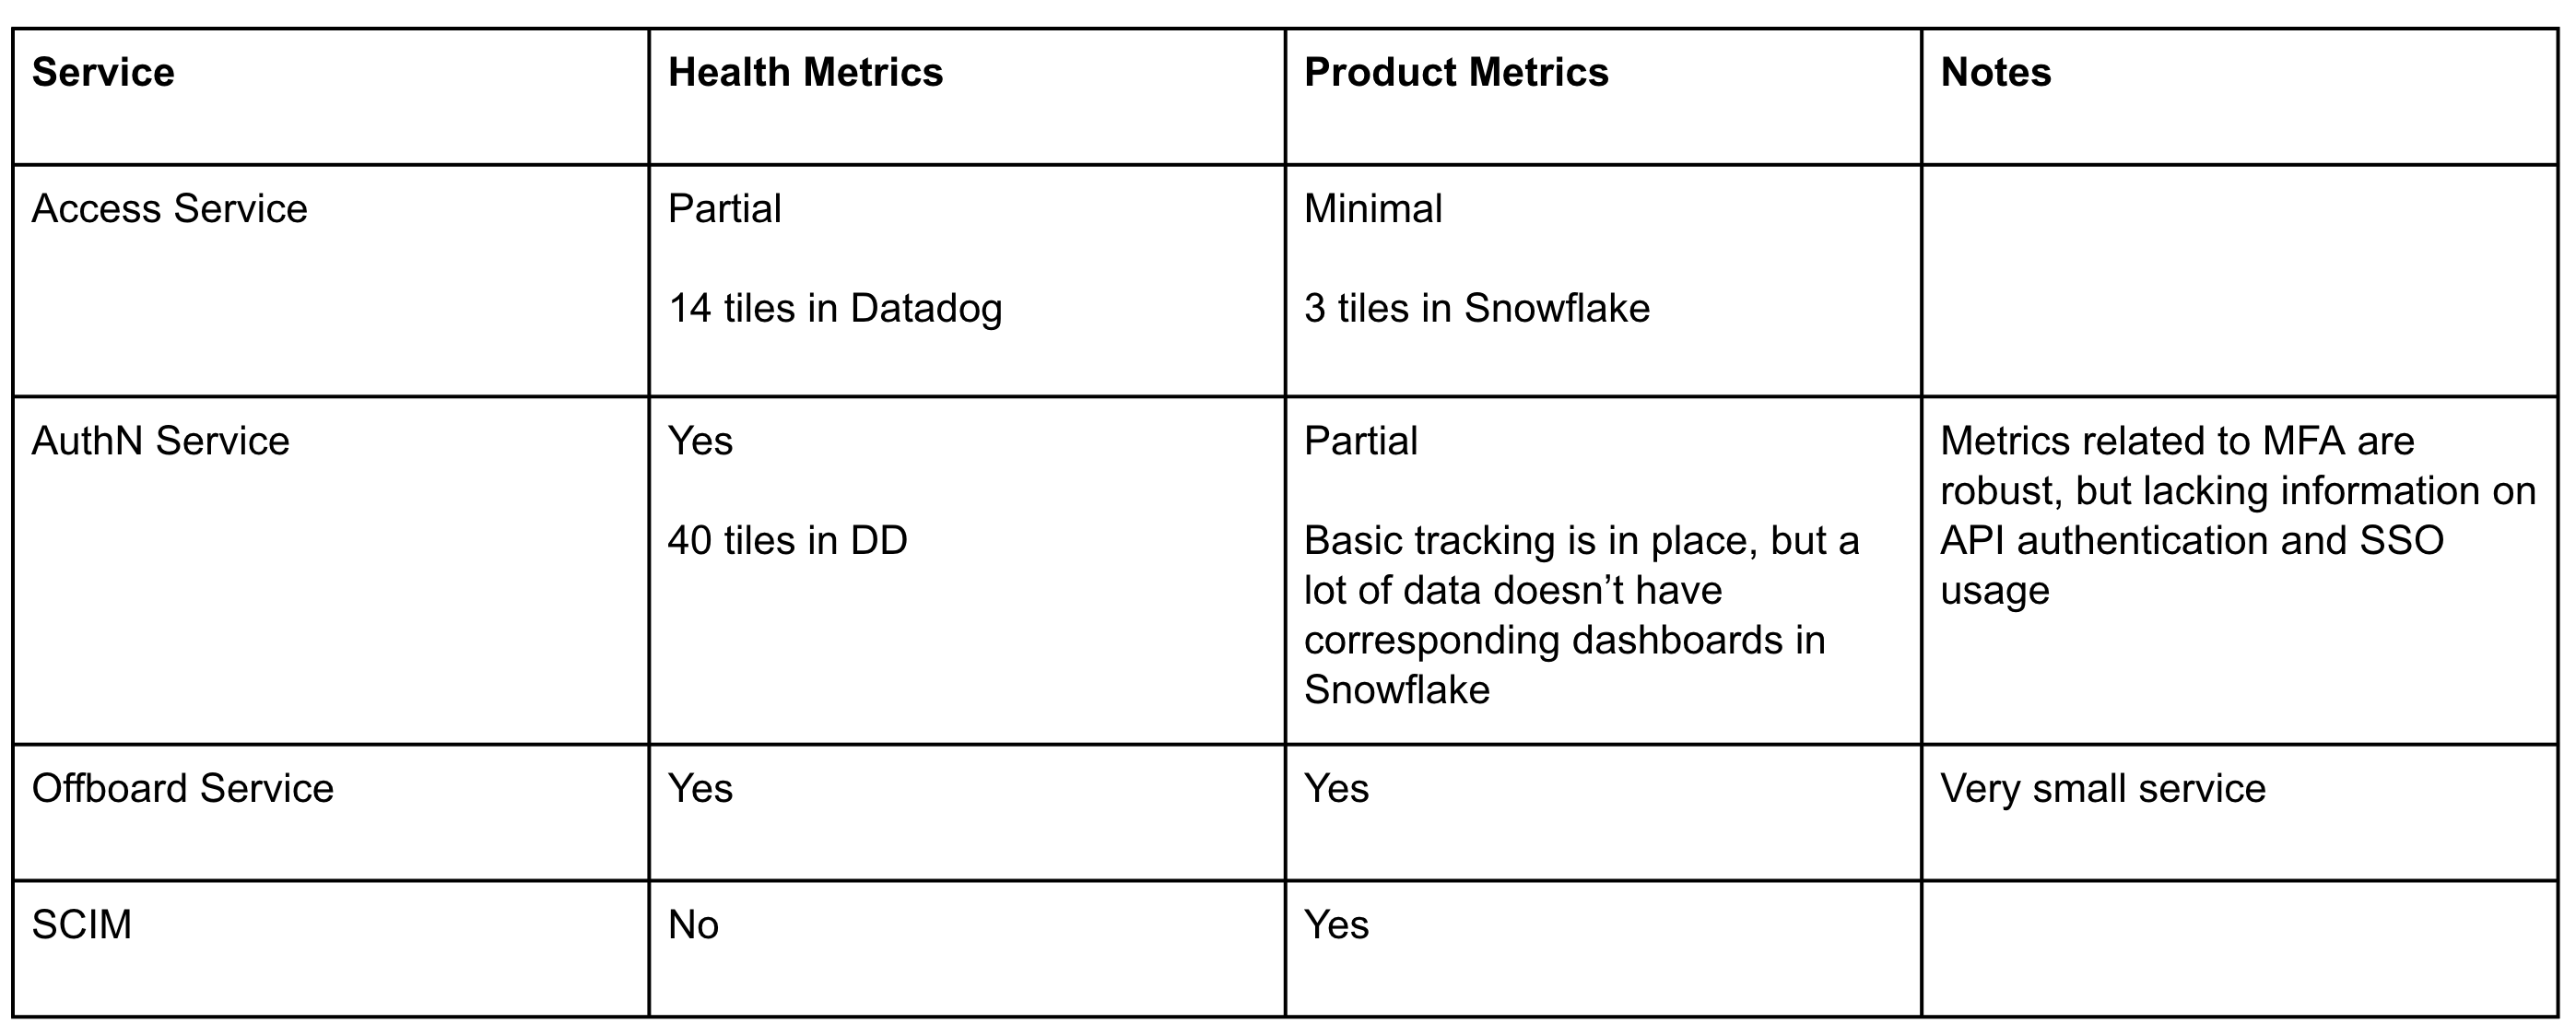
We created a spreadsheet to document the current state of all of our services. Here’s an example of what this might look like:
I strongly recommend looking at what other teams at your company are doing in this area. There are probably some really great things you can steal. I think that security teams should strive to be similar to their engineering counterparts, and this is a great time to copy their homework. If you feel like your team has health and monitoring dialed in, feel free to jump to the next section.
Here’s a few things we improved:
Standardized our error-handling by routing everything through Sentry to Slack. Some services would send errors to Sentry, but they weren’t hooked up to Slack. Some services would bypass Sentry and send errors directly to Slack.
Not forwarding errors from Sentry to Slack meant we’d miss errors or not notice them until later. Bypassing Sentry meant we’d lose out on longer-term tracking as well as Sentry’s helpful stack-tracing. It is a lot easier to justify fixing an error when you can easily determine that this has occurred X times in a given week or month.
If your team consumes errors via Slack, I highly recommend creating separate channels for production and staging. This allows people to tune their notifications accordingly.
Some of our services run on a schedule. At the end of each run, we send a stat to Datadog. If Datadog doesn’t see that the cron completed, we get an alert via Slack. This protects you from a situation where the cron stops running and you don’t notice.
These aren’t really metrics, but they fit in the generally maintainability theme, so we put them in this section. This could be things like making sure the readme has links to the relevant dashboards and local installation instructions, the service is registered in Backstage, and other things that make the service easier to look after.
Here’s an example from the smallest service we own, offboard-service. This service gets a list of deactivated users from our Okta instance, and suspends their accounts in the Segment app. This prevents ex-employees from accessing their accounts.
Some things we would track:
Does Datadog think the cron ran today in production and staging? No? Alert us via Slack
Did it encounter any errors in production or staging? Yes? Alert us via Slack
How long did it take for the cron to run?
How many calls did it make to the Okta API?
Does it have a well-written Readme, and is it claimed in Backstage?
This is the fun part. You get to put on your product manager hat and think about what indicators of success you want to track. Every service your team owns should have at least one product metric. If you can’t come up with one, that might be a sign you should build something else or retire a service if it is already built.
For offboard-service, we would track “number of users off-boarded per day,” which we could aggregate to show the lifetime value of the service, if needed.
For better or worse, part of everyone’s job is marketing. Having even basic numbers really makes your work stand out during quarterly check-ins, performance reviews, or on your resume.
“Built offboard-service, which removes ex-employees from the Segment app” 😴
Boring. Let’s supercharge this ⚡️
“Designed and implemented offboard-service. This service helps retain customer trust, compliance with our internal policies, and helps maintain our SOC2 certification. In the first 30 days it off-boarded 150 ex-employees, 120 of which were missed by previous manual reviews.”
If you have any data around how long the previous manual process took, you can multiply that by the number of users off-boarded and add that to your blurb. If you don’t have data, go through the manual off-boarding steps a few times and time yourself. The data doesn’t have to be perfect, an estimate is totally fine.
If you’re a manager, I strongly encourage you to help your team think in this way and make it part of the standard project delivery process. It will make it a lot easier to show the value of your team and get folks promoted.
Coming up with product metrics might feel a little foreign if it isn’t something you’ve done before. I promise it’s worth it and it gets easier over time. If your product and engineering teams already have dashboards, look at those for inspiration. You can also try to book some time with folks at your company that excel at this type of work and they can share their superpowers 🦸🏾♀️
Customer annual recurring revenue (ARR) associated with a feature
% or total number of customers using a feature
Weekly users of feature or internal tool
Number of times a tool completed a task
While I can’t share the real numbers, here are some hypothetical numbers that illustrate an observation that we had:
Your company has 100 million in ARR
30% of your customers have SSO enabled
60 million ARR has SSO enabled
At first this might seem like a mistake, but after thinking about the information, it makes sense. Taking a look at our customer base, we found that customers with a higher contract value (who are likely to be larger companies) are more likely to mandate SSO usage with their vendors.
We see a similar data point for SCIM. Since SSO is a prerequisite for SCIM, the usage was lower, but had an even higher outsized allocation of revenue. Expanding off the above example:
10% of your customers have SCIM enabled
25 million ARR has SCIM enabled
Always tie metrics to customer ARR when available. This type of thinking helps you break people out of the “security is a cost center” mindset.
Once you have a knack for this kind of work, the common metrics will come naturally. The fun part is coming up with the metrics that are unique to your projects.
For many of the problems you solve, metrics like customer ARR, total usage numbers, or adoption over time will sufficiently demonstrate the value. But sometimes you’ll want to go beyond the fundamentals. In these cases you’ll need to dig a little bit deeper.
Access Service
We’ll use Access Service as an example. As mentioned earlier, Access Service facilitates time-based, peer-reviewed access to various AWS roles, support tooling, and SaaS apps. Segment employees can visit Access Service, find the access they need and request said access for a limited amount of time. An approver will be notified via Slack, they’ll approve the access, and the requestor will have a new tile added to their Okta account.
Here are some bespoke product metrics we track for access service:
Number of tiles (a tile is an Okta app or group in Access Service)
Number of tiles with less than 3 approvers
Number of tiles with 0 requests in the last 3, 6, or 12 months
Cumulative requests per day
Median approval time
Most active requestors/approvers
Emergency access requests/week
SSO Usage
Here’s another example from our SSO implementation, which is supported by Auth0. We pulled data from the Auth0 API to see which were the most popular Identity Providers (IdP) amongst our customers. After collecting this data, we built integrations with the top three IdPs. We periodically review this data to see if we need to build a new integration with an additional IdP.
Hopefully you already have other teams at your company that are tracking this type of data and have built dashboards. If that’s the case, try to hitch your team to their wagon. It will be significantly easier than blazing a trail yourself.
At Twilio Segment we are incredibly fortunate to have world-class data engineering and analytics teams that set up a lot of this infrastructure years prior. A lot of the important patterns already existed. For example, there were already queries available to tie a customer workspace to a Salesforce account which includes the customer’s ARR.
In addition to the building blocks that already existed, members of these teams have been incredibly helpful along the way. The work that my team completed earlier this year would not have been possible without standing on the shoulders of these giants.
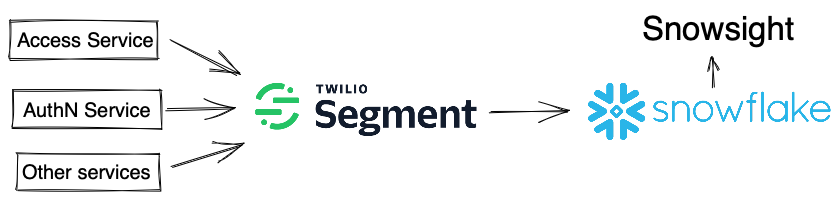
Another huge advantage we have is access to the Segment product–a tool purpose-built to help you answer these types of questions. It’s incredibly easy to send new data through Segment to Snowflake and build dashboards using Snowsight–Snowflake’s Business Intelligence (BI) tool. A BI tool makes creating new dashboards simple, and it should have some nice enhancements like trivial creation of time-series data. This will help you track something like “MFA adoption over time.”
I feel incredibly fortunate to work at a company where so many people know how to use the product. It is a huge advantage if you’re your own customer. A lot of security teams are too removed from the products they support. Understanding the technical and business context in which things were built makes your recommendations significantly more relevant. Thankfully everyone on our team has direct experience with Segment.
If your team has never used BI tools before, start by looking at queries built by other teams. There should be some foundational metrics you can look at and adapt for your purposes.
Similar to documenting your code, document your SQL! This will make revisiting your queries easier in the future, and will make your work easier to share. Other teams within security have borrowed queries from our dashboards to fast track their own metrics.
For complex queries I recommend breaking them down into sub-queries. Creating separate dashboards to store common building blocks will make your dashboards easier to verify and easier for other people to adapt for their needs.
Let’s assume you’ve read the blog, and you’re sold on the idea of dedicating time to this type of work. You follow our recommendation and start by figuring out the current state of all your services. You determine the metrics you want to track, the team executes on the plan, and everything goes off without a hitch!
As part of your retrospective, compare the current state to the initial state! Here’s an example of what your meta metrics might look like:
Before:
100% of services are sending observability data to Datadog
20% of services are sending errors to Sentry
40% of services have at least one product metric in Snowsight
0% of customer-facing services are tied to ARR
50% of internal tools track monthly active users
After:
100% of owned services are sending errors to Sentry, observability data to Datadog, and have at least one product metric in Snowsight
100% of customer-facing services are tied to ARR
100% of internal tools track monthly active users
Pick a few of your favorite dashboards and metrics and share these within your company. This could be posted in a Slack channel, presented during an all hands, or shown off during team demos. Make it easy for others to review the documentation you created along the way.
Now that you have all this useful information, it’s time to use it! In addition to using it to beef up quarterly reports and promotion cases, you should also be using it in planning and roadmapping.
For example, maybe you know that 20% of your most valuable customers use a feature. You can use this data to advocate for your team to have the appropriate resources to maintain a stable deployment next year.
Maybe you’ve noticed that an internal tool is waning in popularity, but it takes a lot of internal resources to keep it running. You might consider making the case to decommission the tool.
Product metrics (e.g. customer ARR) can inform how much time should be allocated to improving health metrics (e.g. service uptime). It is much easier to advocate for time spent on maintenance tasks when you have the data to show the importance of a service.
Before we start on a new project, we create a software design document (SDD). As part of all SDDs we list at least one product metric and outline the relevant health metrics that need to be tracked. This work is included in the work breakdown structure (WBS). Unfortunately, creating dashboards to track product metrics is one of the last stages of the project, since you need data to create the dashboards. This puts them at risk of being skipped, especially when the project is already late, and folks are asking your team to start on whatever is next. Adding this task to the WBS helps protect this step, and lets folks know the project isn’t done until the dashboards are completed.
It’s never too early in your career to start thinking about metrics
Last summer we had a phenomenal intern join our team. She built a new flow in the Segment application that encourages workspace owners to require all users of their workspace to enable MFA. This alone would’ve been a successful project for an intern.
But, she went the extra mile, instrumented tracking using Segment’s analytics library, sent the data to Snowflake, and built some dashboards to show the activation rate. This work was baked into her original project plan.
Without metrics:
Successfully completed internship assignment to encourage Segment workspace owners to enable MFA.
With metrics:
Implemented a new flow in the Segment application that encourages workspace owners to require MFA. This resulted in a 25% increase in workspaces using the “force MFA” option, and impacted more than 50,000 users.
The more your company knows about security and the more you know about your company, the easier your job will be as a security practitioner. Metrics are an effective way to communicate cross-functionally and educate the rest of the business about what’s important. Metrics can help your organization demonstrate that you are both mitigating risk, while also helping drive revenue growth. A really simple, but powerful, metric we track is “customer ARR associated with SOC2 report requests.” Maintaining our SOC2 report is incredibly important to our customers.
Metrics make your team stand out during quarterly progress reports, have the ability to supercharge performance reviews, and aid in future planning efforts.
If you’d like to replicate what I’ve described in this blog post, Segment and Snowflake both have free trials and tons of resources about how to get started. Show your company the value your security organization is providing to the business!
If this type of data-driven engineering work is exciting to you, please check out our jobs page!

It’s free to connect your data sources and destinations to the Segment CDP. Use one API to collect analytics data across any platform.