Bob Loblaw’s Log Blog
By Daniel Fuente
Today we’re excited to open source the various pieces of our logging pipeline. We’ve released a rate-limiting-syslog proxy, a journald fanout service, and a cloudwatch logs CLI. To understand how they work in concert, read on.
If you’re running a production system which doesn’t have logs or metrics, you’re flying blind. But if your logs are getting dropped… how does one find out?
A few months ago, this started happening to us at Segment.
It started gradually. Every few weeks, someone on the Engineering team would ping the #engineering channel and ask why they weren’t seeing log messages for a given container.
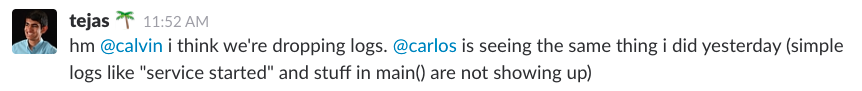
At first we thought these missing logs were the result of ephemeral failures.
But, soon, we’d start seeing containers that seemed to be working based on all of our metrics–but not logging a thing. No output in our log aggregators. Nothing in docker logs. No trace whatsoever that the program was running.
Here’s the story of how we dug through our logging pipeline, got to a root cause, and open-sourced our tooling for logging with Docker, ECS, Cloudwatch, and Go.
Before diving in, it’s worth taking a cursory look at how logging works at Segment.
Currently, we’re pushing multiple TB of log data per day into our logging pipeline. Some services log frequently with request-level information, while others contain only important audits.
In order to get good utilization, we also make heavy use of service bin-packing, often running hundreds of containers on a single host.
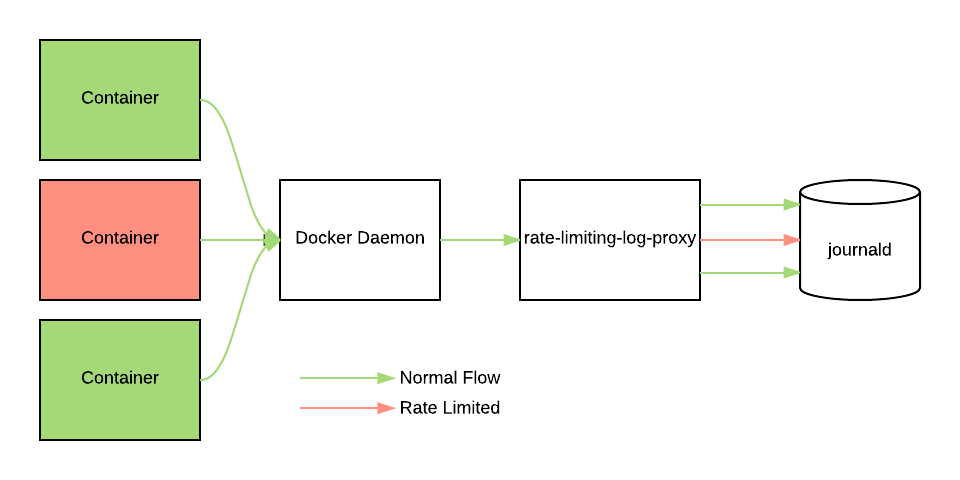
To get an idea of how our logging pipeline fits together, let’s first take a look at the high level architecture for our logging setup. Here’s the architecture diagram showing how logs propagate through a given host:
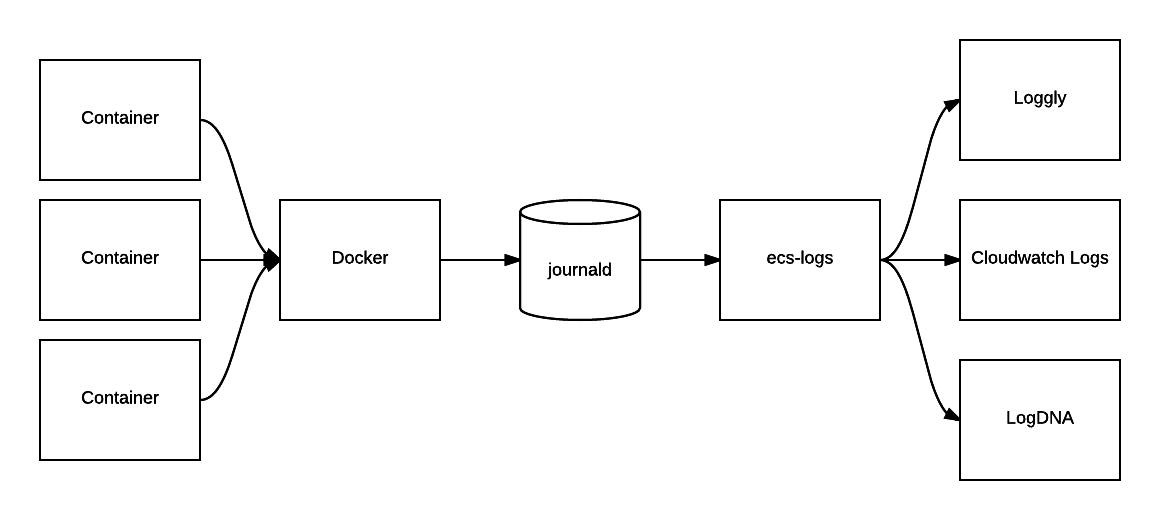
Containers run via the docker daemon are configured to log straight to journald. Journald is the default logger that ships with systemd and recent Ubuntu distributions (we use Xenial in production), and collects system-wide logs across our pipeline.
From Journald, we run a daemon on the host that tails our logs and handles our fanout to different logging providers (more on that shortly).
This design covers a few core tenets:
structured logging – clients should log structured fields to query by, not just plain text
use system-wide journald – rather than buffering in memory, we log to journald (which writes directly to disk) and then tail logs from there
multi-destination adapter – instead of coupling to a single provider, allow multi-destination log fanout (via our open-sourced ecs-logs)
Here’s what each tenet looks like in more detail:
Structured logging
At the application level, we encourage our developers to use structured logs. To make structured logging as easy as possible, we’ve created logging helper libraries for our two main languages (Go and JS) which provide consistent formatters.
For Go, we use ecs-logs-go which provides a set of logrus (or events) compatible formatters and outputs. For JS, we have ecs-logs-js which provides a logger built on winston to do the same.
By using these libraries, we ensure that logging from applications built in either language look identical.
This uniformity in log structure helps us build tooling for routing and querying logs without needing to worry about where the logs originated.
Use system-wide journald
From the application, we write our logs into journald via the journald Docker logging driver. This plays well with our structured logging approach, as journald easily allows you to do structured logging by attaching metadata to logs.
journald logs first to a local file rather than a remote server. That means if there’s a network partition or we lose instance connectivity, we can still reboot the instance and identify the root cause for the problem.
Furthermore, because journald logs information from all systemd processes, the logging tooling on a host is consistent. It preserves the behavior of journalctl <service-name> as well as docker logs <container-id>, allowing us to debug once logged into a host in the case of a complex problem.
The Docker logging driver also adds additional metadata about which specific containers logs come from, which is often very valuable debugging information. It allows us to separate the logs coming from different containers
Multi-destination adapter
Our log forwarder (ecs-logs), tails journald on each host and forwards those logs to downstream aggregators. This forwarder is also responsible for taking unstructured logs from legacy applications, or other open source applications we run, and converting them to our structured log format.
We have experimented with a few log aggregators; internally we use Loggly, LogDNA and AWS Cloudwatch Logs. Loggly and LogDNA are good for fulfilling an indexed ‘search’ use case, where you need to answer a ‘needle in the haystack’ type query.
Cloudwatch is great for tailing and auditing. Even if you persist logs indefinitely, it’s almost an order of magnitude cheaper than any other logging provider we’ve seen–and it integrates nicely with a variety of AWS tooling.
Between the three of them, we’re able to handle different use cases with different retentions, from different users inside the company.
This setup has worked well for us, but we noticed that sometimes we'd be missing a few log lines. The problem was sporadic, but affected all services on a host when it did happen.
After digging in, we managed to isolate the root cause: systemd-journal wasn’t keeping up with our logging throughput.
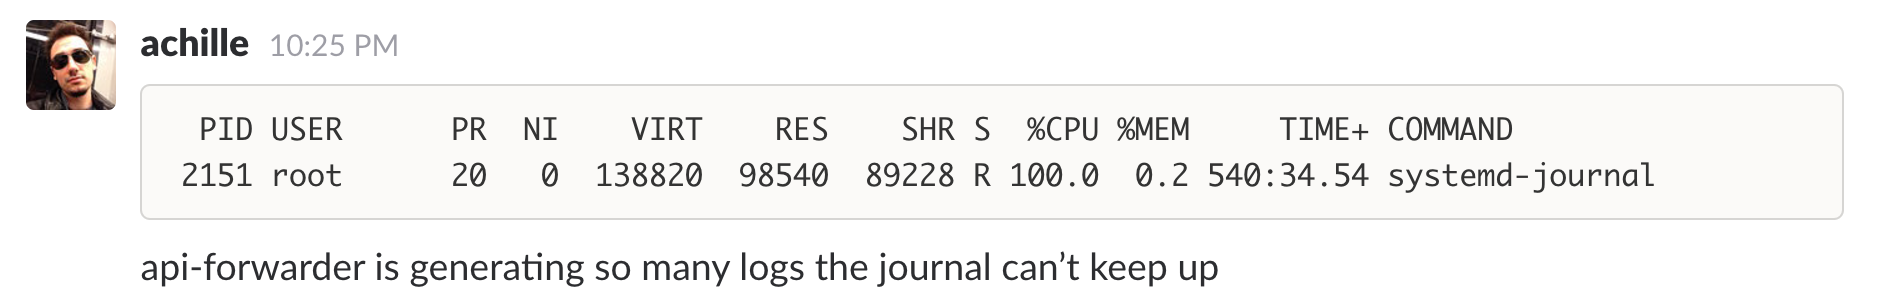
To understand what was going on, it’s worth looking at the way that journald is implemented. journald runs as a single process on each host. When set as the logging client for Docker, all logs are sent from the docker daemon directly to journald.
As we run tens or hundreds of containers on a given host, we were seeing times where a single host’s journald process would be completely CPU-bound.
Fortunately, journald allows you to set a rate limit in its configuration.
This means that for a given process, it can send the burst number of messages in the specified interval (200,000 every minute in our configuration above).
Unfortunately for us, journald applies rate limits based on systemd service, not per process.
To understand why this is an issue, know that we run all of our applications in Docker containers via ECS. Our systemd unit for docker looks like this:
We have one Docker process, run as a single systemd process. And that Docker process manages all other services running on a host.
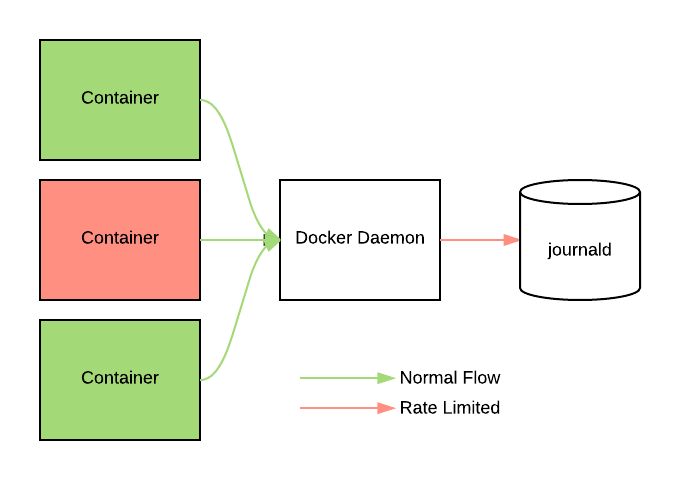
What that means is that all logs from all containers on a host come from the exact same systemd service. What’s more, these log lines are dropped silently when any process causes us to exceed the ratelimit.
With this setup, one misbehaving container on a host can cause logs from all other containers on that host to be dropped without any sort of notification whatsoever.
In order for us to be able to guarantee the same log reliability to any application running on our infrastructure, we needed a way to apply this rate limiting per container, rather than globally.
Our first thought was to apply this rate limiting at the docker logging driver level.
However, none of the docker drivers provide this capability out of the box. We could write our own logging driver, but that would mean compiling it into docker and maintaining a fork–something we didn’t want to do (note: the latest docker version has added support for dynamically loading logging drivers, which might be a possibility in the future).
Instead, we created a small proxy (rate-limiting-log-proxy) to sit between the Docker daemon and journald. This proxy presents itself as a syslog server, so that we can use the built in Docker syslog driver to forward logs to it.
The proxy is a tiny golang binary, with extremely low memory footprint and CPU overhead. You can grab it from github or install it straight from docker hub.
Once the logs have been shipped to our proxy, we use the log tag (container ID), to rate limit messages from individual containers. Messages that obey the rate limit are forwarded along to journald, while messages from noisy containers will be dropped to fit within the limit.
Here’s a detailed look at the handle method. Notice that we first pull out the message tag, then look up the container by ID to pull its full info from the Docker daemon.
After each message has been tagged, we see whether the message has exceeded the limit. If it hasn’t, we log it. The rate-limiting uses a simple token-bucket approach to drop messages.
Now, regardless of noisy neighbors, well behaving containers will always get their logs into journald (and from there, into the rest of our logging pipeline).
What’s more, instead of silently dropping log lines like the journald ratelimit does, we wanted to give developers a much bigger ‘heads up’ of when their logs are getting dropped.
If you’re logging too much, the proxy will now add the following lines to your log output:
It’s now much easier to understand where and why your logs may be getting dropped, as opposed to the silent failures we encountered earlier.
Where performance is concerned, Go performs admirably (as per usual). The log-proxy is capable of handling hundreds of thousands of messages per second, all with minimal CPU and memory overhead.
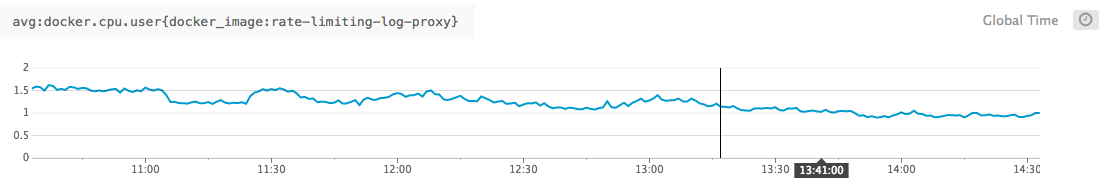
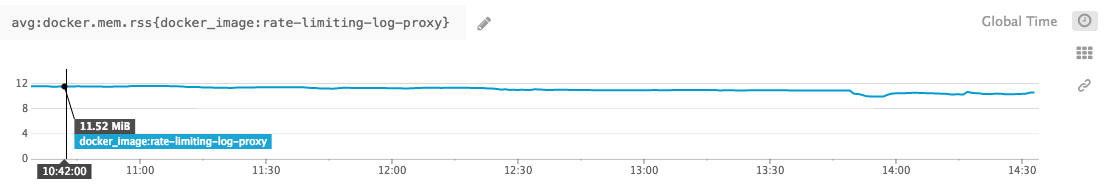
Even with hundreds of containers running on a single host, logging tens of thousands of lines per second, CPU hovers at 2-3% and memory is capped to 10mb.
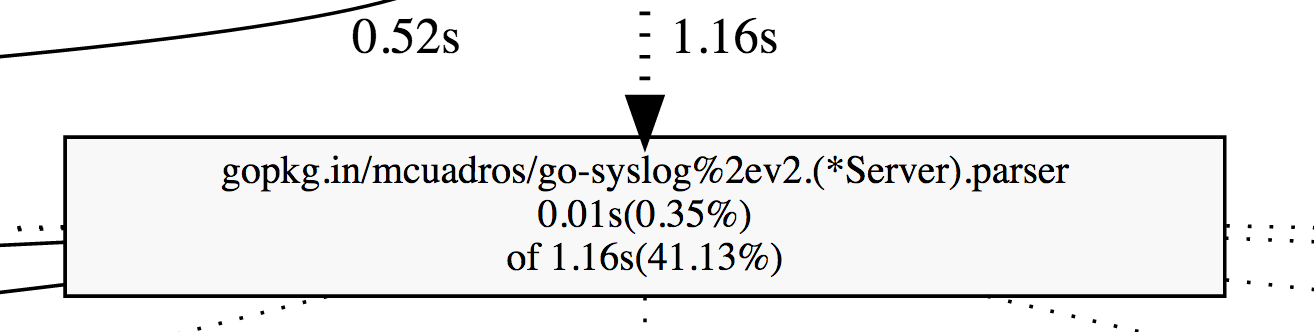
There’s still some work we could do here. From our early profiling, the majority of the CPU is being consumed by the syslog server parsing code. But this is a step which can easily be optimized.
If you’d like to use this yourself, the code is freely available on GitHub, and the docker image is runnable today via Docker Hub.
To get up and running, first run the image as a standalone syslog server, listening on a unixgram socket.
And then run the docker config for a given service to point at the proxy server:
And voila! Rate-limited logs tagged with your service and container information!
We’d successfully managed to debug where logs were being dropped, but our job wasn’t over yet. Logs aren’t actually useful until they are useable.
On that note, the biggest issues we had here were with Cloudwatch. The Cloudwatch logs UI is clunky and slow for our common use cases, and the aws-cli tool is hard to use effectively for day-to-day debugging.
To ease this process for developers, we created cwlogs, a more user-friendly CLI for accessing Cloudwatch logs.
When using the rate-limiting-proxy and ecs-logs, cloudwatch logs are grouped by “ECS service”. Within each service, individual containers log to a given “stream”. This allows you to filter either by service-wide logs, or a particular running instance of the program.
In turn, we designed cwlogs around our most common logging use cases:
Listing the available log streams for a given service
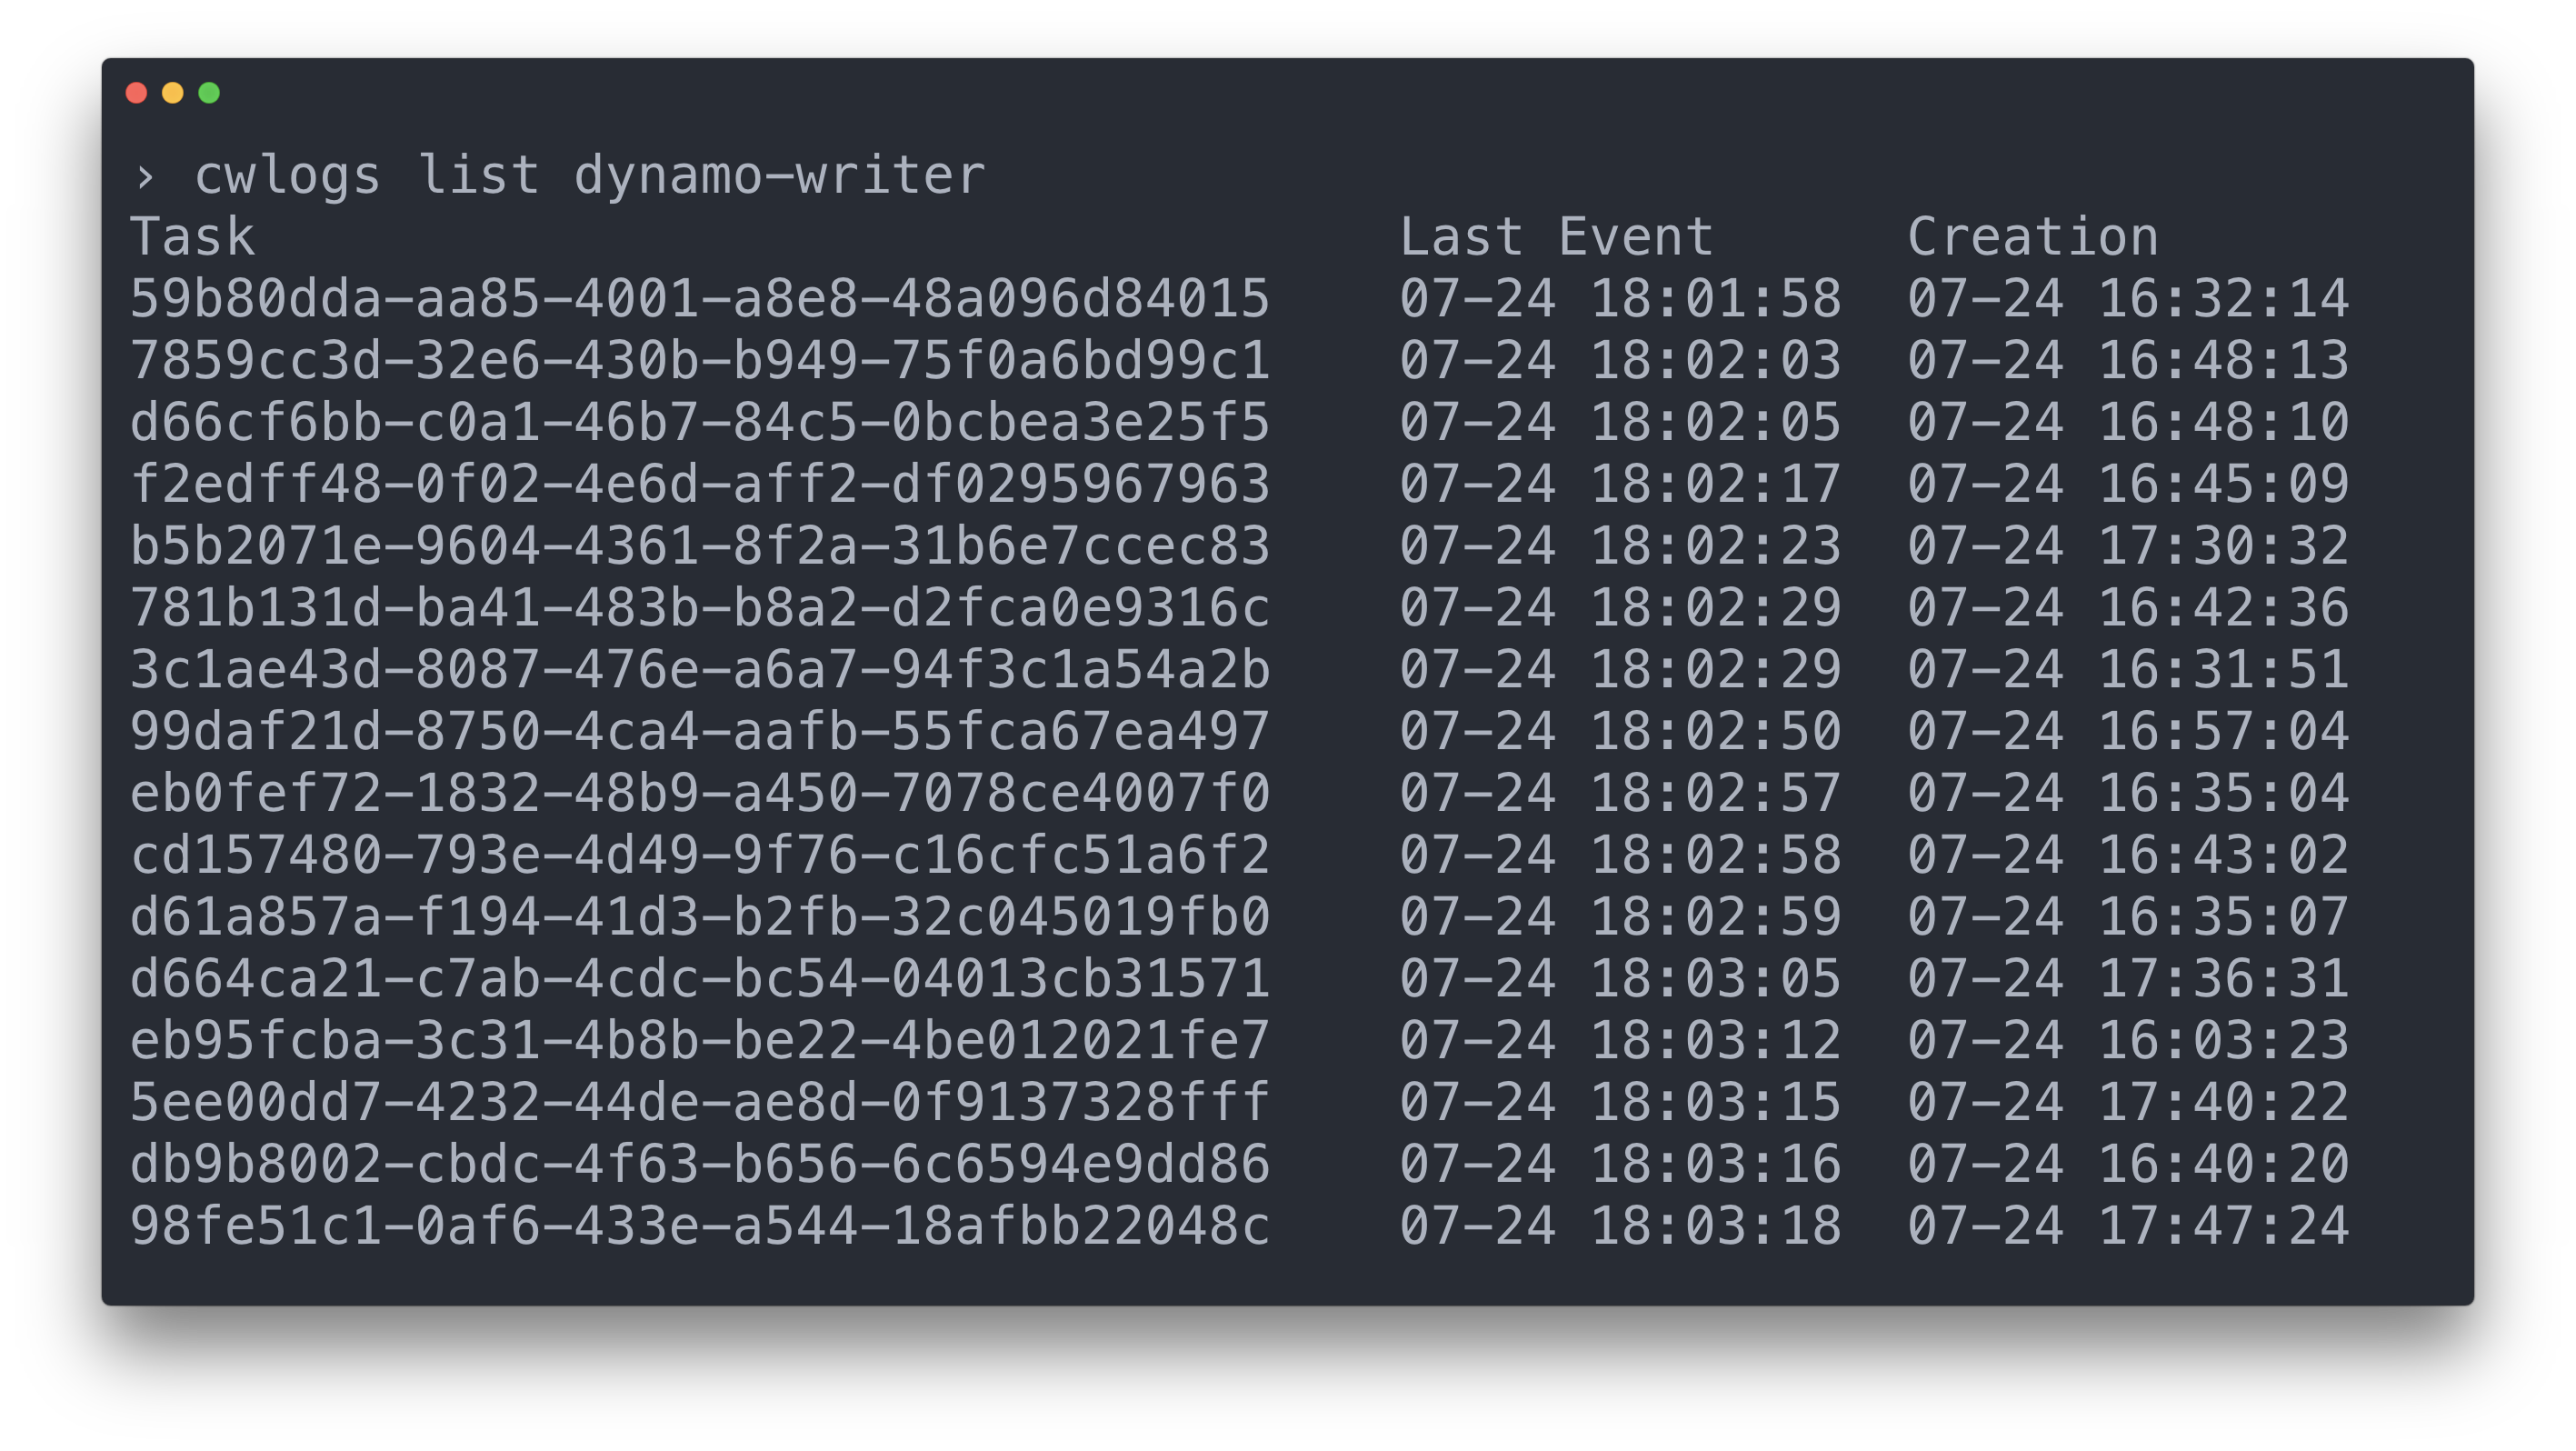
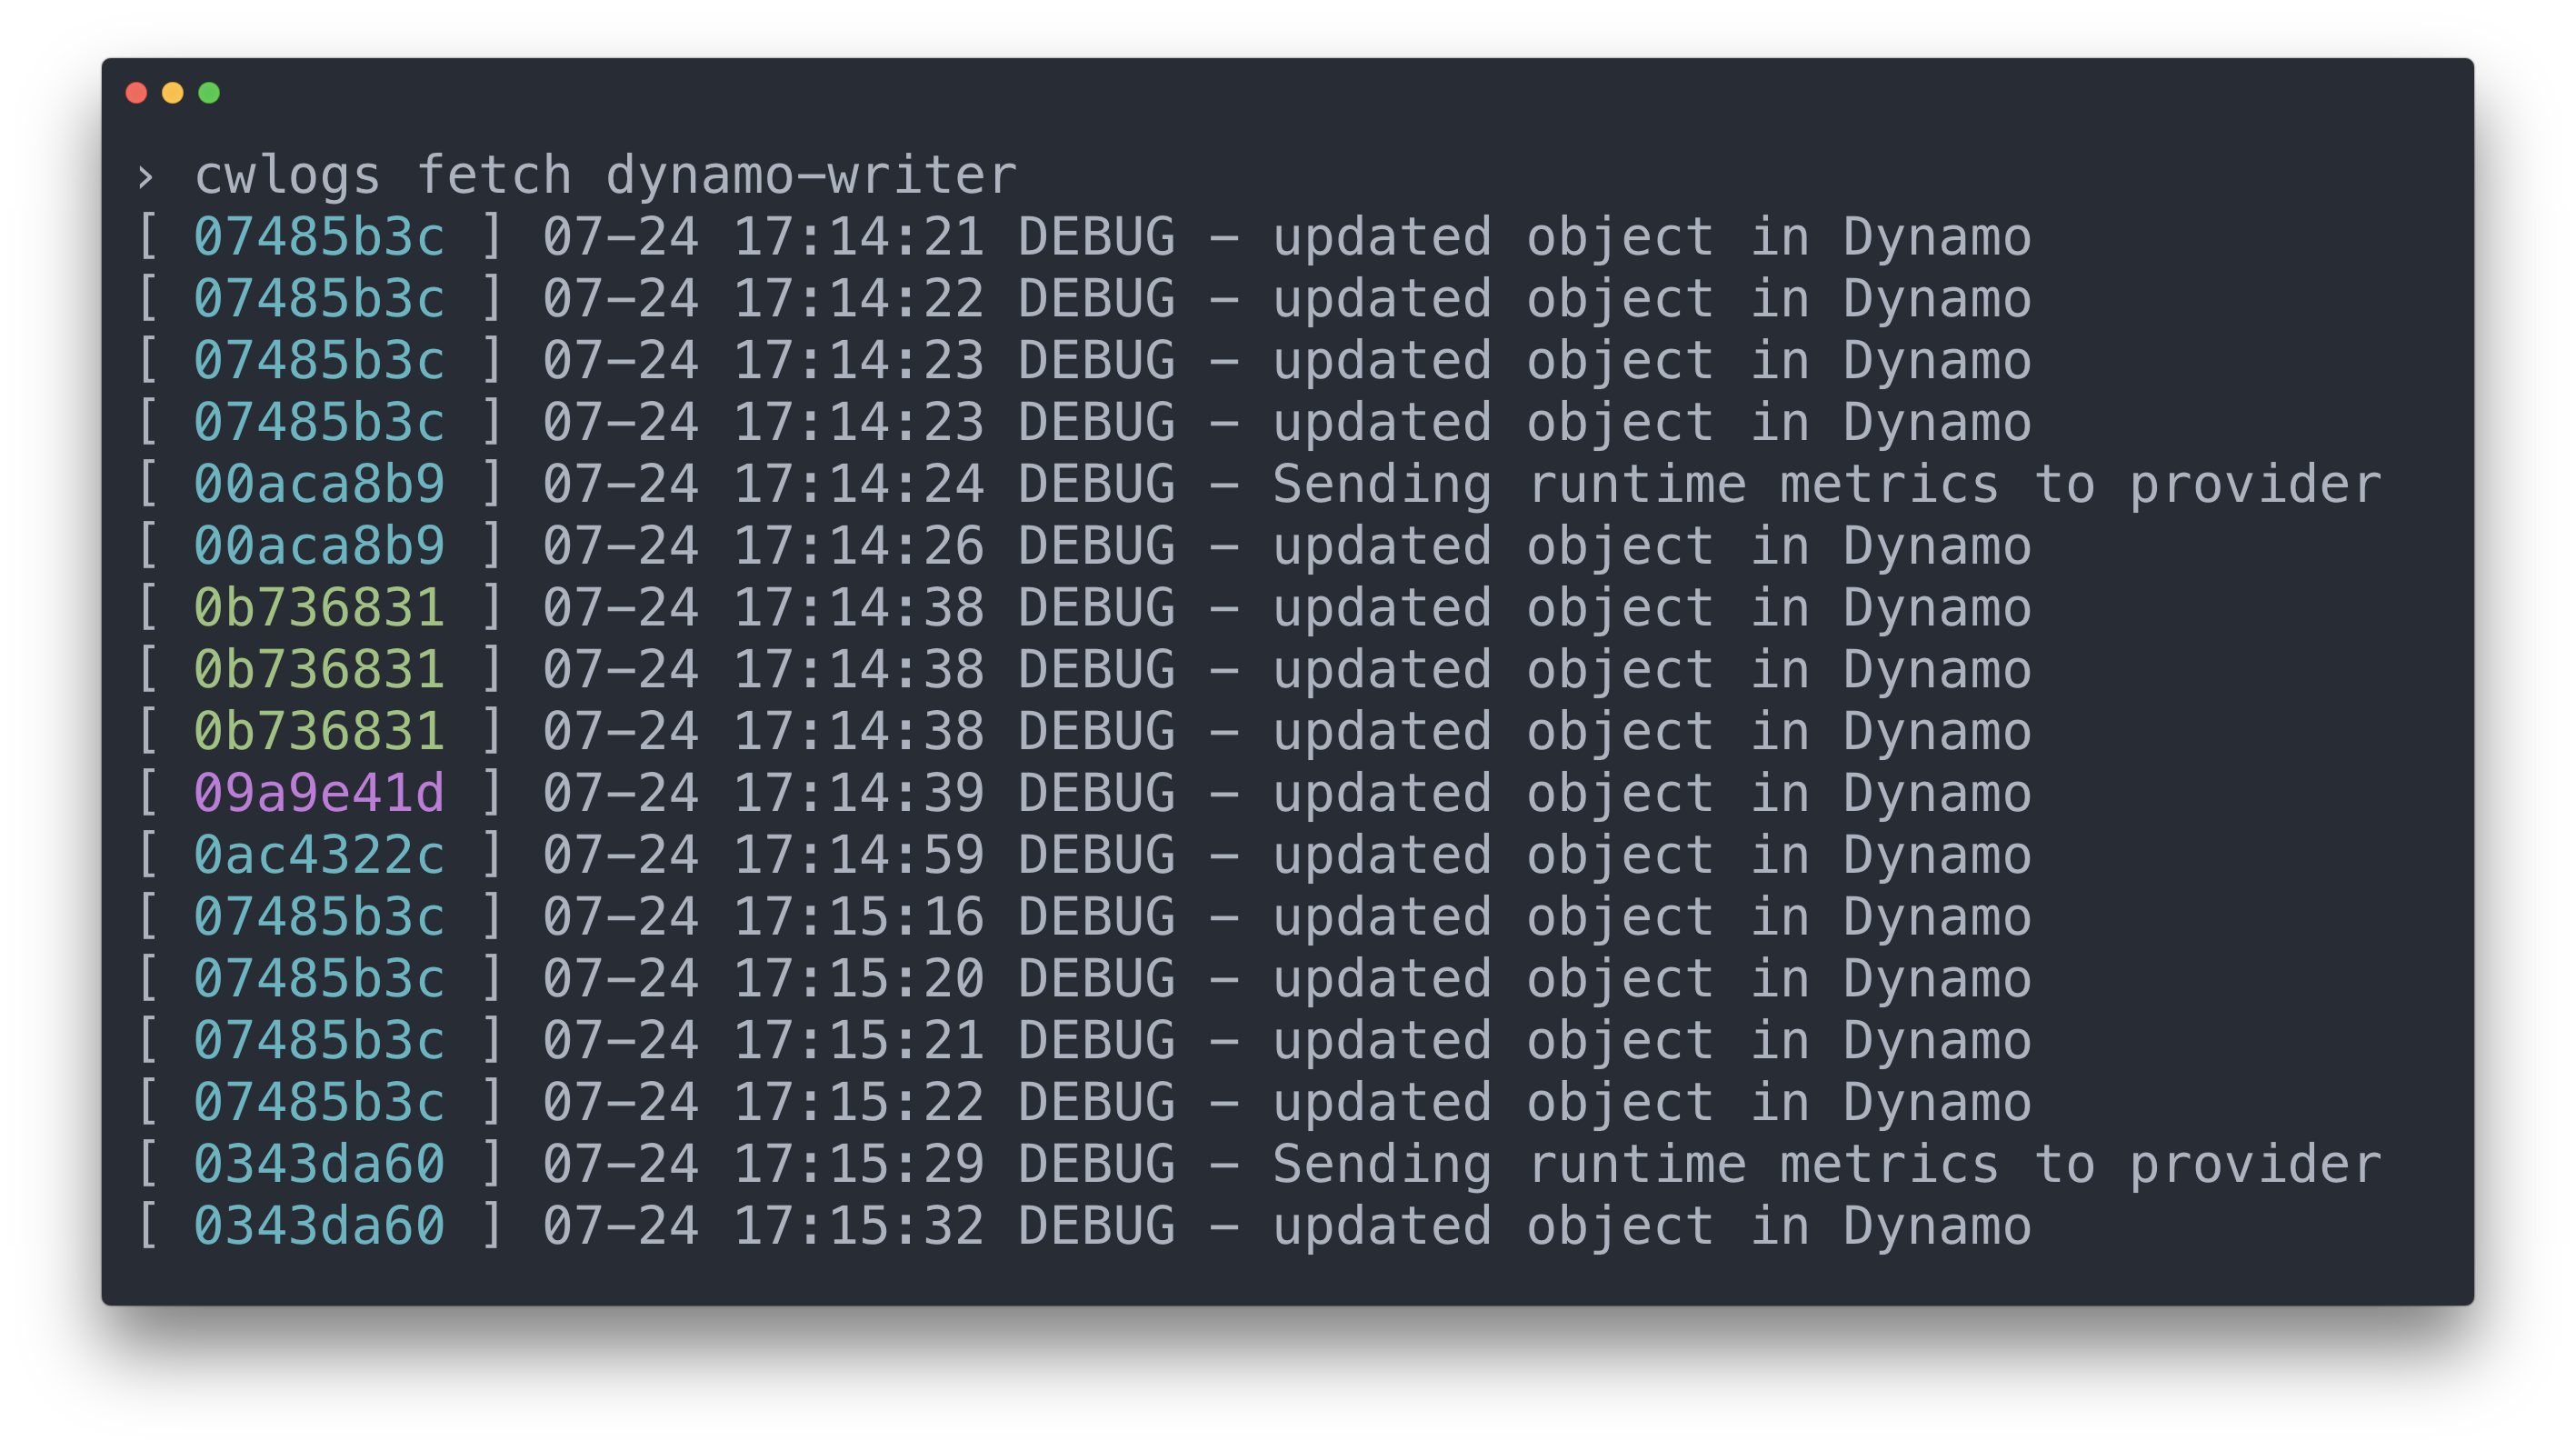
Fetching/tailing logs from a particular service
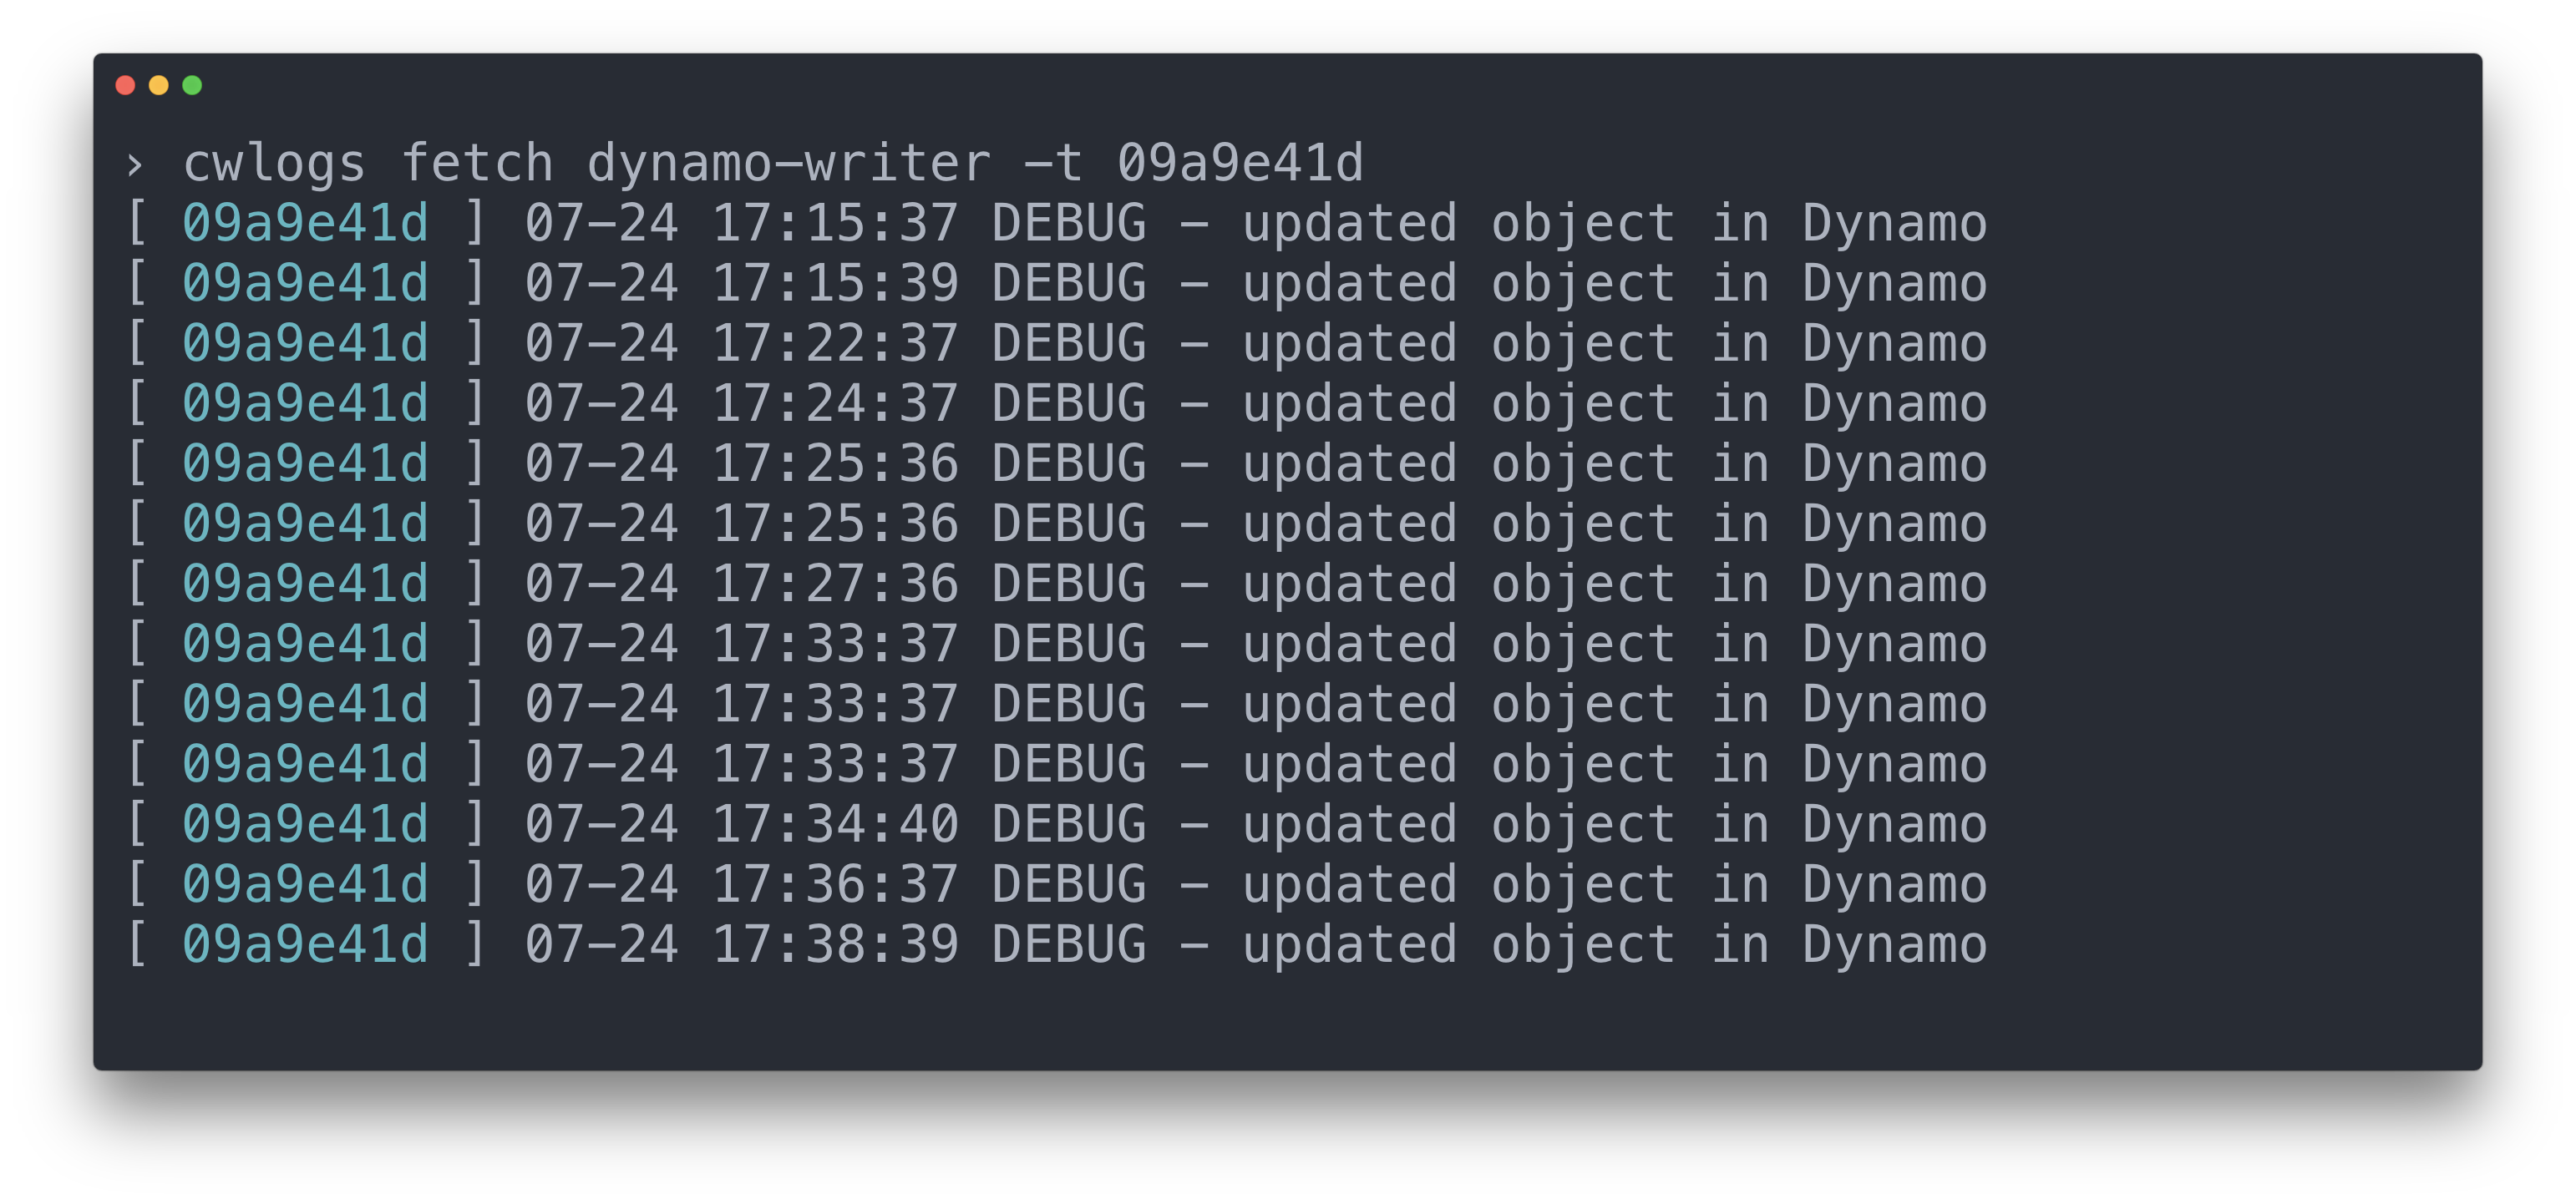
Fetching/tailing logs from a particular ECS Task (stream)
Formatting log output for analysis with common cli tooling (grep, jq, etc)
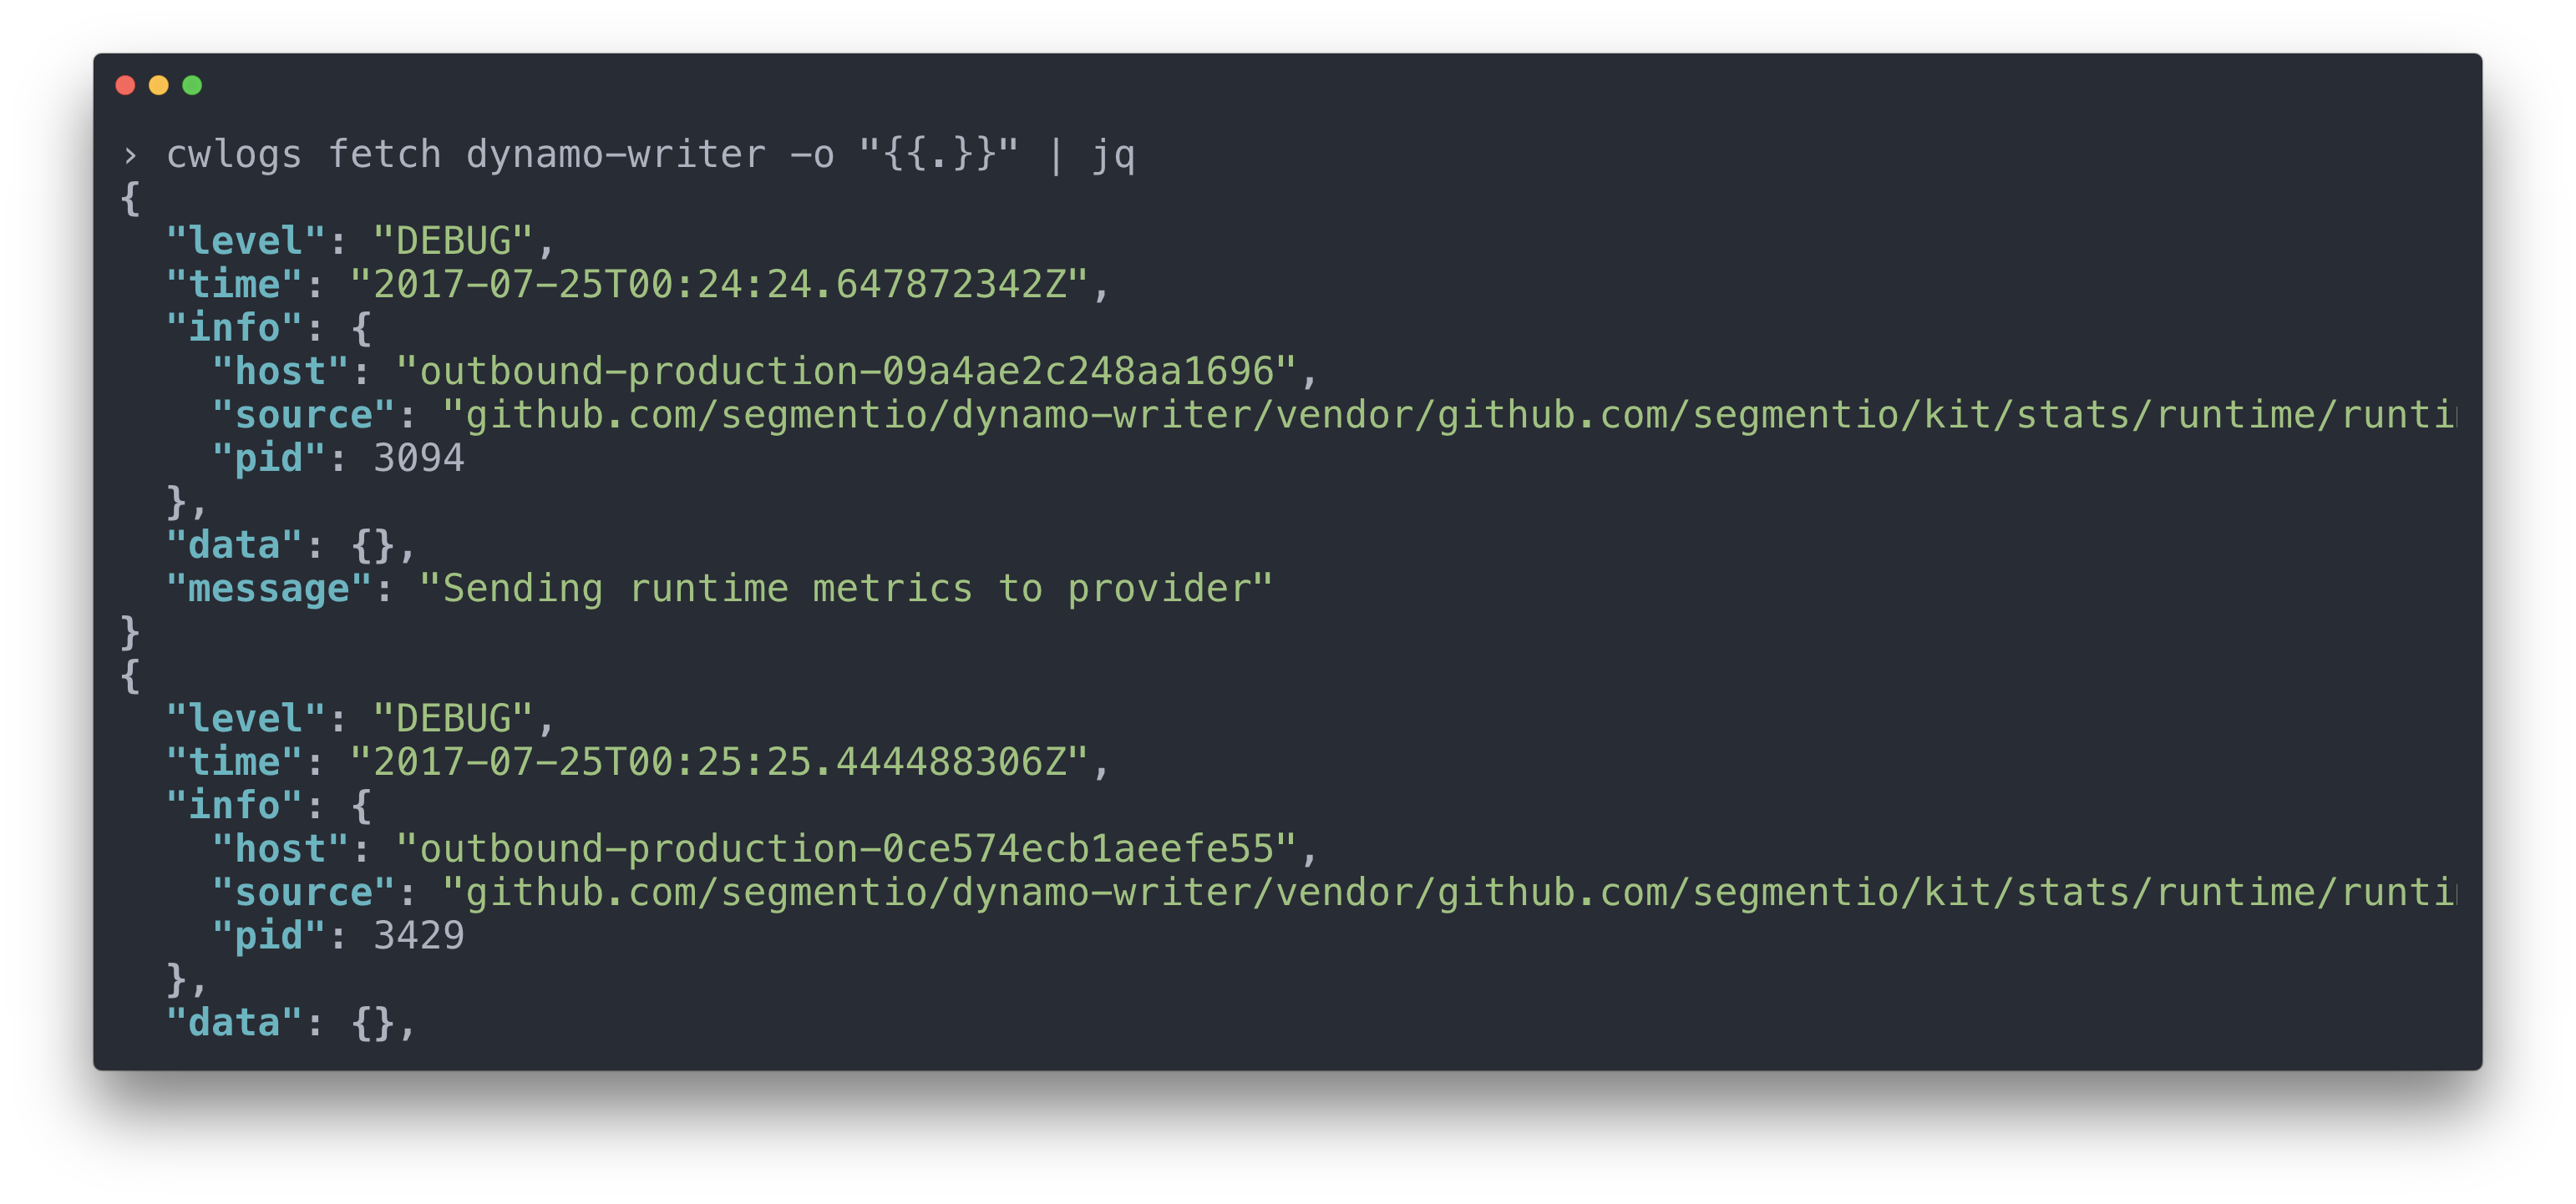
The formatting string passed in here is a Go template string, so you can easily tune the ‘verbosity’ of your log output (more details can be found here). Because we have a consistent schema across all of our logs, it’s easy for our developers to construct format strings to pull out the data they need and know that it will exist.
Our cwlogs CLI also supports fuzzy “did you mean” matching of various streams in case you forget the exact name of the service you’re trying to query.
Accessing the right logs from the terminal now only takes a few seconds. No more complicated login process, or tens of clicks to identify the log streams you’re interested in.
While all the usual advice when it comes to logging still applies (use structured logs, log straight to disk, adapt to common interchange formats, etc)–we’ve found the biggest piece still missing from most implementations is clear rate limits.
Many logging providers don’t provide service-level rate limits at all, or will silently drop messages when those limits are applied. At best, this causes confusion. At worst, it may cost you hours of debugging headaches.
At the end of the day, the I/O on a machine is a shared resource. If you’re stacking hundreds of containers on a given host, that I/O can start to disappear quickly. By introducing rate-limiting with clear indication when it is invoked, we’ve been able to spot problematic services much more quickly, and adjust their log volume accordingly.
If you’d like to try rate-limit-log-proxy, you can find the source on github and the image on docker hub. Same goes for the cwlogs CLI to access Cloudwatch. If you do end up kicking the tires, let us know what you think. Happy (rate-limited) logging!

Our annual look at how attitudes, preferences, and experiences with personalization have evolved over the past year.