SQL for Funnel Analysis: Building the Ultimate Funnel with SQL
By Erin Franz
Analyzing your behavioral data in a SQL database with tools like Segment Warehouses and Looker gives you a few key advantages: You can customize all of your analysis to match your individual business – like defining user sessionsbased on how people use your product. And, you can make sure that you’re accurately connecting anonymous and logged in users with a universal ID.
But that’s only the beginning.
With these building blocks you can dive into complex funnel and event flow analysis to gain insight into your users’ behavior. This post (the third in my threepart series) will show you how.
SQL allows data analysts to create custom queries, define events, and identify & categorize users in the precise ways they need to create a useful and informative funnel. With SQL, data analysts can better understand how users are flowing through the funnel and completing relevant events.
In most applications, there is a sequence of events you’d expect the user to navigate through to achieve an ultimate goal or conversion. For example, in e-commerce this is generally the sequence of events that ultimately lead to a purchase. This concept is use-case agnostic however, so long as you can determine an expected and desired event flow, you can set up a funnel. You probably already have an idea of what this event sequence should be, and in that case we can easily start tracking this funnel using our sessions.
Circling back to session generation, once we’ve established the events in our session (referred to in my previous post as Mapped Tracks) and marked them with a session ID, we can start establishing if our funnel events occur in each session. For this example, we’ll assume our funnel looks like this:
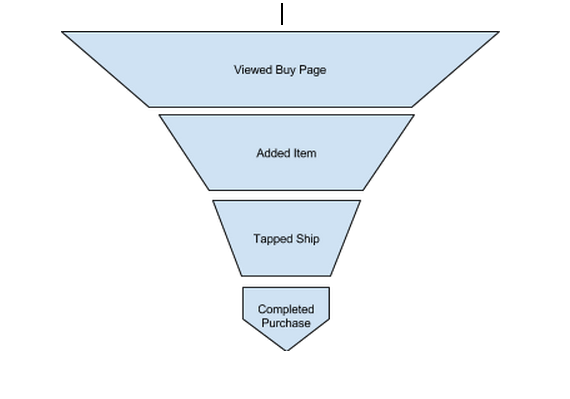
This implies the each user starts the funnel by viewing the buy page, and an amount of user drop off occurs at each proceeding step: Added Item, Tapped Ship, and Completed Purchase. Tracking the percentage of sessions that drop off between each step can identify potential areas for improvement within design and messaging. To easily track these events, we can add them to the Session Facts view we created previously:
Now we have the number of occurrences of each event per session. In the case of this funnel, we actually only need to know if each event occurred at least once. We’ll then want to sum the amount of sessions where this is true. This is easily done in the LookML:
We can simply run these measures for the desired time window to get the values for the conversion funnel, visualized here:
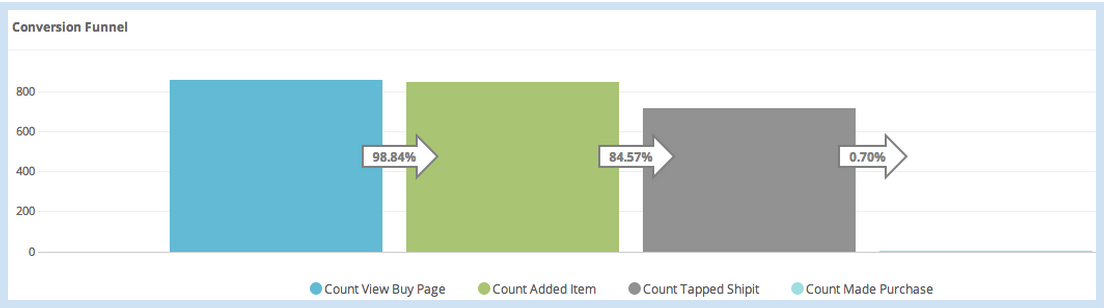
Show Percent Change has been enabled as well, so we can easily see the session drop-off between steps. In this funnel, we can see there is probably an issue between tapping ship and making a purchase that is worth looking into.
Often it is ideal to have the ability to be flexible and experiment with different funnels for your business or organization. Or you may want to see the results of a few different funnels before evaluating which one best represents your product flow and most important user actions. In these cases, we’ll want to build out a Custom Event Funnel, where we can choose which event counts we’d like to measure each time we run the analysis.
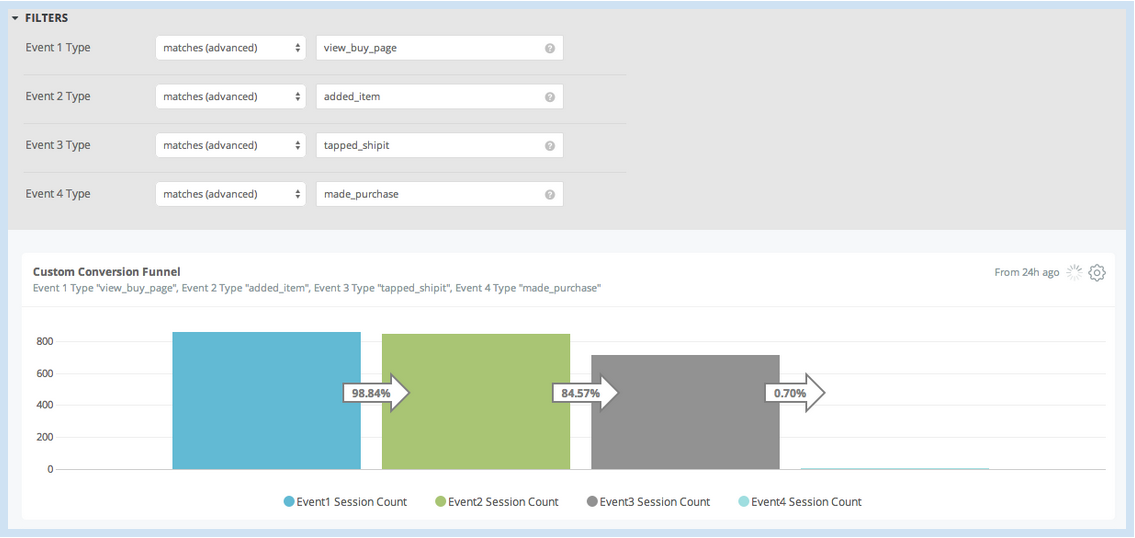
Since each event in the Tracks view has already been mapped to sessions, we can also calculate the amount of sessions with each event type from there via a distinct count of sessions. And because we’d like to be flexible with the event type, this is a good use case to take advantage of Looker’s Templated Filterfeature that can be used to create filtered dimensions and measures. Here, we want to define a filter for an arbitrary event type that we can use to filter a session count. Adding the following LookML to the Tracks view will accomplish this:
Event1 is a filter only field that can be populated with the desired event type. The event1_session_count measure then filters on the event1 input and calculates a distinct count of session_ids. We can then create event2 and event2_session_count etc. up to the number of events that we’d like to experiment with in the custom funnel. You can see the same funnel we created in the previous analysis as represented by the custom funnel in the following visualization:
Event funnels can provide a great high level view of application performance. But at a more granular level, it’s often interesting and valuable to see the exact flow or path from or ending at a particular event. This analysis will rely on event sequencing that we completed in conjunction with assigning session IDs to events in the Sessions Map from the previous post. In this case, let’s limit our flow analysis to five events. By joining the sessions map to itself on increasing sequence numbers, it’s easy to create a flow starting from each event.
After persisting this result in a derived table and joining the view to Tracks, we can explore the result set. For example, after filtering on added_item as the first event, we can examine the most common event paths:
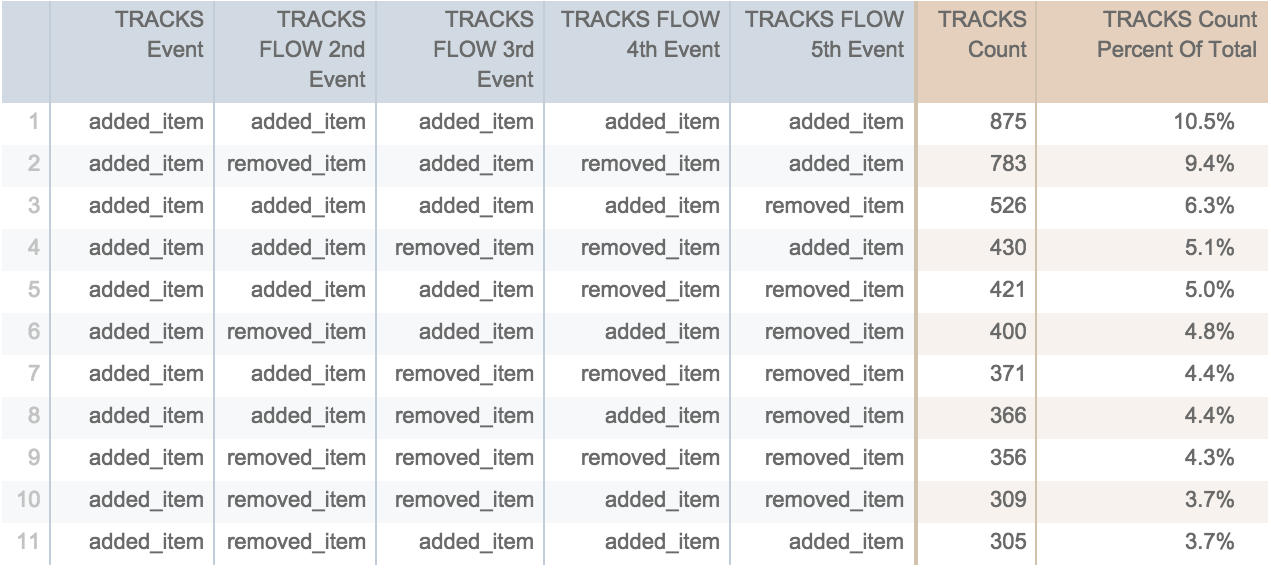
It seems in this application, once the user has added an item, it’s likely they will continue to add or remove items. Generalizing this result set a bit further, we can also see what the drop-off percentage is with each proceeding event, regardless of event type. This is easily accomplished by adding the following syntax to the Tracks Flow view file for each event number, which counts the number of events when the specified event is not null.
These measures can then be visualized as the amount of sessions that drop off after a particular event, in this case, Added Item.
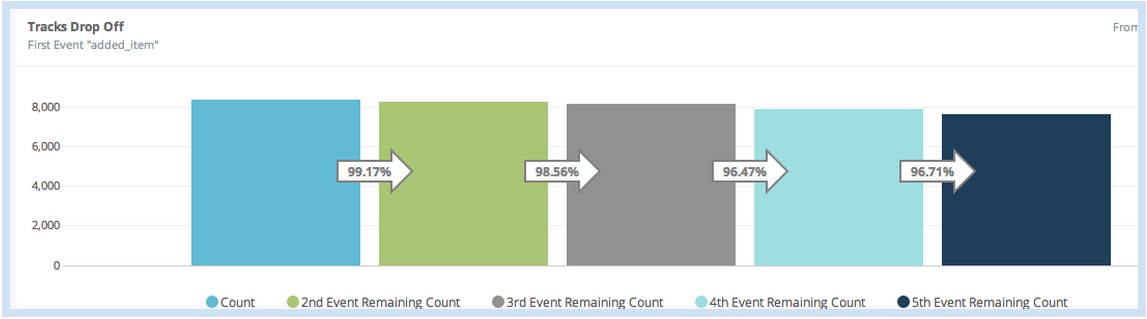
This analysis can be particularly useful to identify events that are prone to losing users and prevent them from converting. In this case, it looks like users are prone to continue application use after adding an item, which makes this event a great indicator of user engagement or “stickyness.”
Many web analytics solutions predefine how you should analyze your data. Looker allows you the flexibility to make your own rules as they apply to your unique business or organization. Universal User ID mapping, custom sessionization, and advanced funnel analysis are only a few possibilities with a Looker-Segment joint solution. This combination enables you to access and analyze your data on your own terms.
To learn more, visit segment.com/warehouses and www.looker.com.

Our annual look at how attitudes, preferences, and experiences with personalization have evolved over the past year.