Changing one character wildly improved our application's performance
Learning a valuable lesson about taking your profiling data at face value.
By Kevin Burke
Learning a valuable lesson about taking your profiling data at face value.
What's the biggest performance improvement you've gotten from changing a single character? We recently removed one character and tripled the write throughput of our internal tracing storage infrastructure.
The Infrastructure Observability team at Segment stores tracing data for internal services in a distributed storage system called TraceDB. Our production systems generate large volumes of traces, around 4 million spans per second, and existing solutions to store all of them were prohibitively expensive in either time or cost. TraceDB consists of a series of storage nodes that store tracing spans on disk in an LSM tree. When new tracing spans come in, we do the following:
Append the spans to an in-memory buffer.
If the buffer is full, sort the spans by trace ID and flush them to disk at the highest level of the LSM tree.
Once enough small files have been created at the highest level of the tree, TraceDB merges them and places the merged file in the next-highest level of the LSM tree until it has very large sorted files on disk (and indexes) at the lowest level of the tree.
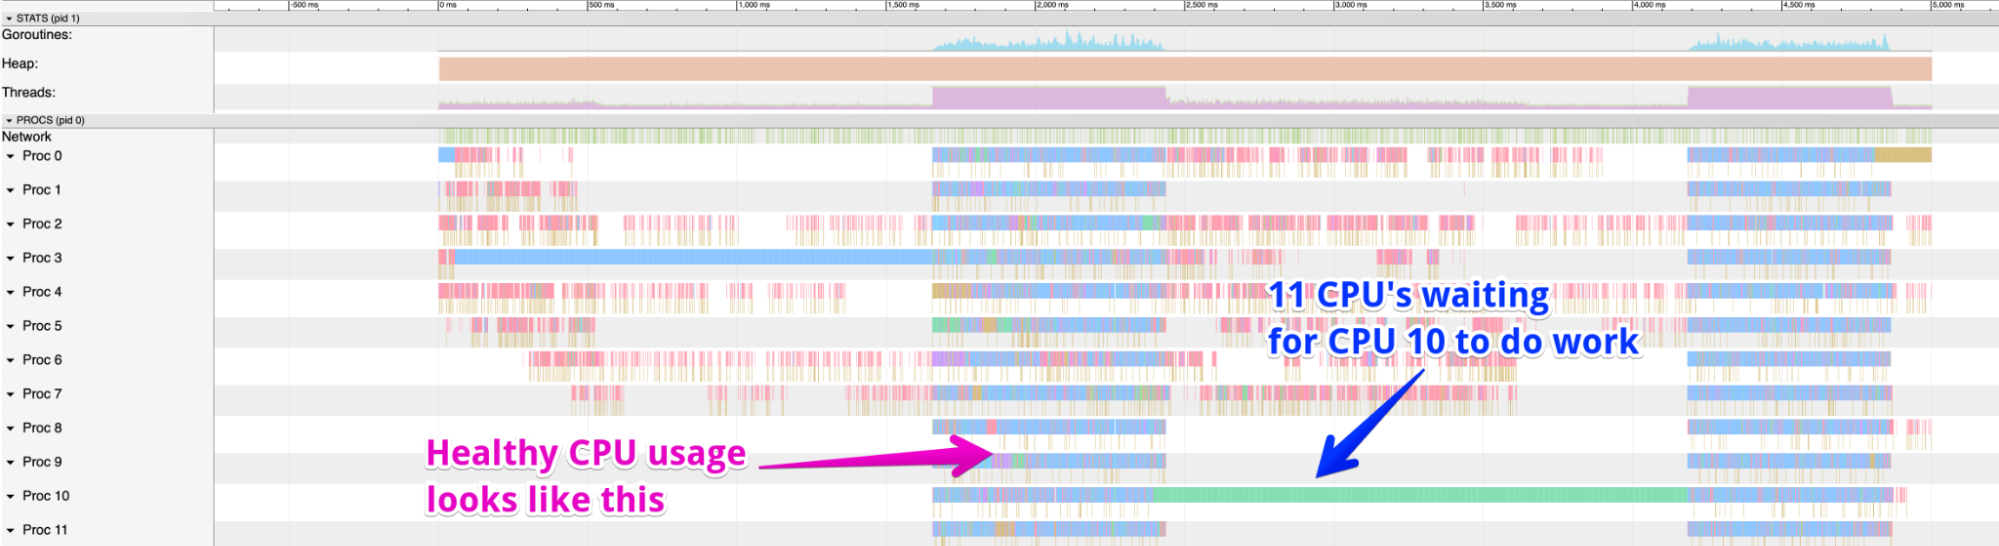
While implementing new product features recently, we noticed that TraceDB was slow to respond to incoming queries. Our first step was to pull process-level tracing information from the Go runtime and we noticed some odd behavior. TraceDB was only doing work on one CPU core while the others were practically idle. Visually, the pattern makes this clear:
(We digress slightly to note that if you are using Go and consuming trace data, you should upgrade your production applications to Go 1.18 as soon as possible, because it fixes several long-standing issues with profiling on multiple cores.)
The trace data we pulled using our kubectl-curl tool to download pprof samples shows the stack trace where our single busy CPU thread was spending most of its time:
We then used Go’s pprof graphical view (“go tool pprof -png /path/to/pprof.dump”) which made it clear that these long pauses were caused by the span sorting code holding a table-level lock:
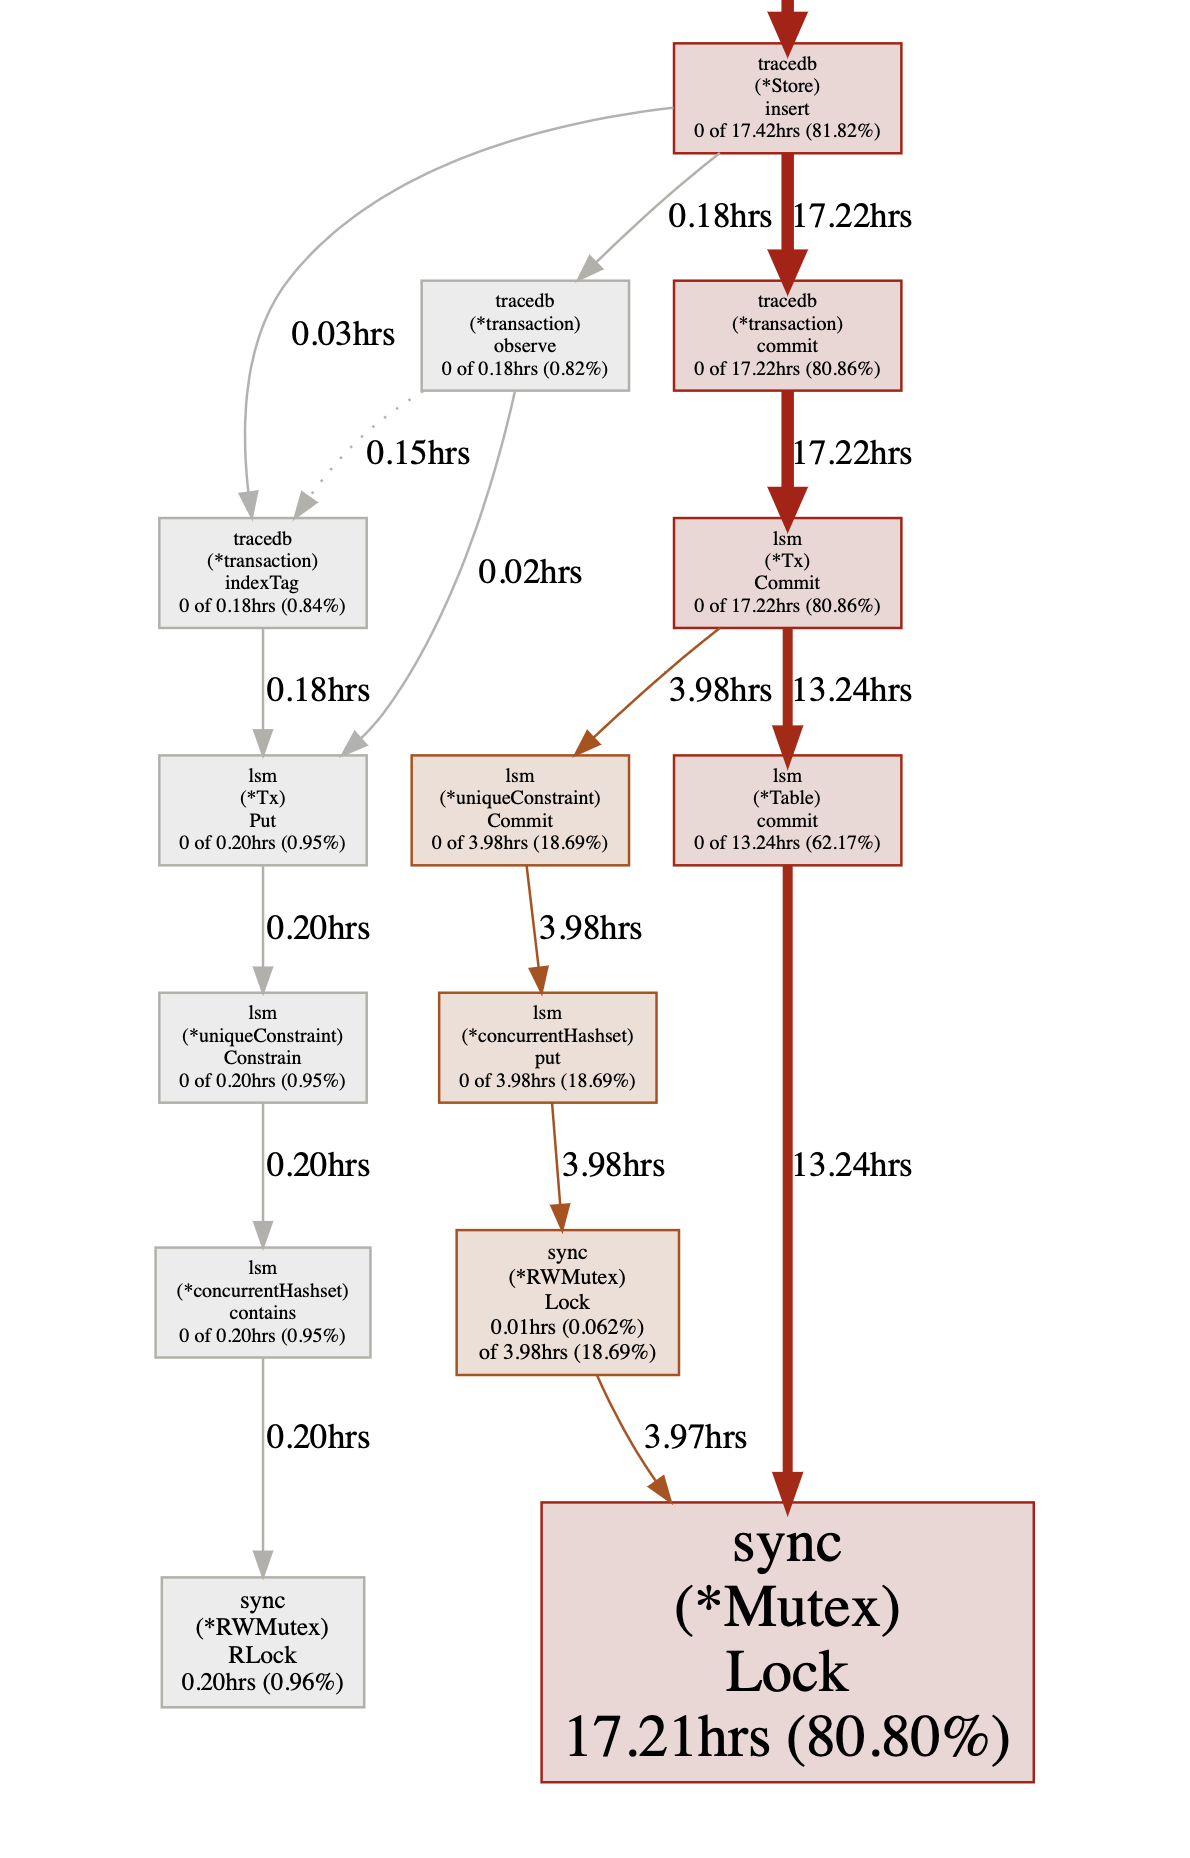
We were spending a lot of time sorting records, and nothing else was happening because the sort code was holding a lock.
While TraceDB shouldn’t need to hold a table lock to sort spans during the compaction process, it also shouldn’t need to spend several seconds sorting those spans. (Fixing the lock problem was also interesting but we're going to focus on the sort performance here.)
By way of comparison, Go’s built-in sort library can sort 100,000 random integers in about 10 milliseconds on a consumer-grade ARM processor (as of Go 1.18). For maximum speed when sorting, we use custom sort algorithms provided by our asm library that are optimized for the size of data that we are trying to sort. These algorithms are about 500% faster on amd64, and 40% faster on arm64, than Go’s standard library sort implementations.
Well, faster in theory. Once we took a closer look at the sorting algorithm, we spotted an issue in the single most critical part of a sorting algorithm: the comparison function.
Did you catch that? The way a sorting algorithm works is to check, over and over again, if two of the numbers in an array are sorted. If a is less than b in the "less" check above, swap them, and repeat iteratively until you have a sorted array. What if the two numbers are equal? The previous version of the function would always return true and trigger a swap of equal values!
So if you have a lot of identical values, you will end up with the pathological case of needing to inspect and swap every single record. While both the old and new versions of the function are technically "n log n" according to runtime analysis, and both will sort records correctly, in real life the version with more swapping will be slower due to the larger number of comparisons and in-memory data writes that need to happen.
In TraceDB’s case, the span buffers have a lot of identical trace IDs because the records being sorted are tracing spans and we are sorting them by trace ID. Any time a trace is composed of multiple spans it will have multiple entries in the sorted table.
This reveals a good test to run for a sorting algorithm: try to sort a million identical rows. If it doesn't return very quickly, or you end up doing more than N comparisons, you can probably remove a lot of work by not swapping equal values. The benchmarks provided by the recent change to Go’s default sorting algorithm, which cover cases like “sorted”, “nearly sorted”, and “reversed”, are good starting points.
For brevity we’ve condensed the bug hunt down to the actual problem, but we spent a lot of time looking at other places. This reinforces the importance of confirming your base assumptions when investigating performance issues.
Every so often there really is a bug in the libraries and systems that everyone assumed had been sufficiently battle-tested. Until you test those assumptions, you can’t know for sure. In the case of algorithms that operate on large amounts of data, the shape of the data being sorted can have a significant impact on the algorithm you choose to use, so understanding that shape is important.
In the end, profiles don't lie; they should be an integral part of your toolkit for diagnosing performance issues. Traces make visual what can be nearly impossible to infer through less comprehensive signals like logs and metrics. Sometimes the thing it tells you it's spending all the time in is the thing that's actually slow. It’s also a valuable lesson that different people take different approaches, and have different experiences.
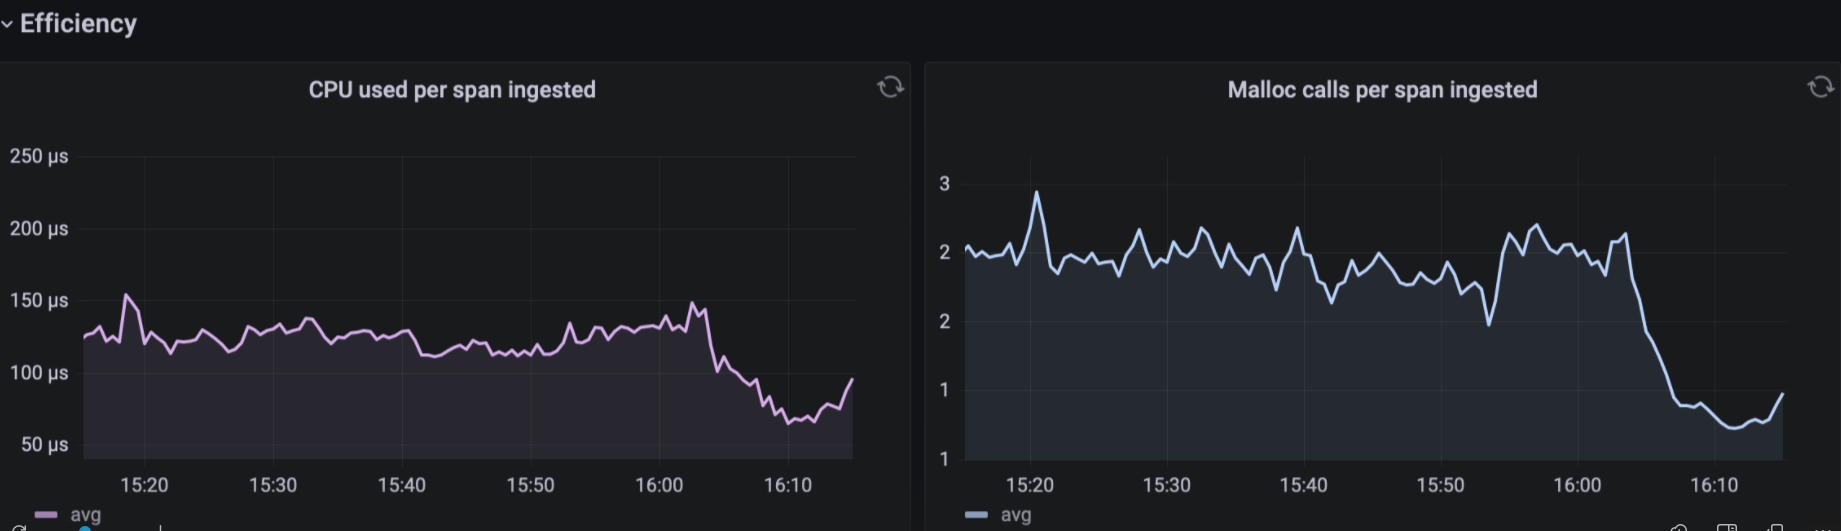
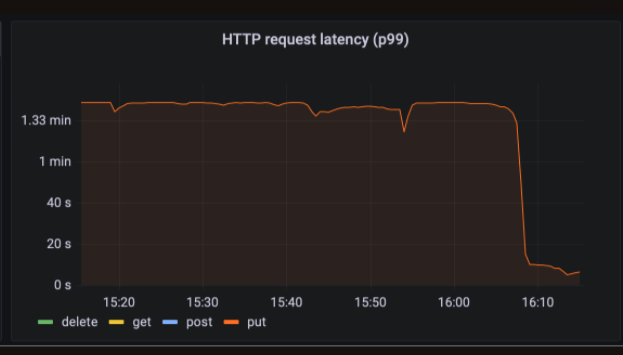
After we deployed the sorting algorithm fix, TraceDB’s ingest rate immediately went up 330% because it was no longer holding 11 CPU cores hostage while needlessly sorting data for several seconds at a time. Previously clients would hang and/or drop messages, because TraceDB couldn’t handle the load; after the fix, latency and drop rates fell dramatically. TraceDB’s CPU usage dropped dramatically as well. That’s how we increased performance by 3.3x—going from 400,000 spans per second to 1.3 million per second—by removing a single character.
Thanks to Chris O’Hara and Tyson Mote for their expertise and time troubleshooting this issue, and for reviewing drafts of this blog post. Thanks also to Saran Sivashanmugam and Achille Roussel for feedback.

Our annual look at how attitudes, preferences, and experiences with personalization have evolved over the past year.