A Guide to Data Modeling & The Different Types of Models
By Geoffrey Keating
By using data models, various stakeholders like developers, data architects, and business analysts can agree on the data they’ll capture and how they want to use it before building databases and warehouses.
Like a blueprint for a house, a data model defines what to build and how, before starting construction, when things become much more complicated to change. This approach prevents database design and development errors, capturing unnecessary data, and duplicating data in multiple locations.
In this article, we’ll cover these basics of data modeling:
What is data modeling?
Understanding different types of data models
Why data models are necessary for building a data infrastructure
Top three data modeling techniques
Data modeling is the process of conceptualizing and visualizing how data will be captured, stored, and used by an organization. The ultimate aim of data modeling is to establish clear data standards for your entire organization.
For example, a model for an e-commerce website might specify the customer data you’ll capture. It will define how to label that data and its relation to product information and the sales process.
Data models get divided into three categories: abstract, conceptual, and physical models. They help align stakeholders around the why, how, and what of your data project. Each type of model has a different use case and audience in the data modeling process.
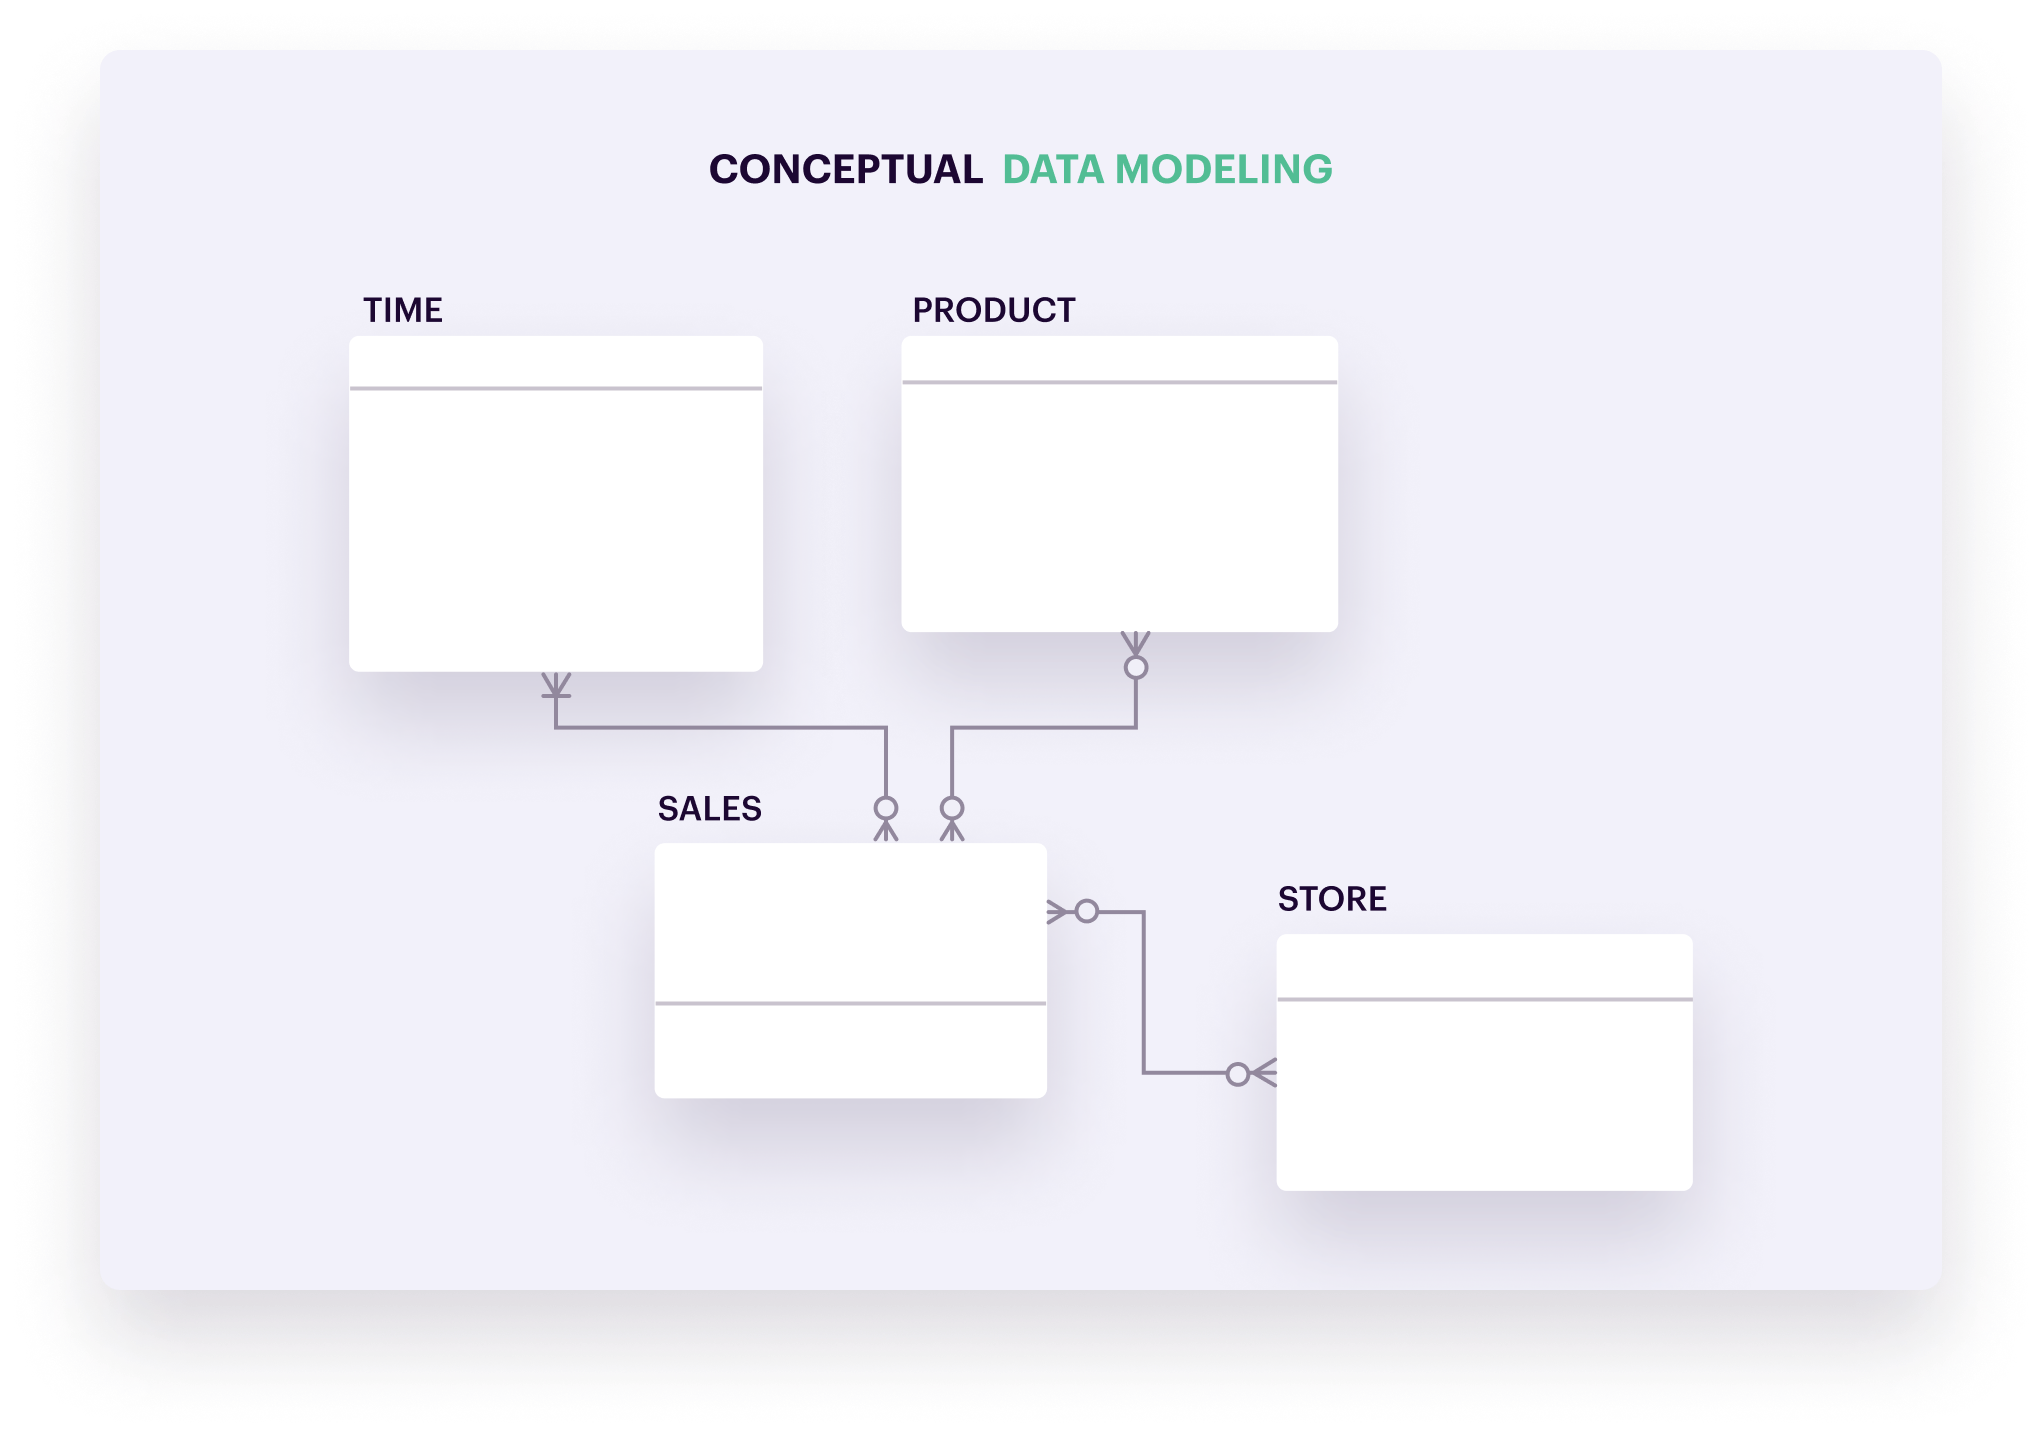
Conceptual data models visualize the concepts and rules that govern the business processes you’re modeling without going into technical details. You use this visualization to align business stakeholders, system architects, and developers on the project and business requirements: what information the data system will contain, how elements should relate to each other, and their dependencies.
Typically, a conceptual model shows a high-level view of the system’s content, organization, and relevant business rules. For example, a data model for an e-commerce business will contain vendors, products, customers, and sales. A business rule could be that each vendor needs to supply at least one product.
There’s no standard format for conceptual models. What matters is that it helps both technical and non-technical stakeholders align and agree on the purpose, scope, and design of their data project. All of the below images could be examples of conceptual data models.
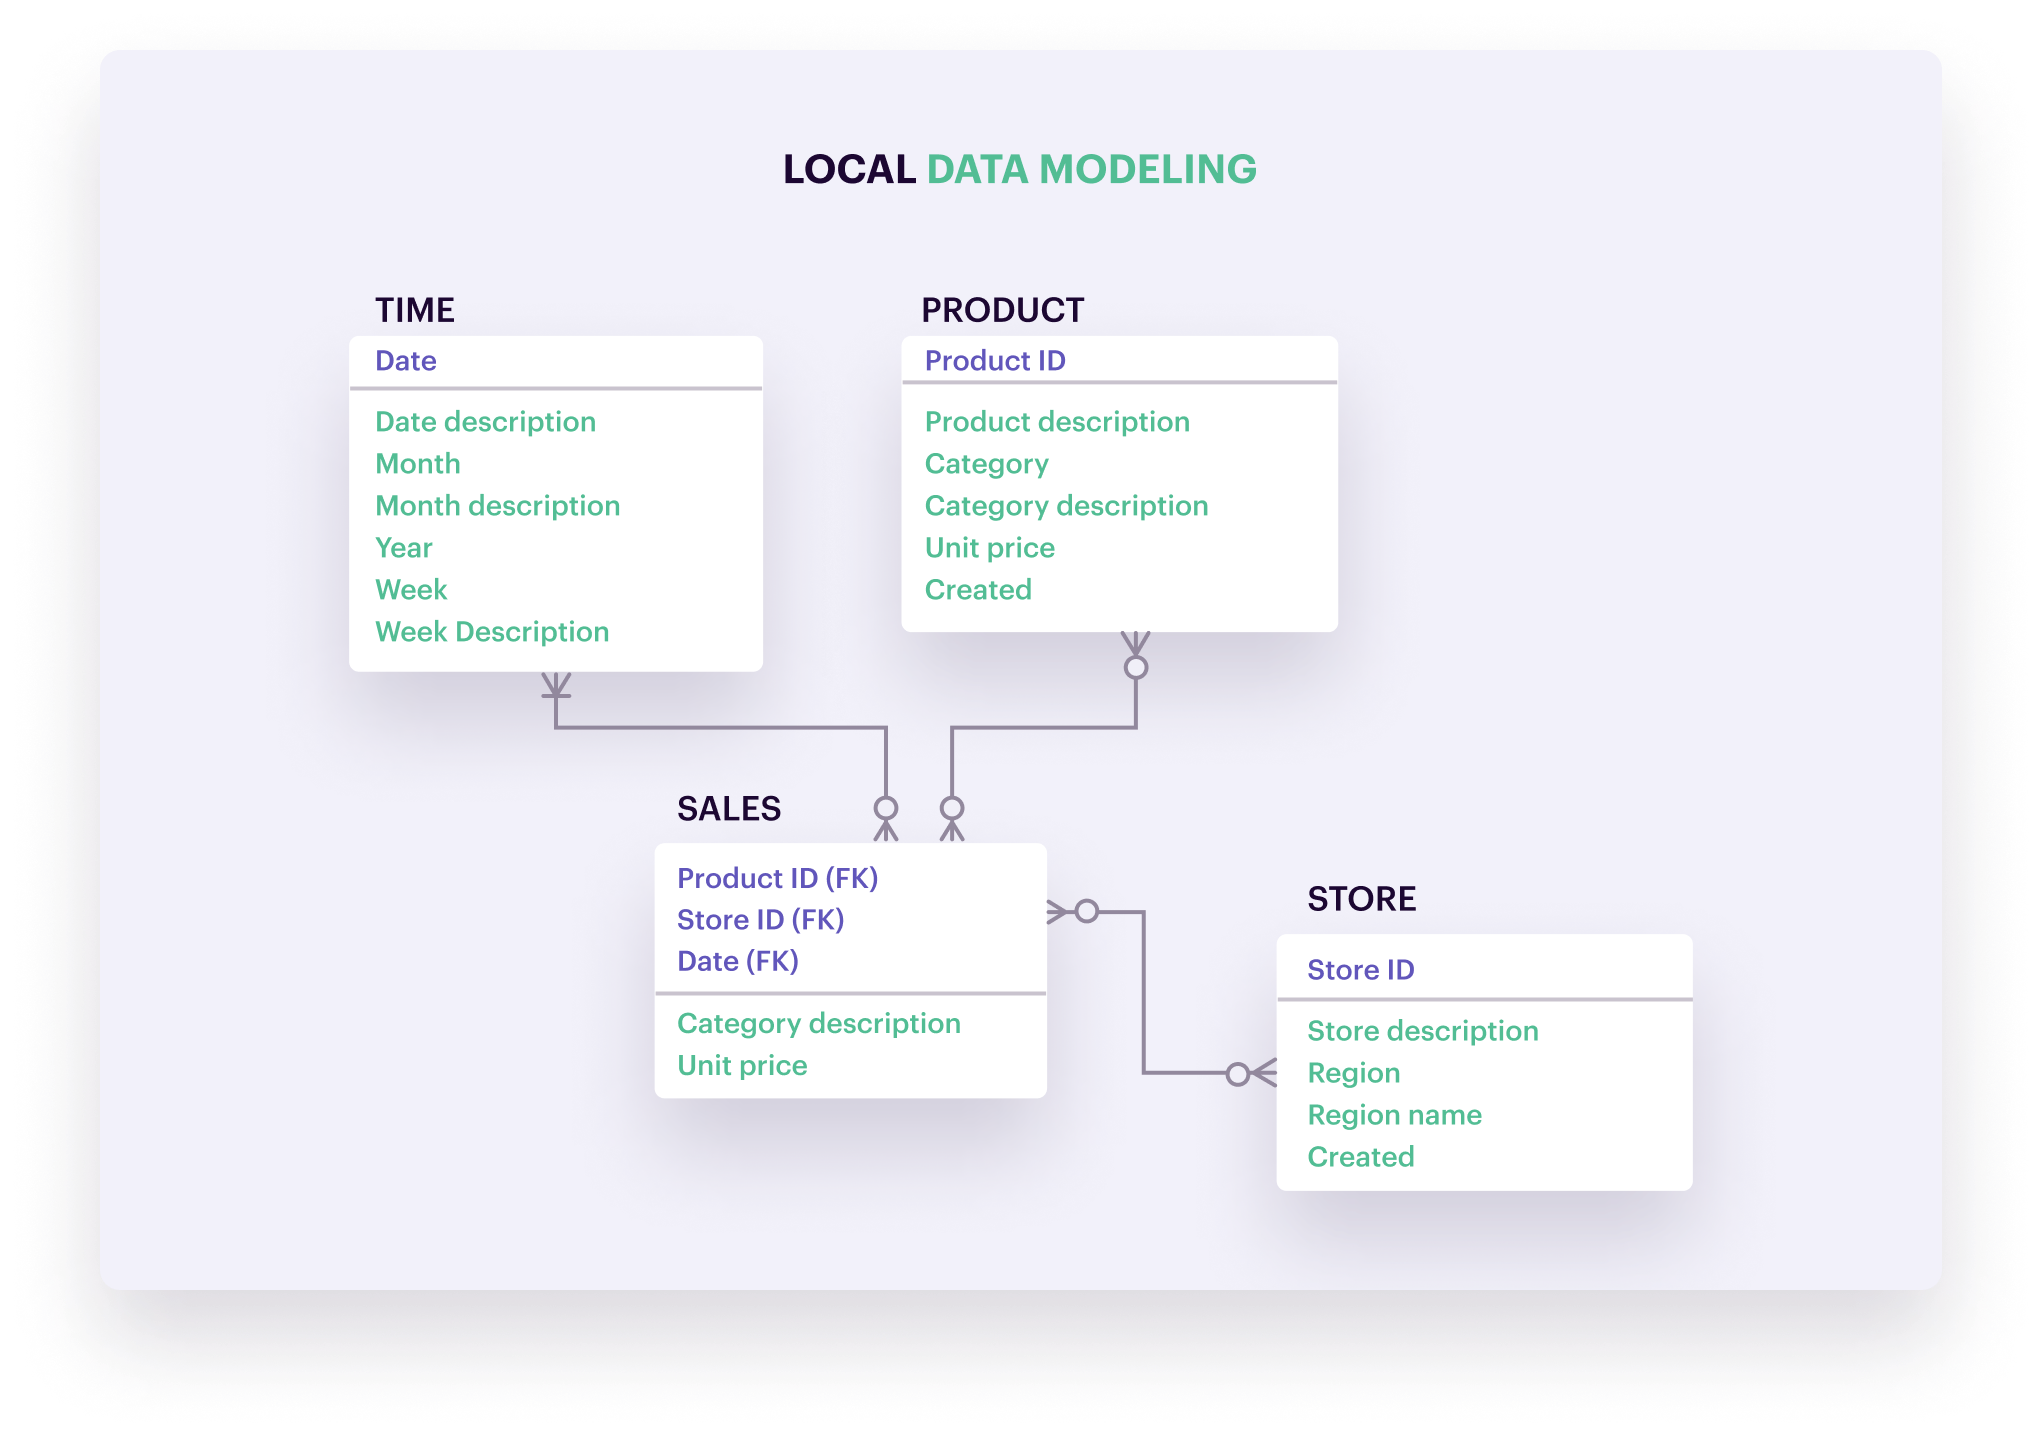
A logical data model is based on the conceptual model and defines the project’s data elements and relationships. You’ll see the names and data attributes of specific entities in the database. To stay with the e-commerce example: A logical model shows products are identified through a “product ID,” with properties like a description, category, and unit price.
Data architects and business analysts use the logical data model to plan the implementation of a database management system—software that stores, retrieves, defines, and manages data in a database.
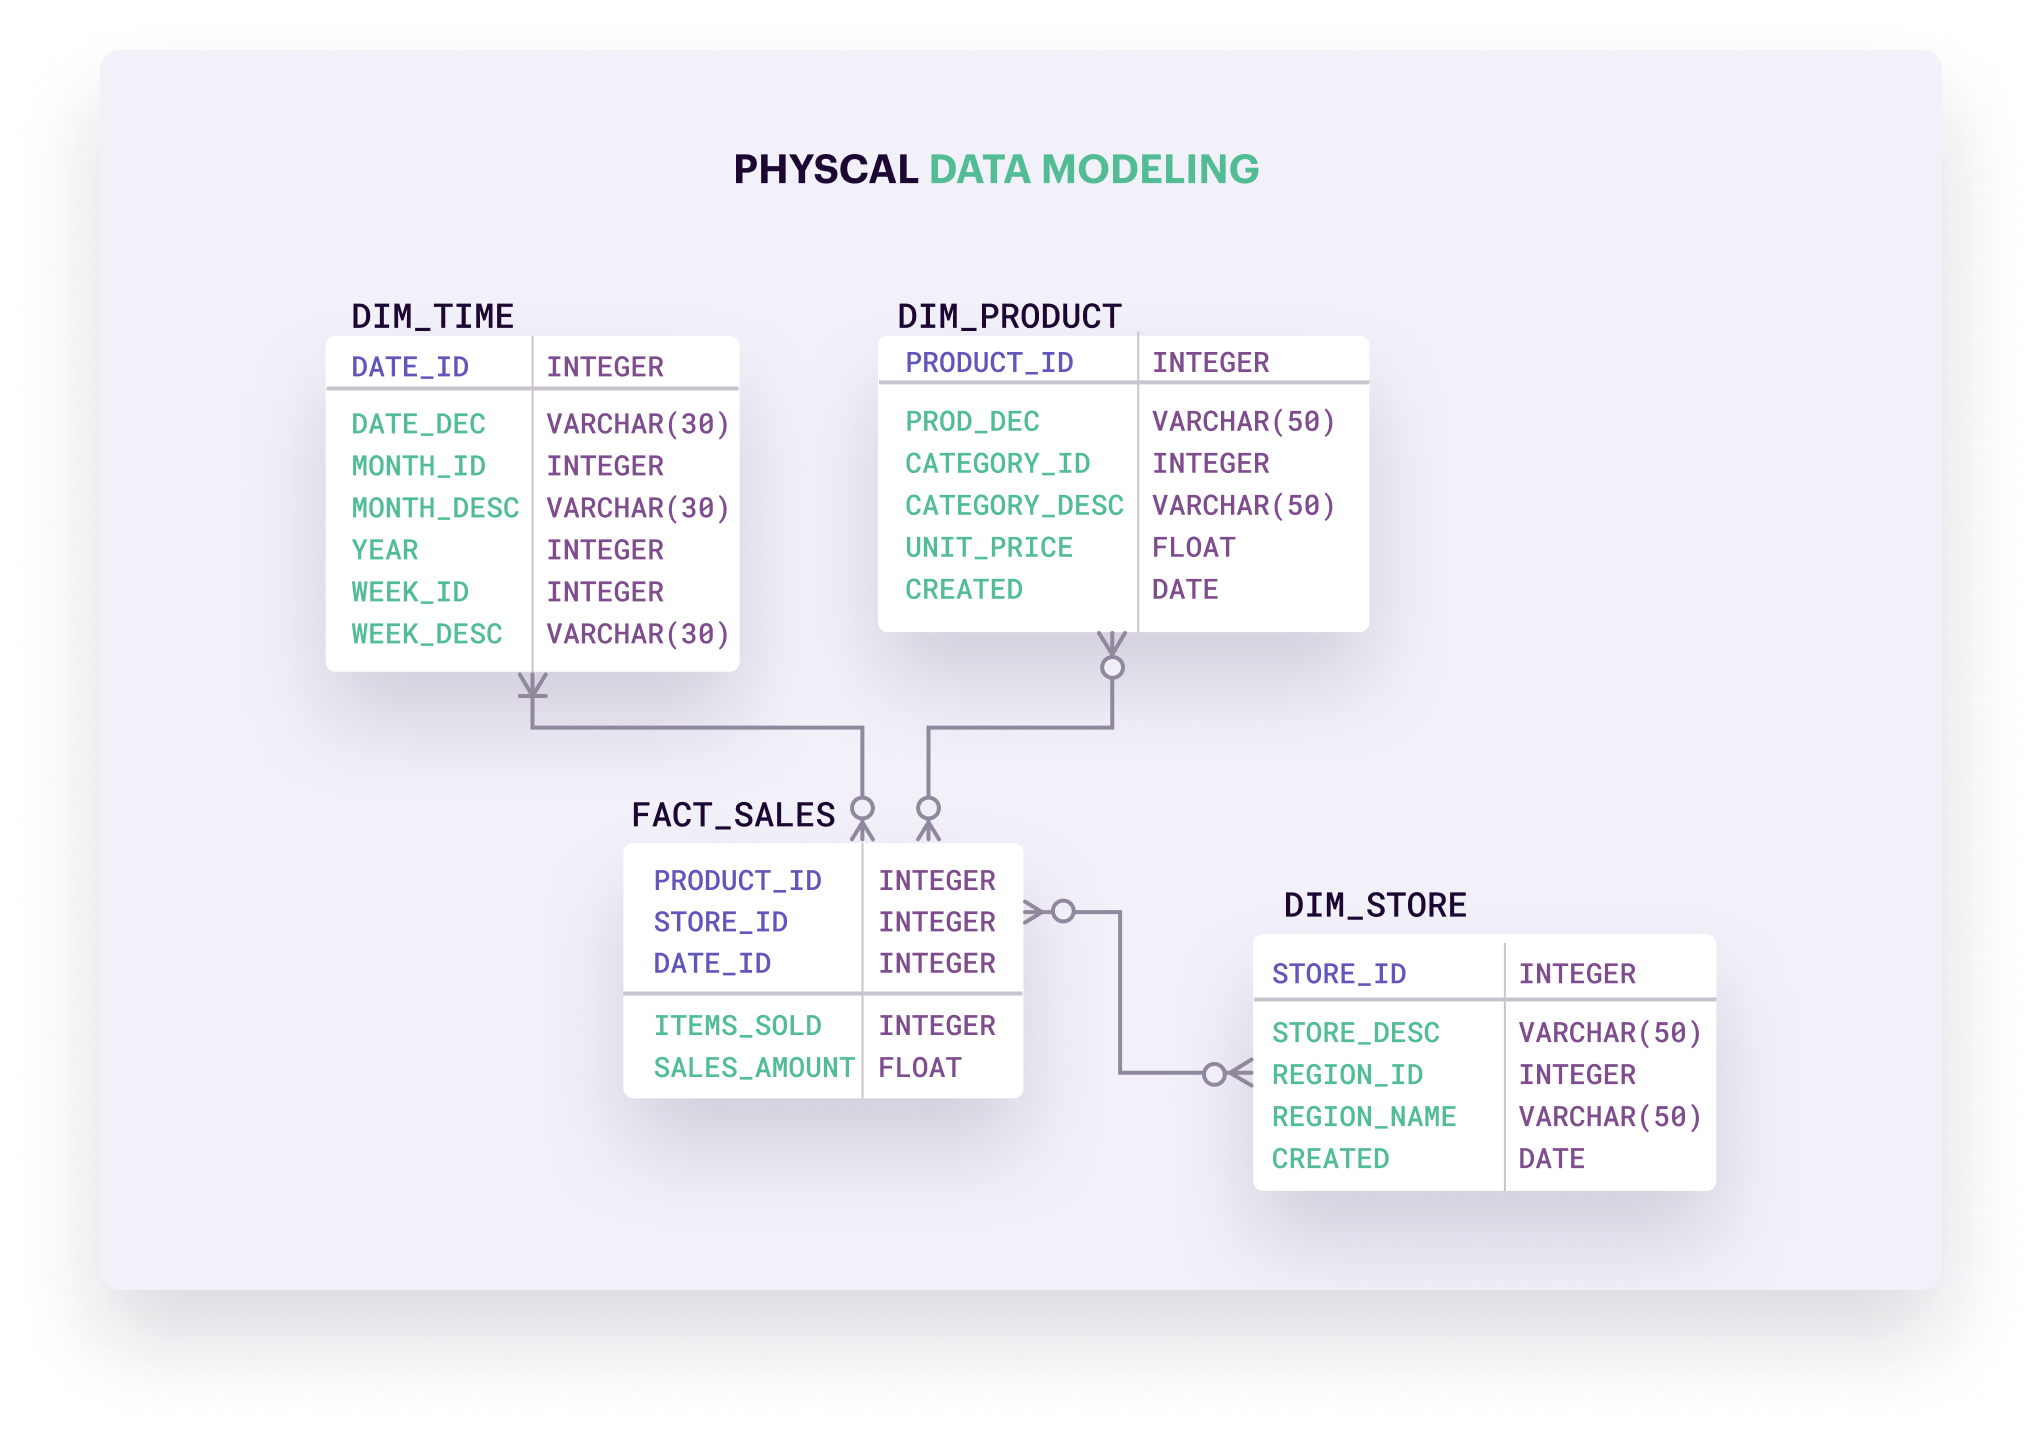
The physical data model gets technical. Database analysts and developers use it for the design of the database and relevant data structures. The model specifies the types of data you’ll store along with technical data requirements.
An example of data type specifications is whether a piece of data will be an integer—a number without a decimal point—or a float—a number with a decimal place. Technical requirements include details on storage needs, access speed, and data redundancy—storing a piece of data in multiple locations to increase durability and improve query performance.
In practice, only very large projects, say modeling a container shipping business, move from conceptual to logical to physical models. Most other projects skip the conceptual phase and spend most of their time in logical modeling. Some teams even cover elements from the physical phase simultaneously because the people working on the logical model also do the technical implementation.
Data models are a visual representation that turns abstract ideas (“we want to track our global container shipments in real time”) into a technical implementation plan (“we will store an attribute called ‘container GPS location’ in a table called ‘Containers’ as an integer”). They help avoid costly demolition and reconstruction of your data infrastructure because data modelers need to think about the data they'll need, its relations, the data architecture, and even whether your project is viable before creating databases and warehouses.
Data models also help with data governance and legal compliance, as well as ensuring data integrity. They allow you to set standards from the start of the project so teams don’t end up with conflicting data sets that need cleaning up before they can use it or, worse, can’t use at all.
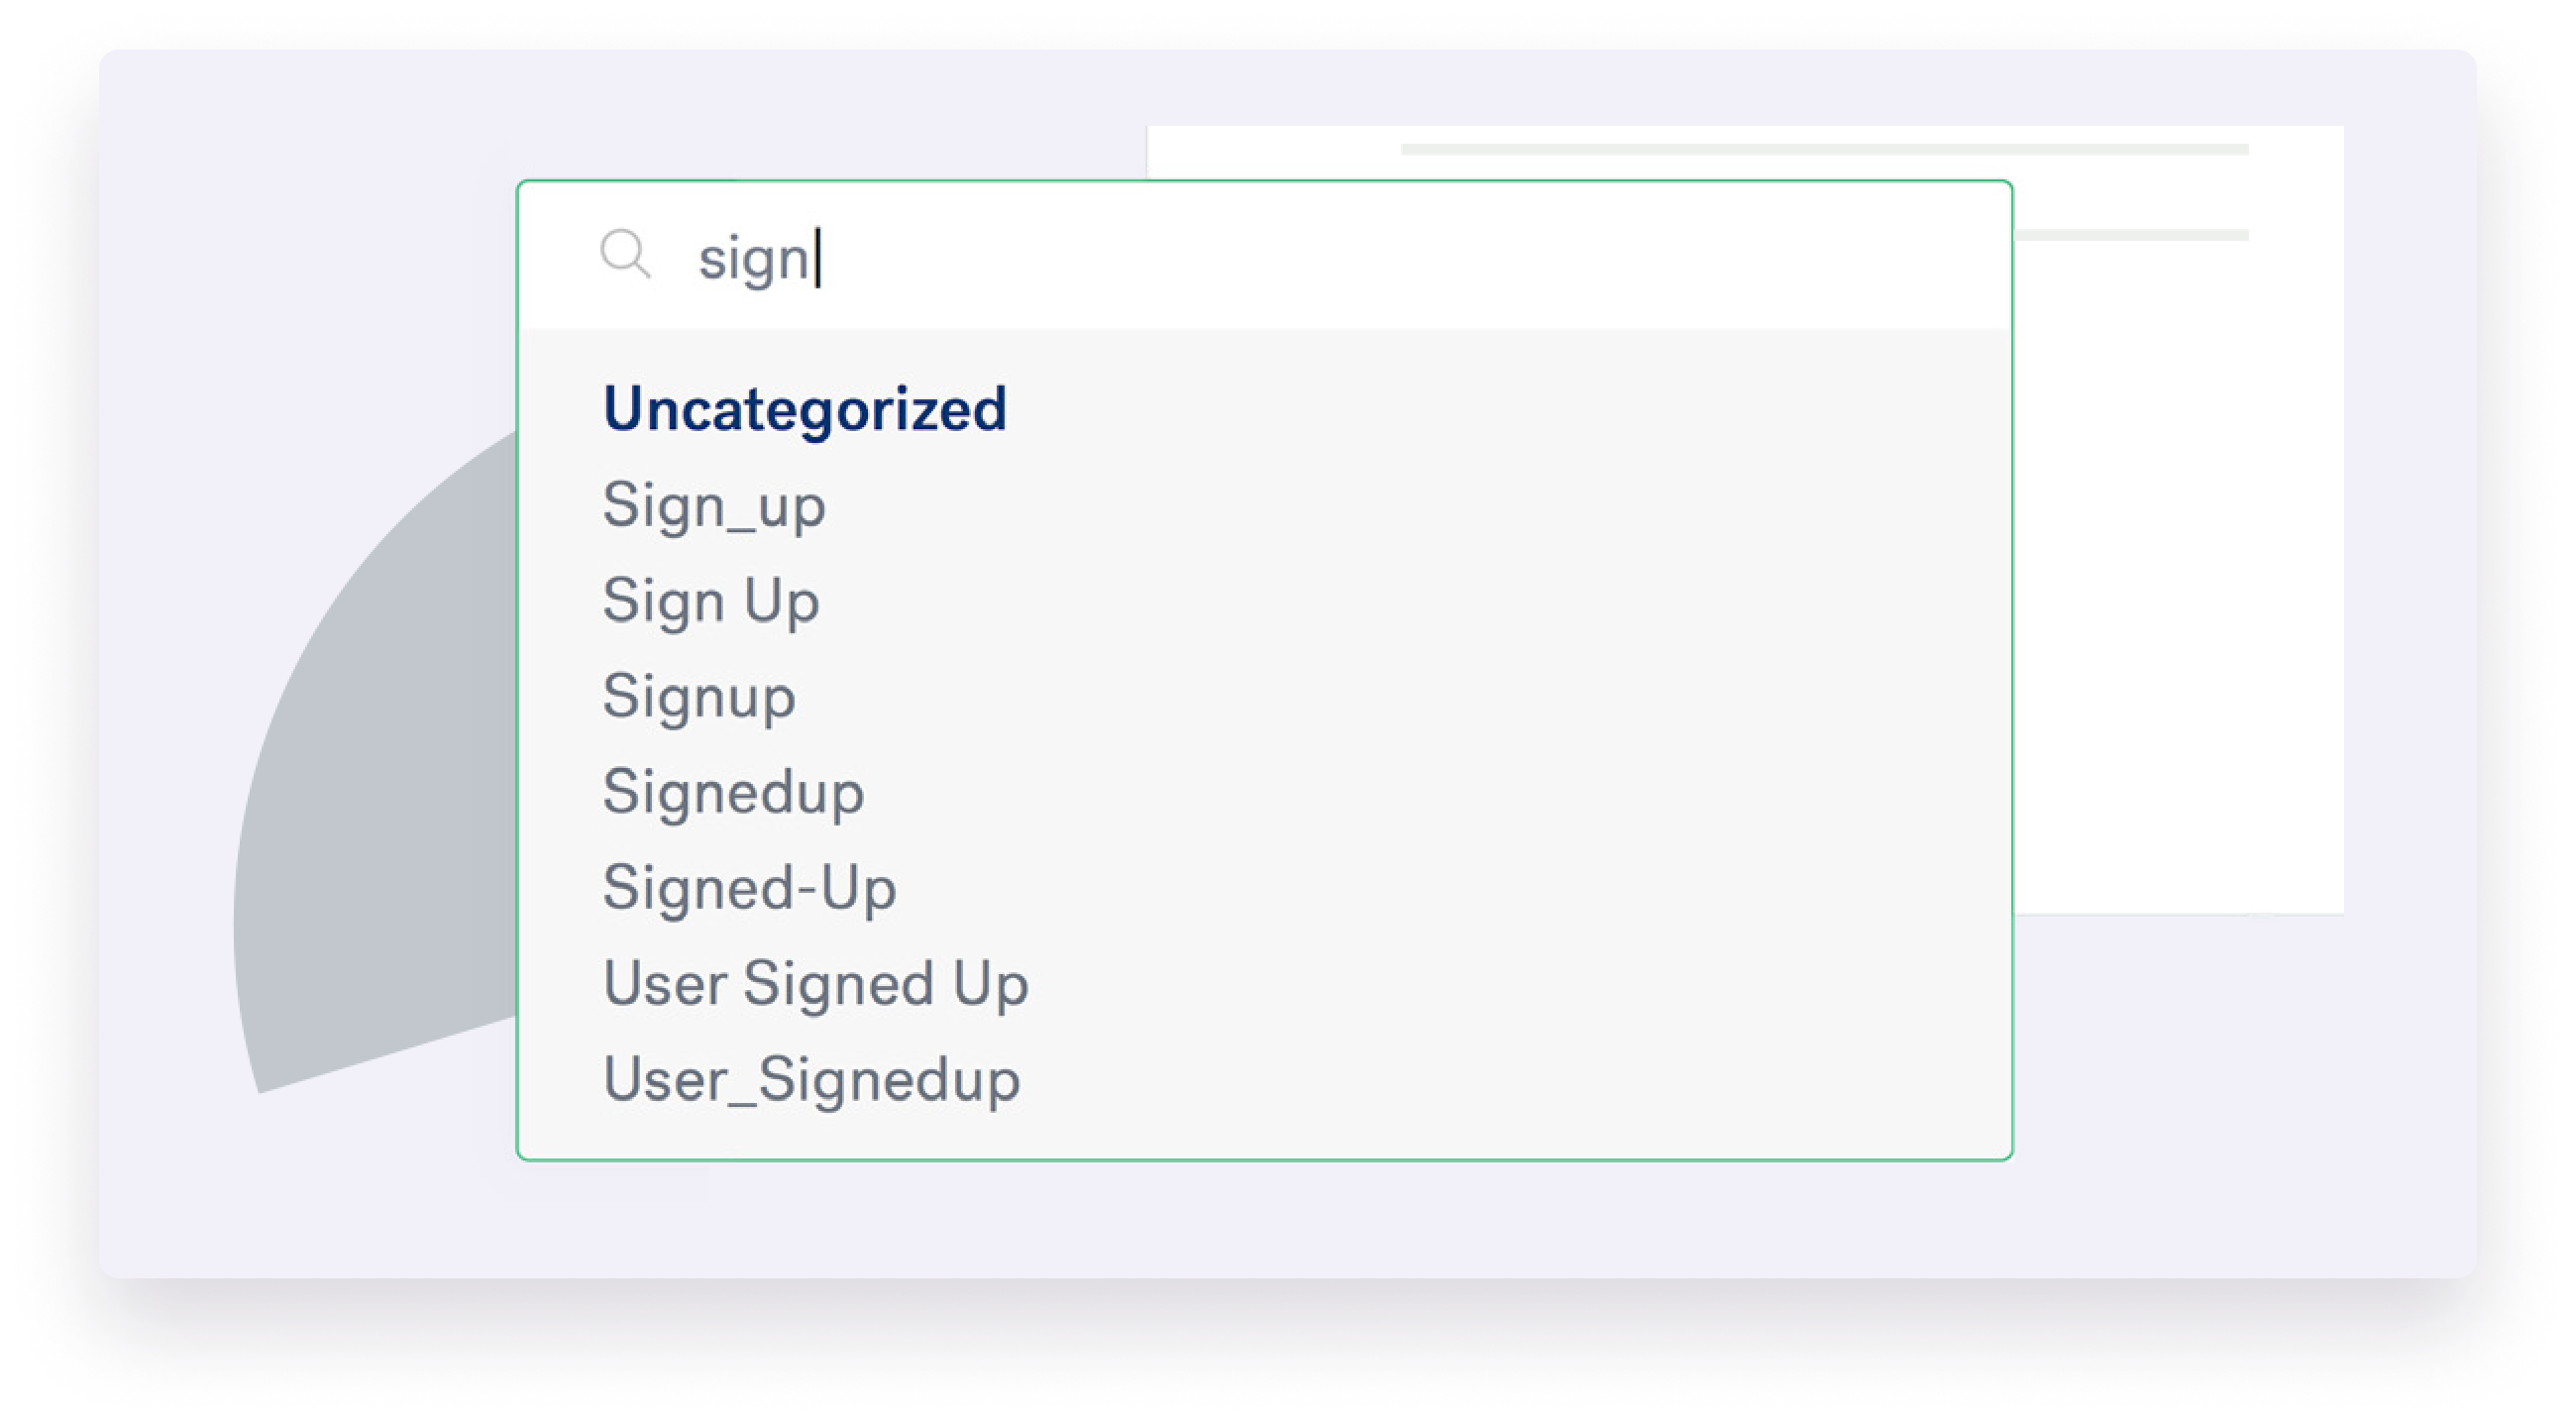
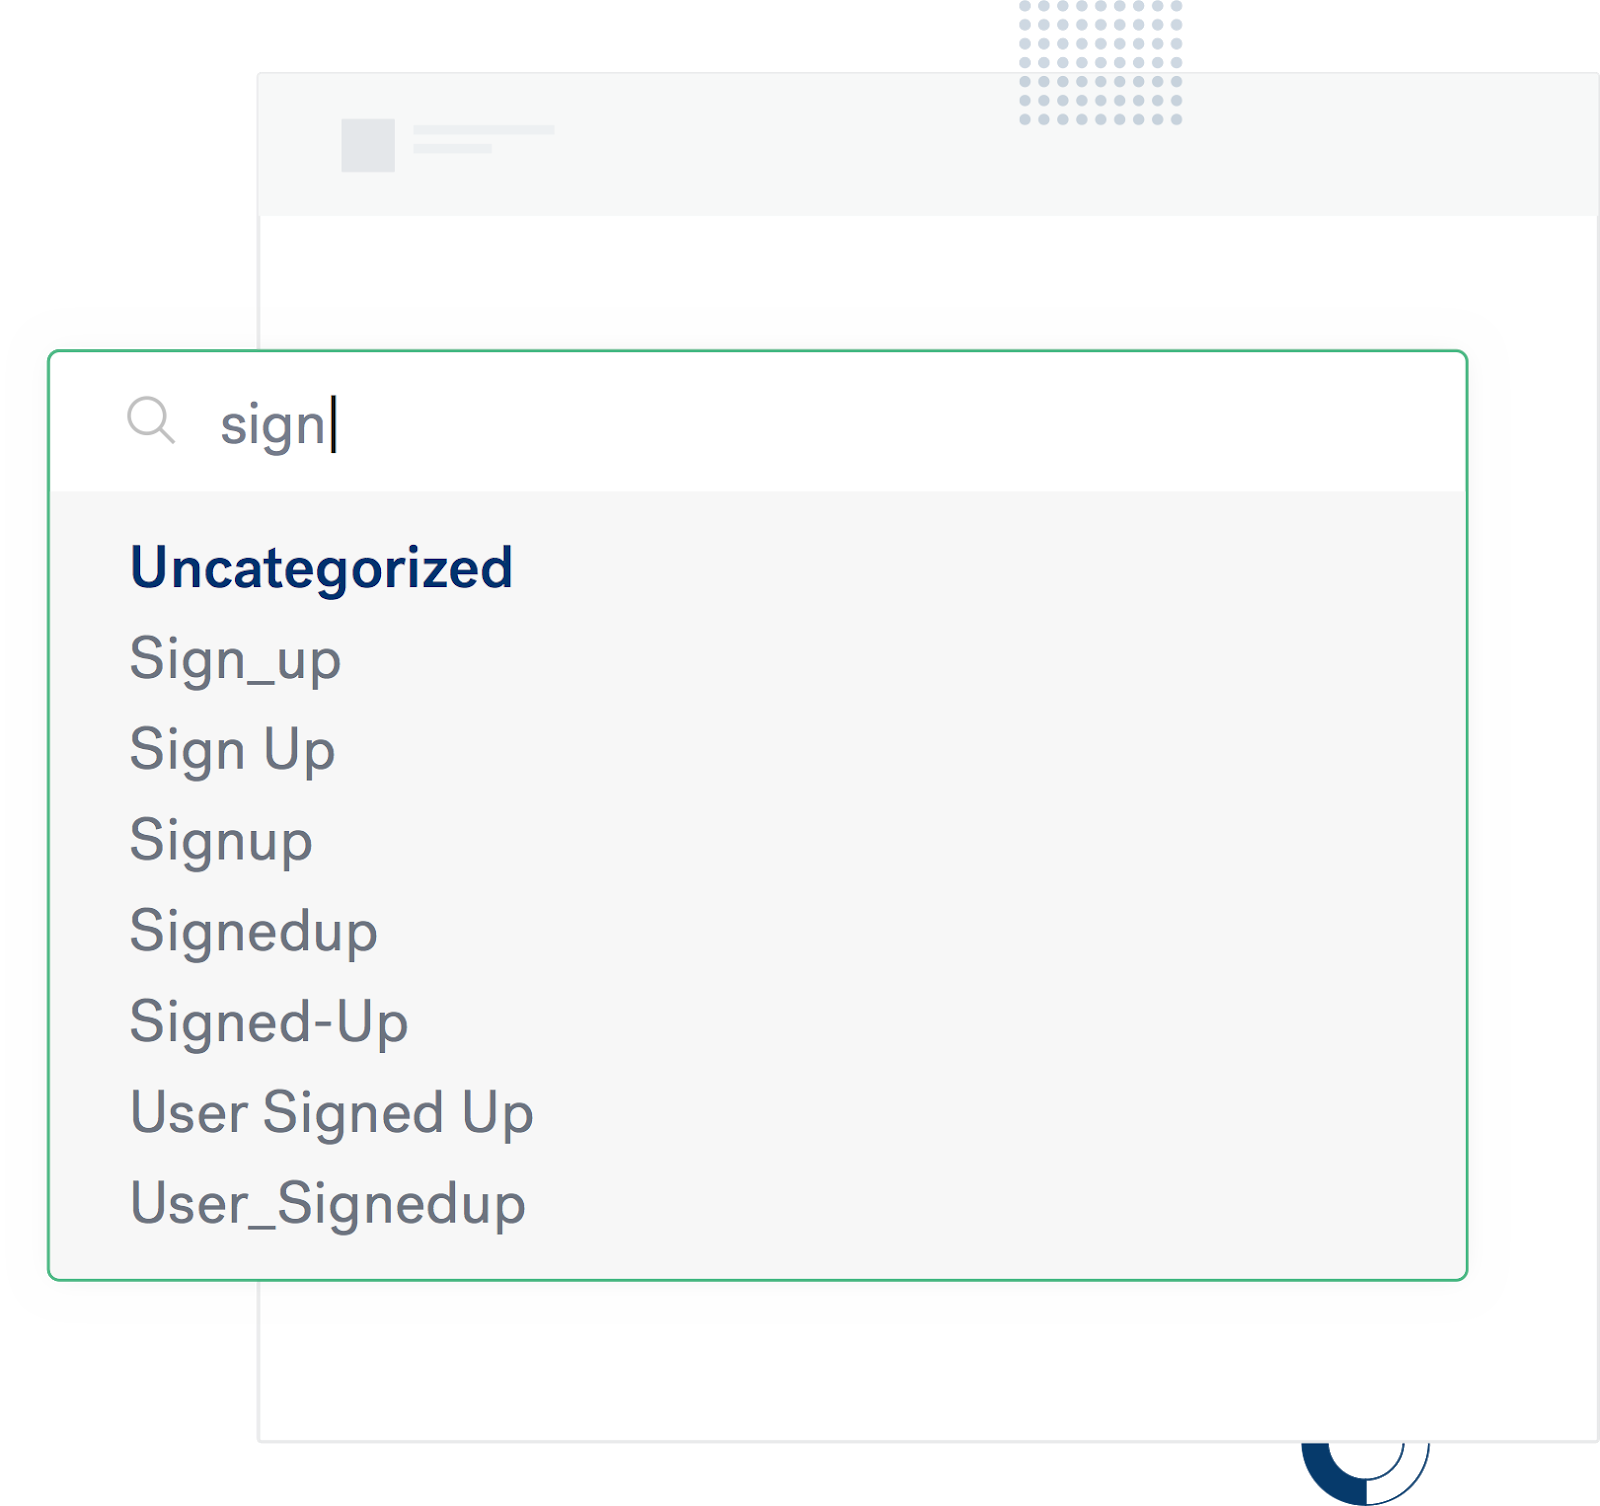
Data models and standardization help avoid situations like a sign-up field labeled in nearly a dozen different ways across the organization.
You can also identify sensitive information—social security numbers, passwords, credit card numbers—while you’re modeling so you can involve security and legal experts before you start building.
Safe, accurate, and high-quality data, confers a range of real-world benefits for various teams in your organization. Product teams can iterate faster and build immersive user experiences. Analytics and business intelligence teams can create queries without heavy workarounds. And marketing teams can improve advertising efforts by personalizing messaging according to user behaviors and traits.
There are many different techniques to design and structure a database, as well as a variety of data modeling tools that you can use. You should explore these techniques and decide on the most suitable one for your project at the end of the conceptual phase. These data modeling methodologies define how the database gets structured and closely relate to the type of formatting or technology you can use to manage your data sources.
For example, many people now default to graph modeling because it’s new and popular, even when a simple relational model would suffice. Understanding the most popular techniques for the process of data modeling helps you avoid such mistakes.
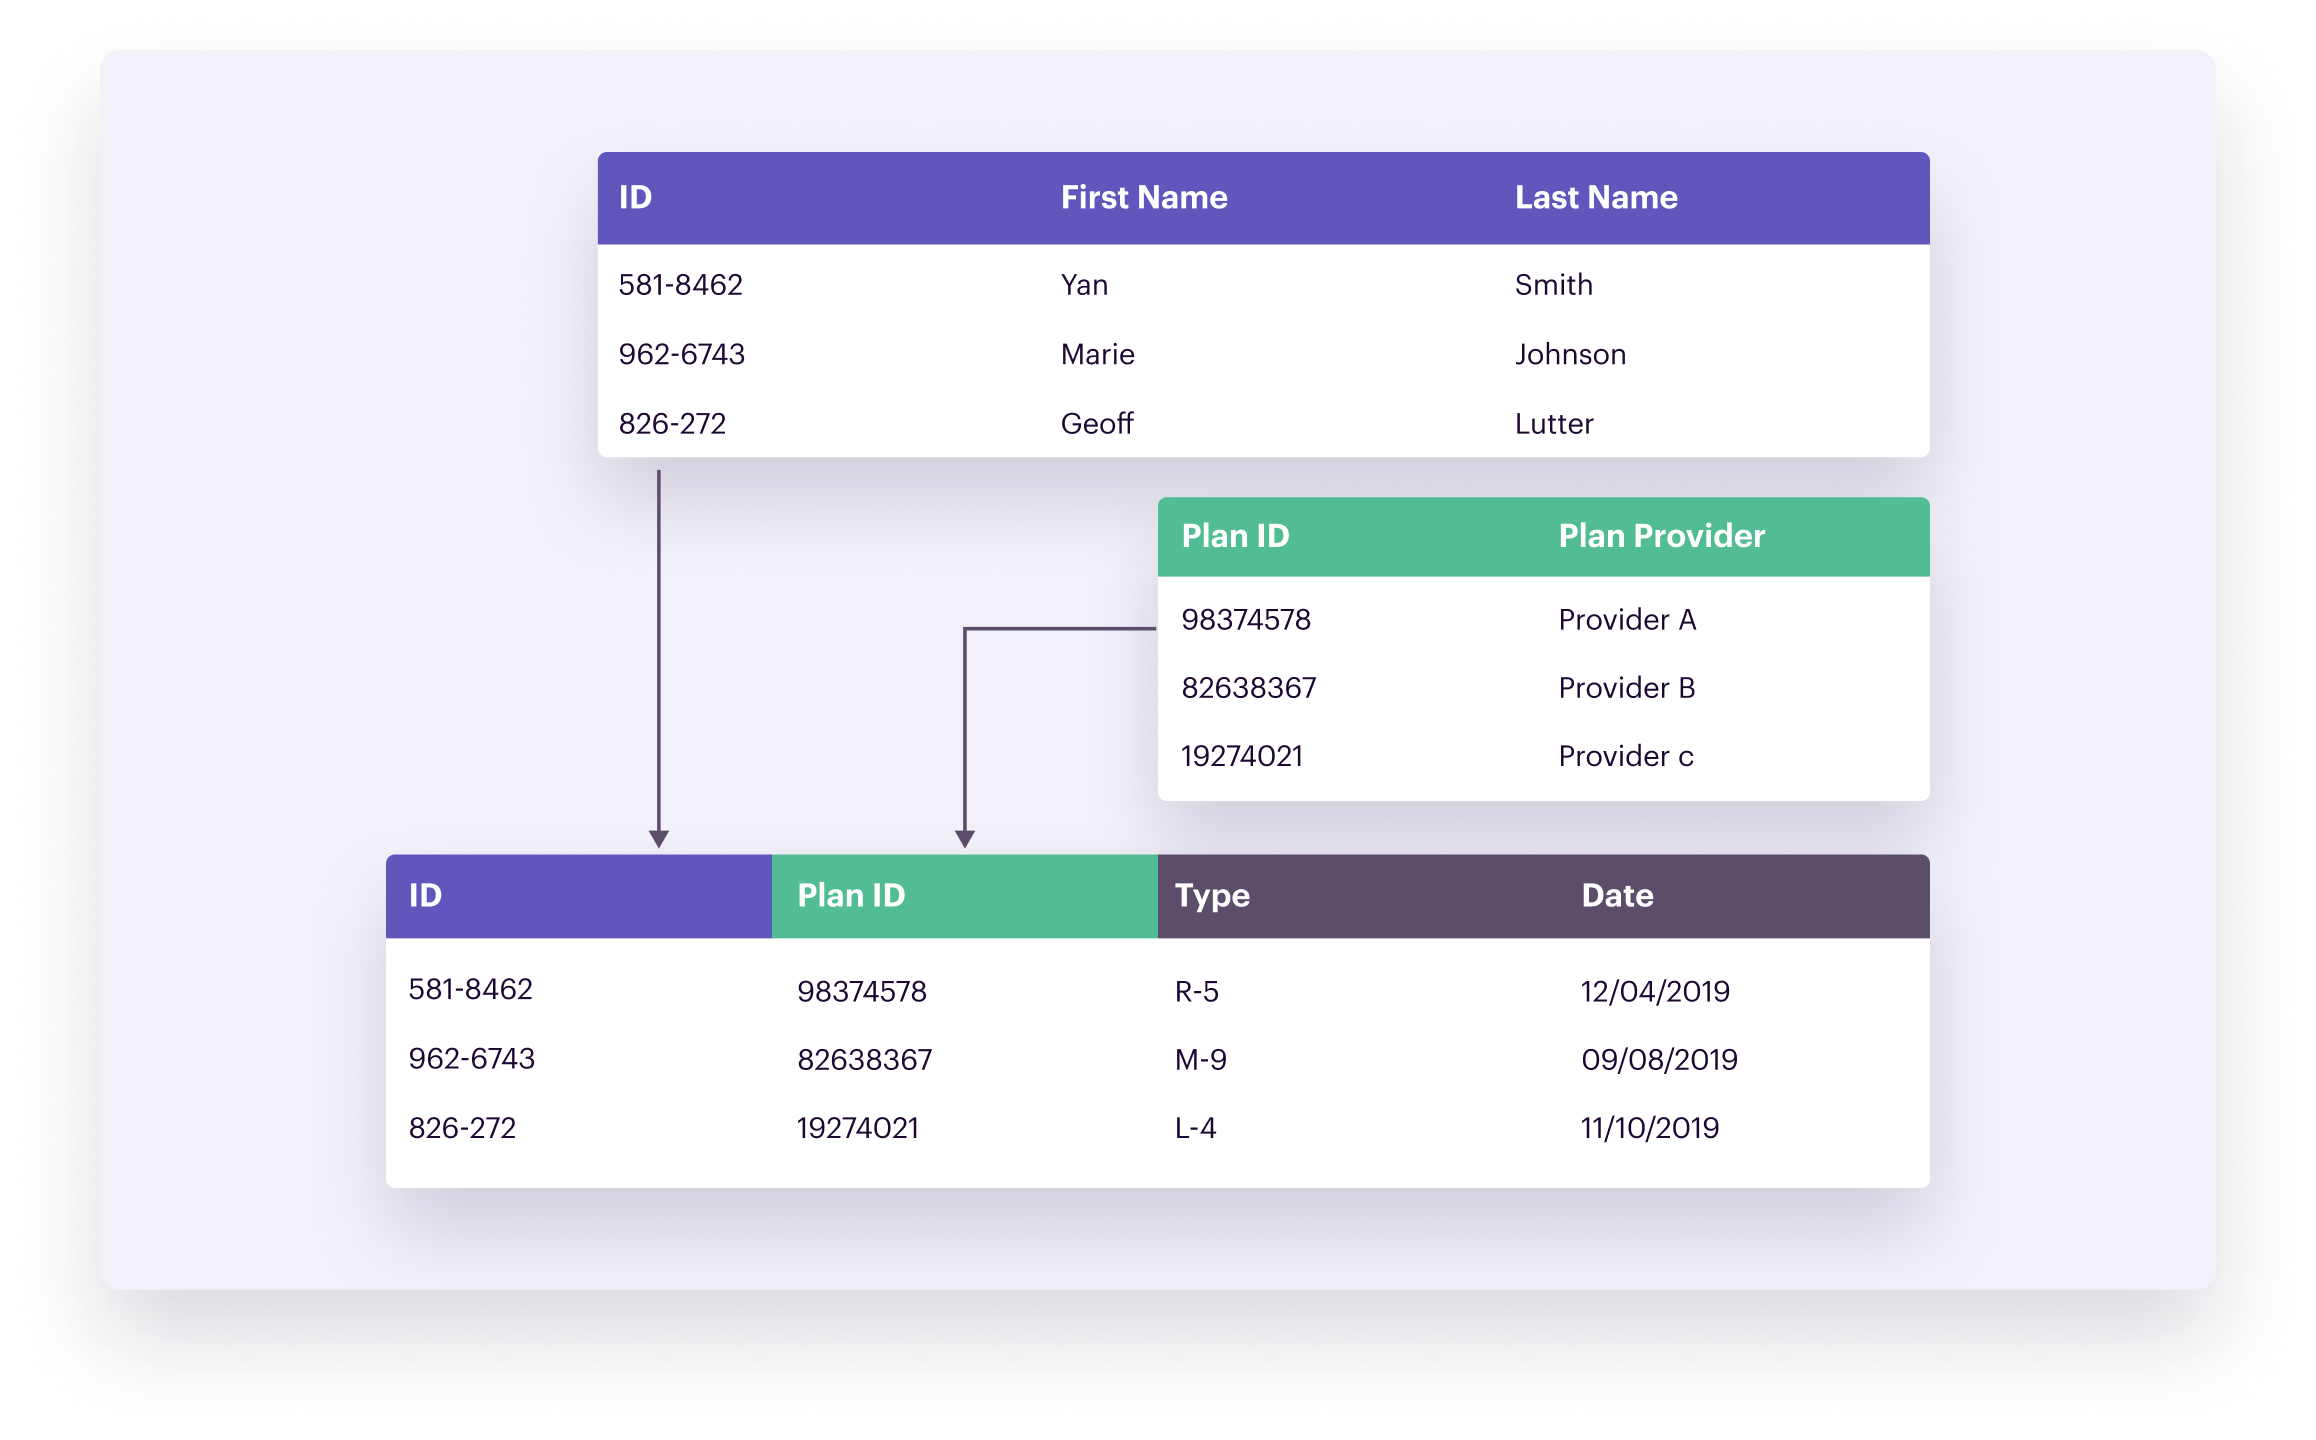
In a relational data model, data gets stored in tables, of which specific elements link to information in other tables. Entities can have a one-to-one, one-to-many, or many-to-many relationship.
Relational databases often use SQL (Structured Query Language), a programming language, for accessing and managing data. They’re frequently used in point-of-sale systems, as well as for other types of transaction processing.
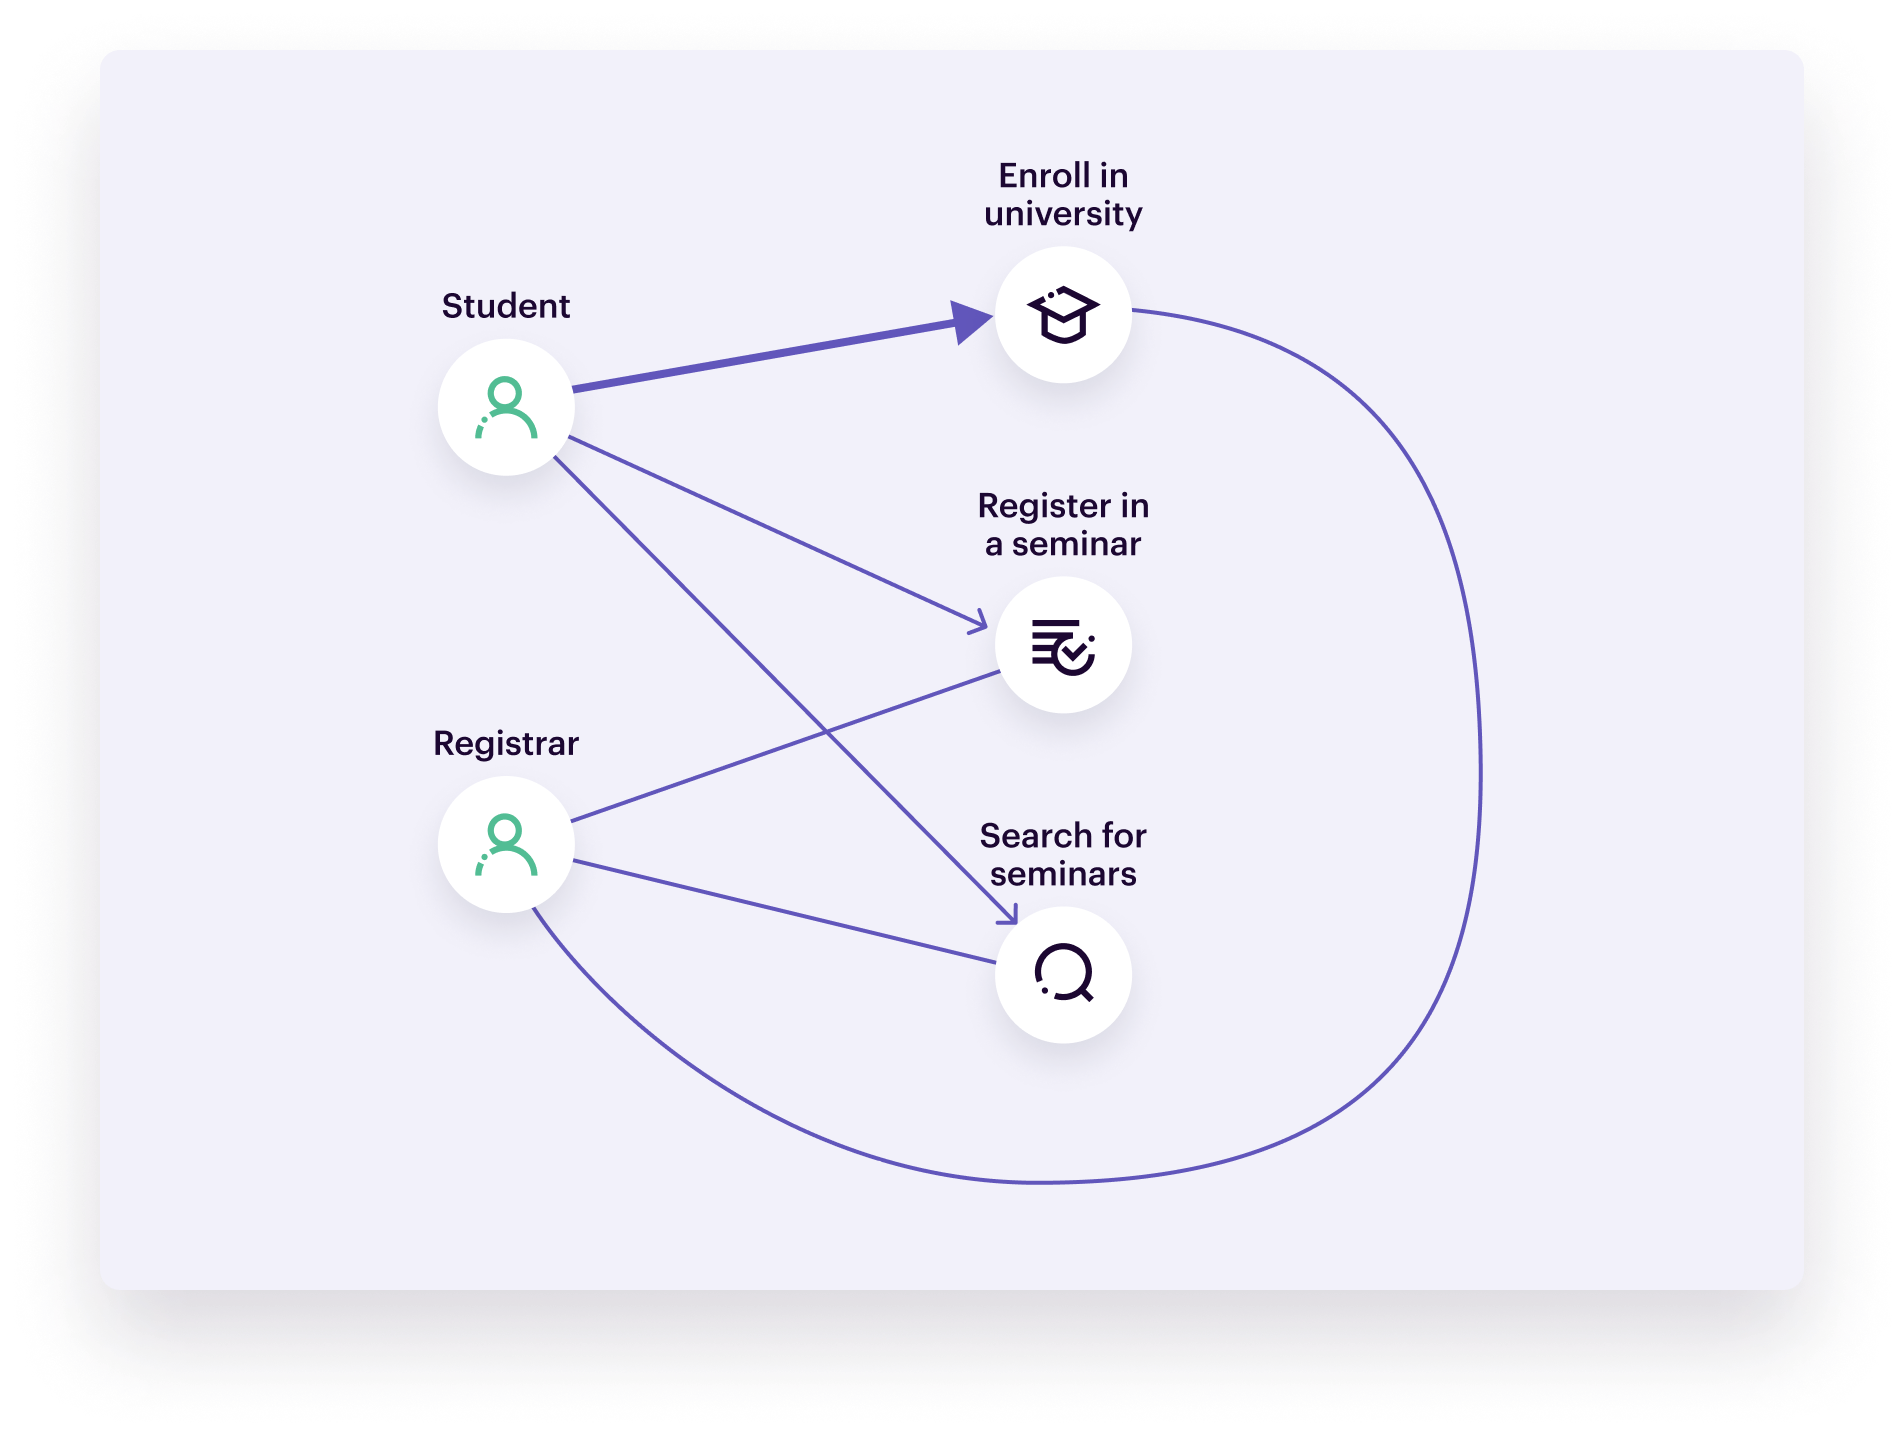
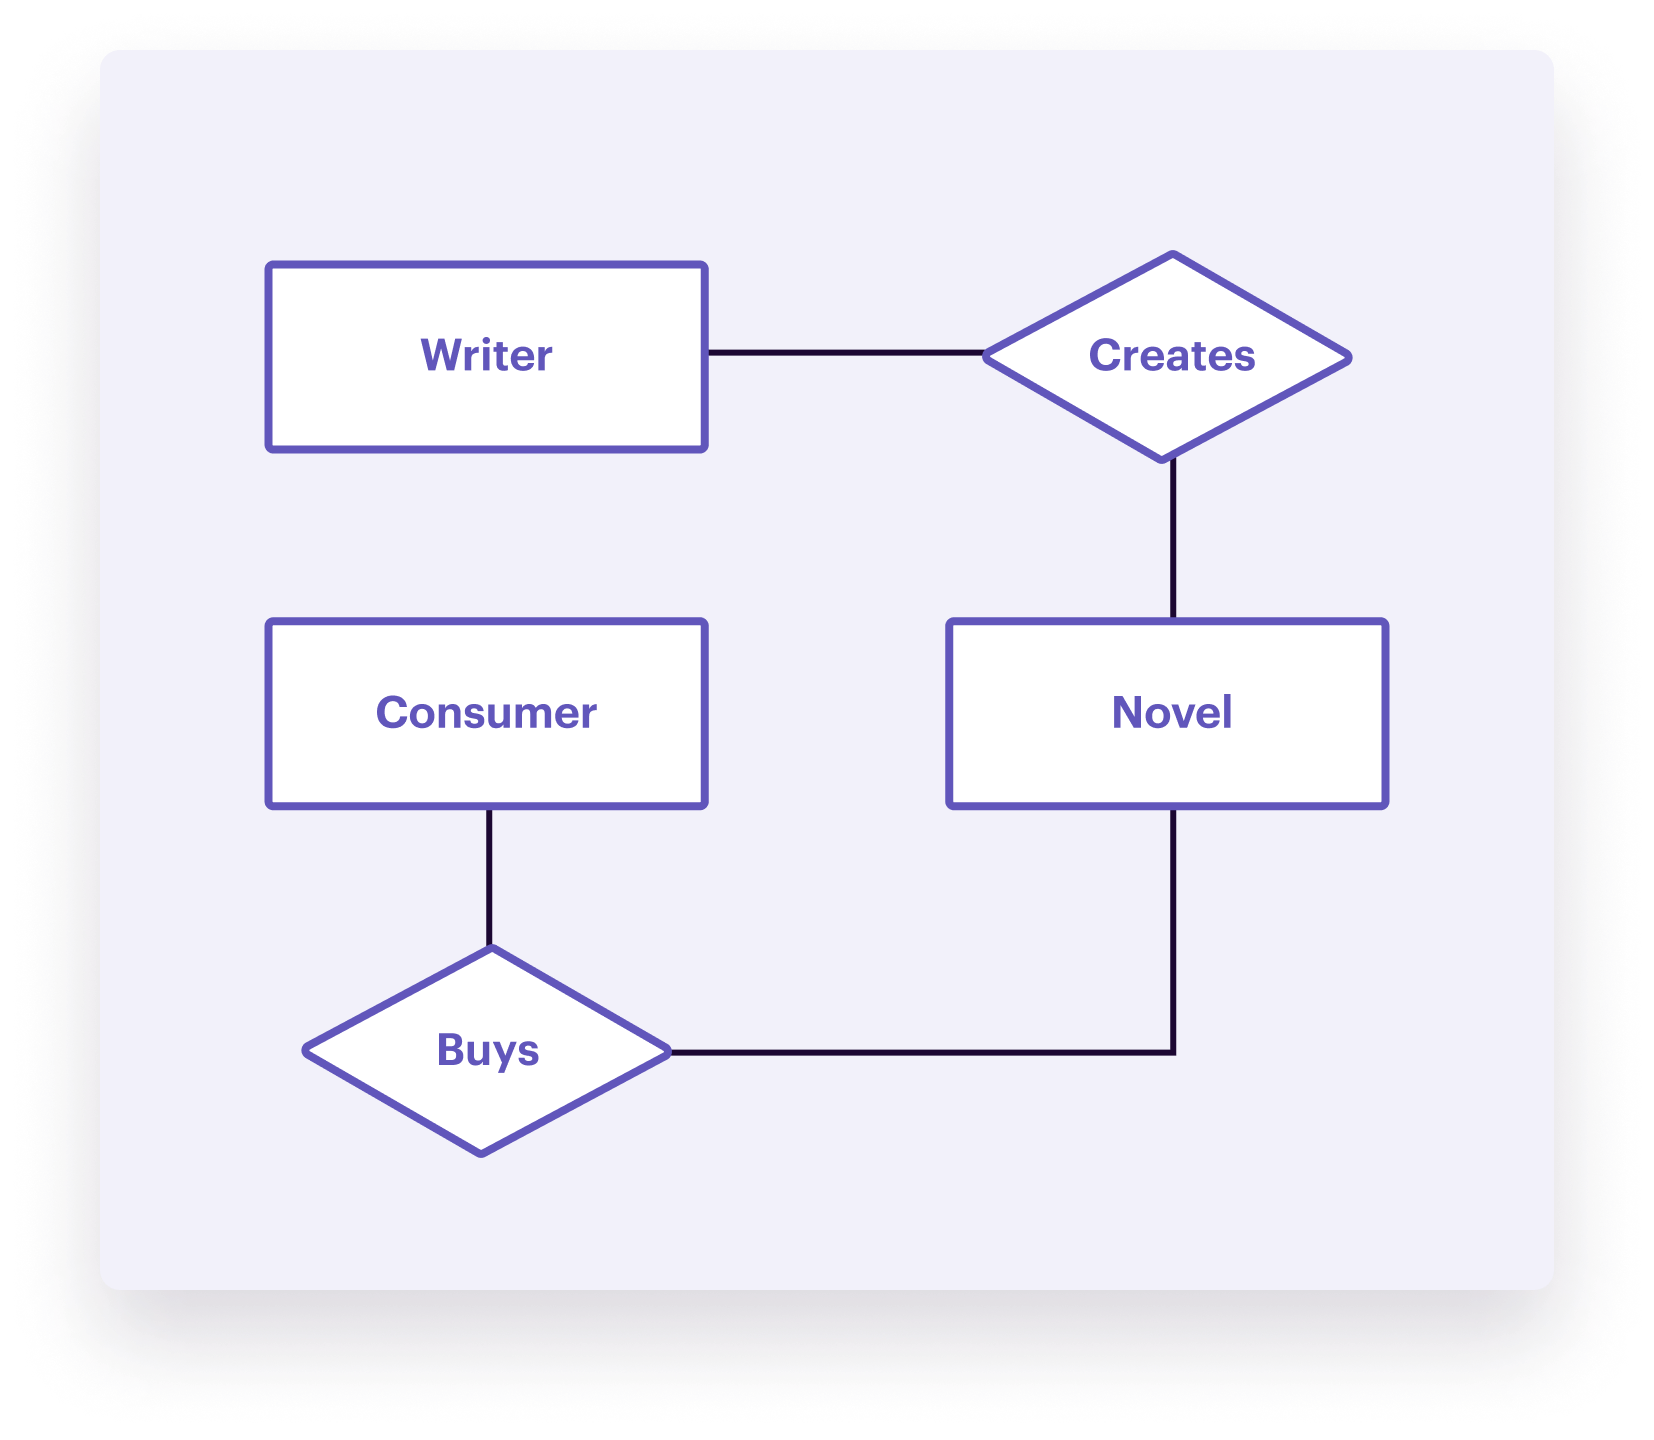
The Entity-Relationship Model—sometimes referred to as ER model—is similar to the relational model. It is a relationship diagram that visualizes the different elements in a system but without going into technical details. You can use the ER model during the conceptual phase to align technical and non-technical stakeholders.
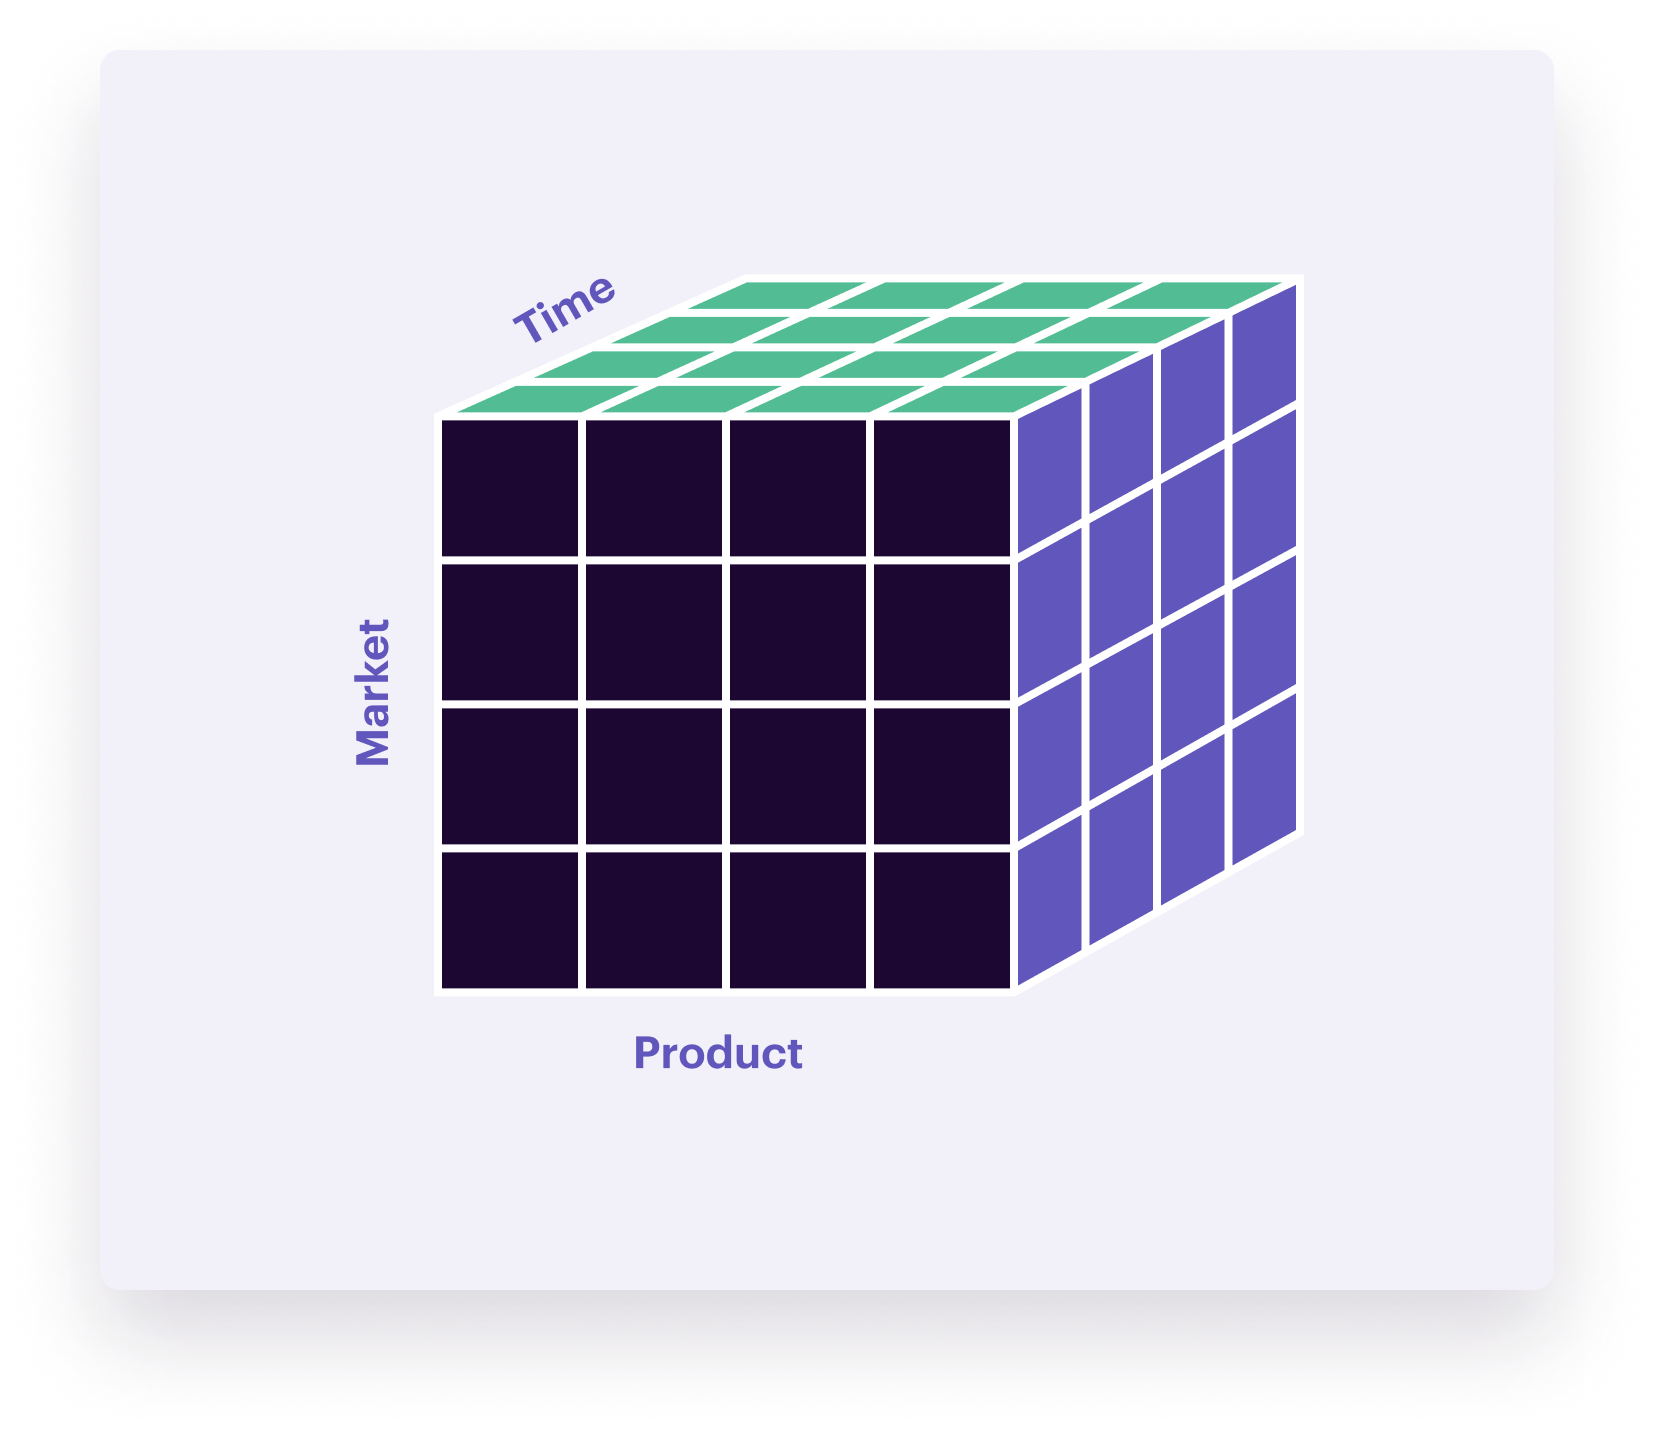
To understand dimensional models, picture a cube. Each side of the cube represents an aspect of the data you’re trying to capture.
For example, suppose your business sells multiple products to different customer segments, and you want to evaluate sales performance over time. You can visualize this as a data cube, with dimensions for time, products, and customer segments. By traveling up, down, left, and right on the axes of the cube, you can make comparisons across all those dimensions. You’ll see how the sales of each of these products compare to each other and different customer segments at any point in time.
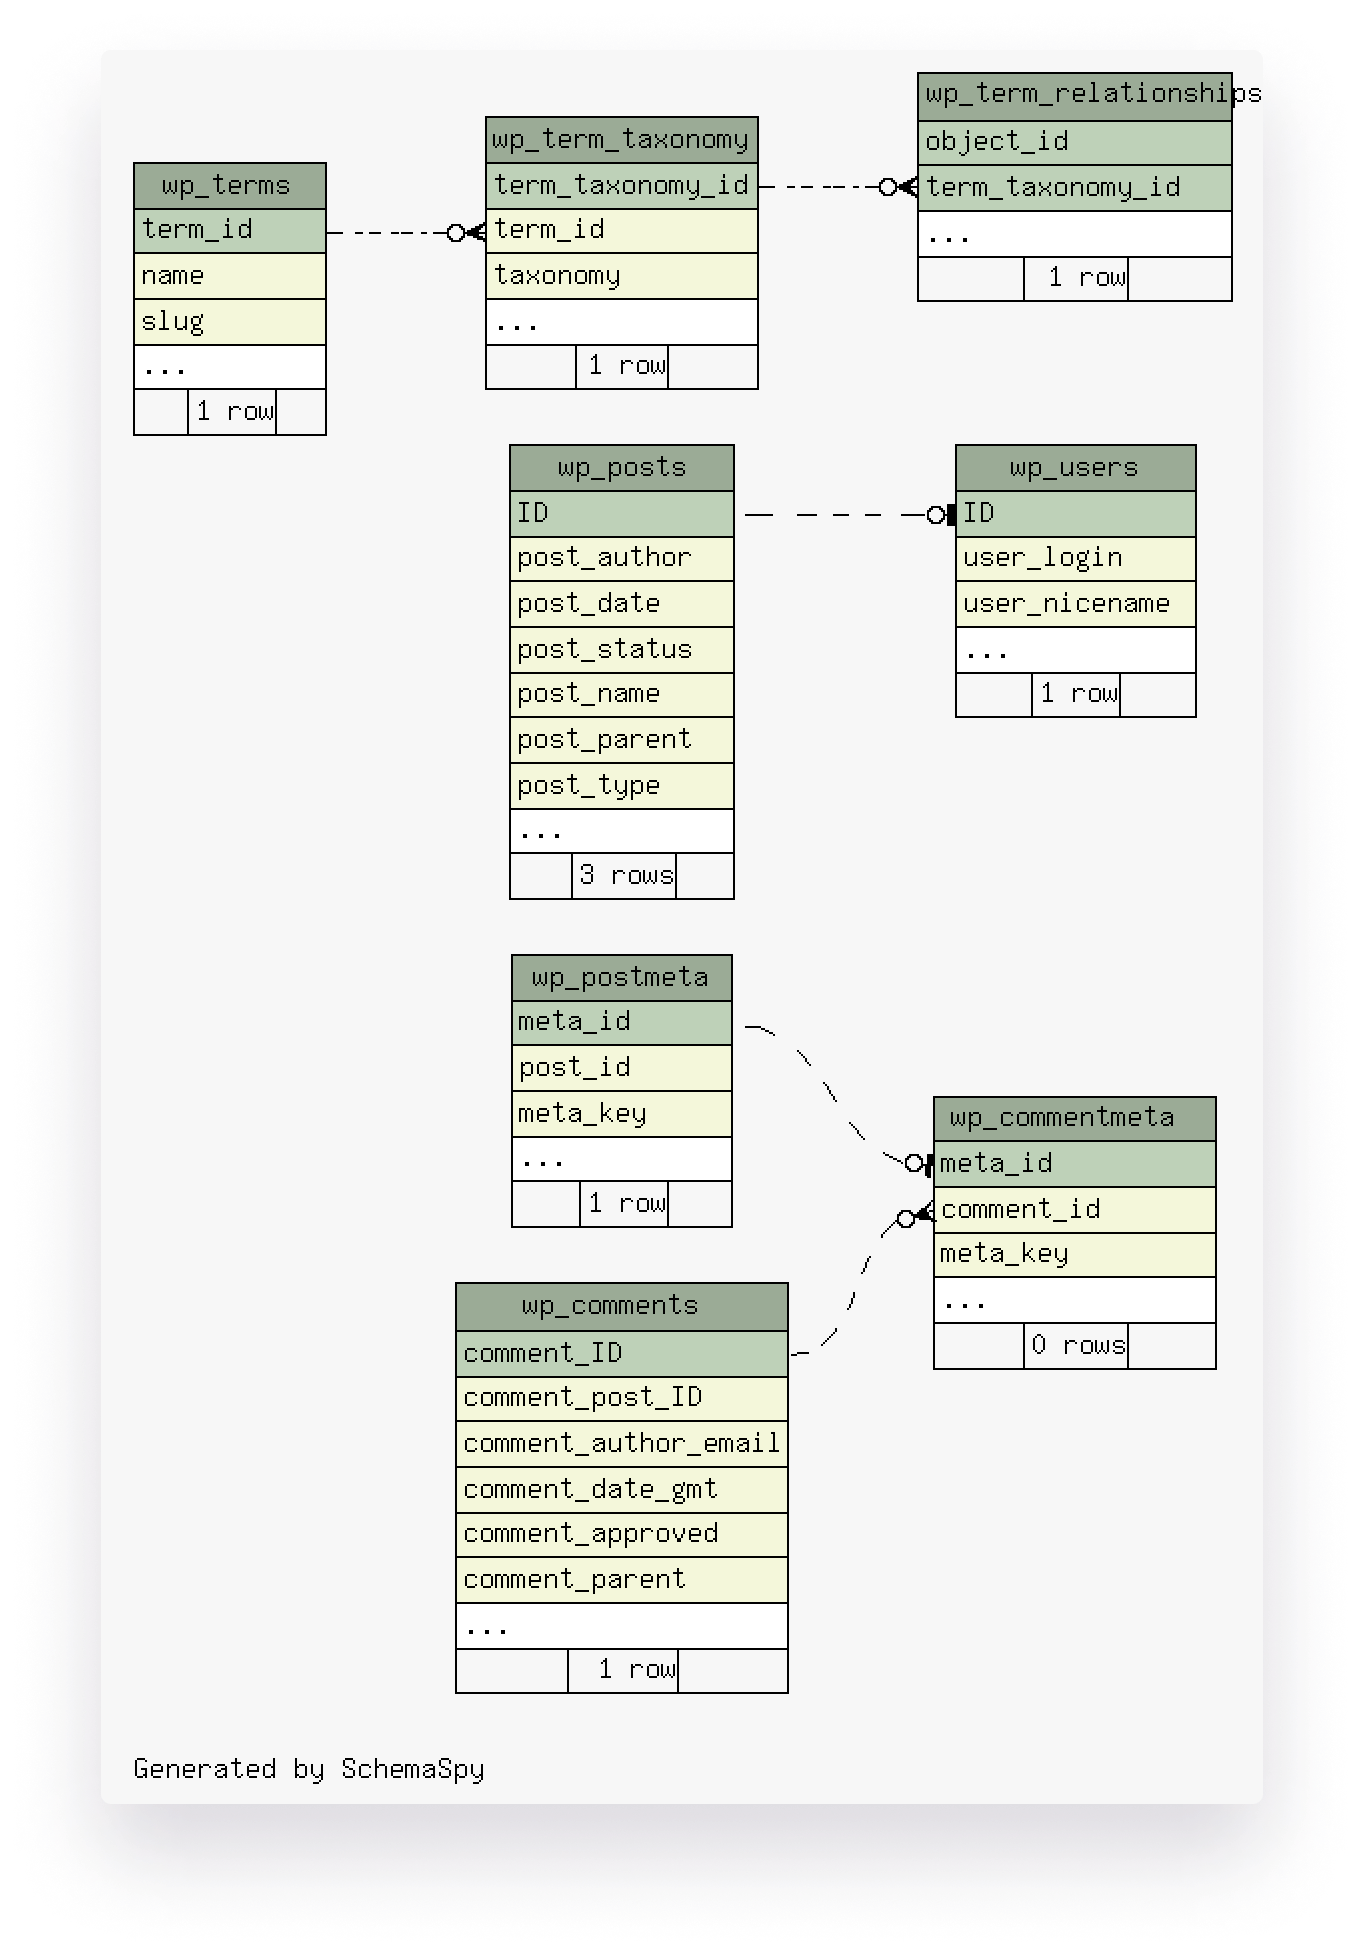
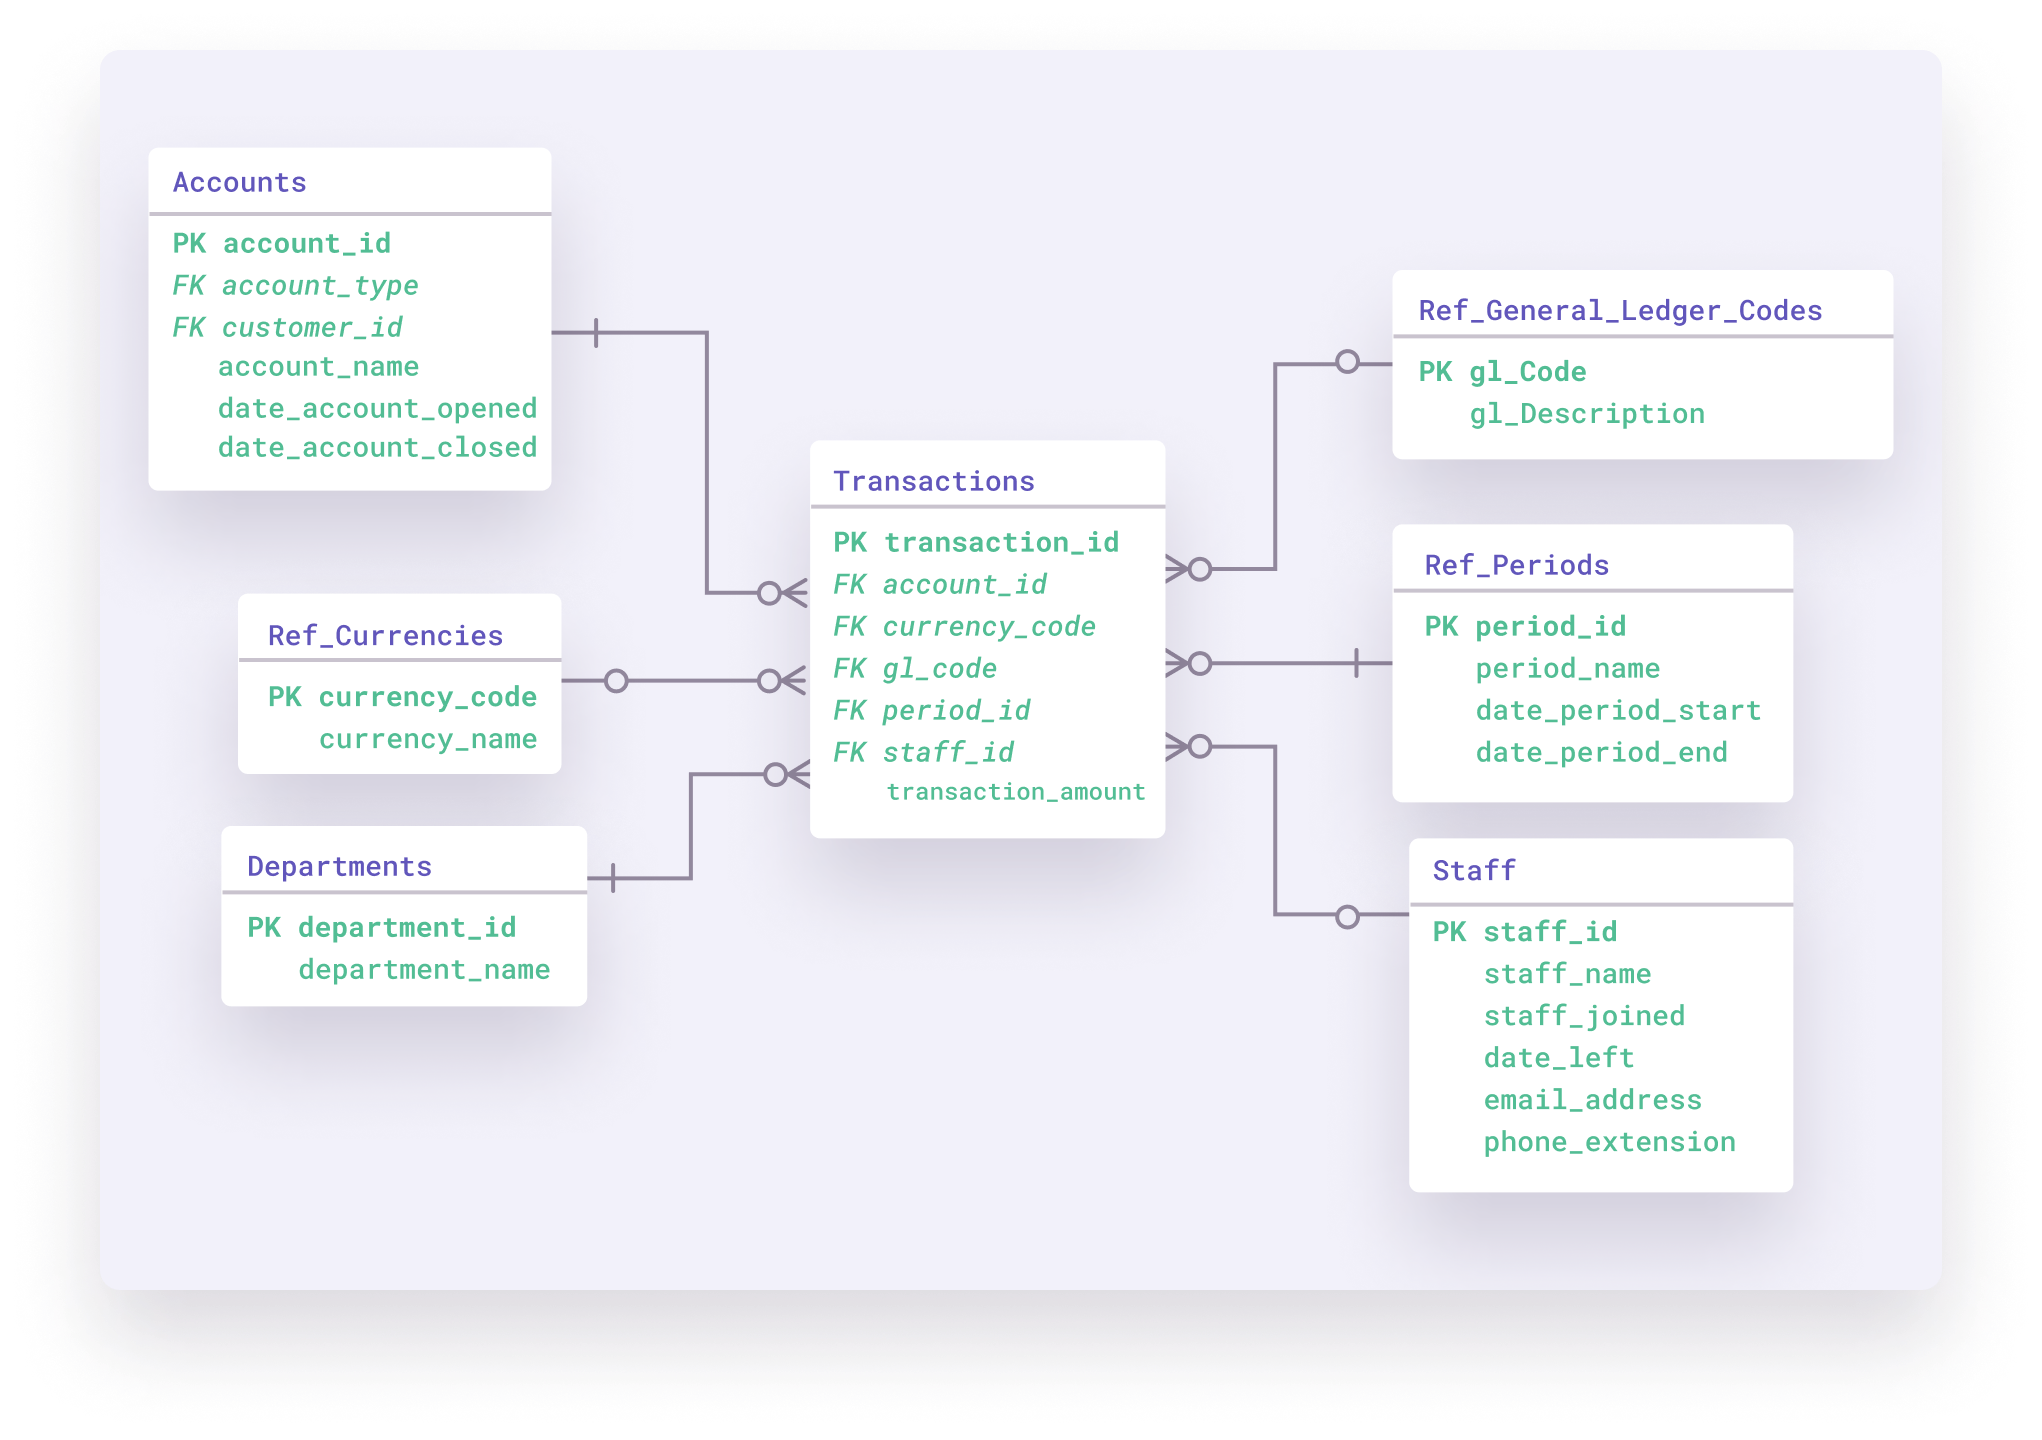
You use the cube model during the conceptual phase. One of the most frequent manifestations of such a cube in the logical stage is the “star schema,” like the one below. At first, it might look like a relational model. Still, the star schema is different because it has a central node that connects to many others.
During the conceptual phase, most people sketch a data model on a whiteboard. Such a sketch resembles the graph model. It consists of “nodes” and edges—a node represents where the data is stored, the edge the relation between nodes. It’s also the main advantage of this approach: “what you sketch on the whiteboard is what you store in the database.”
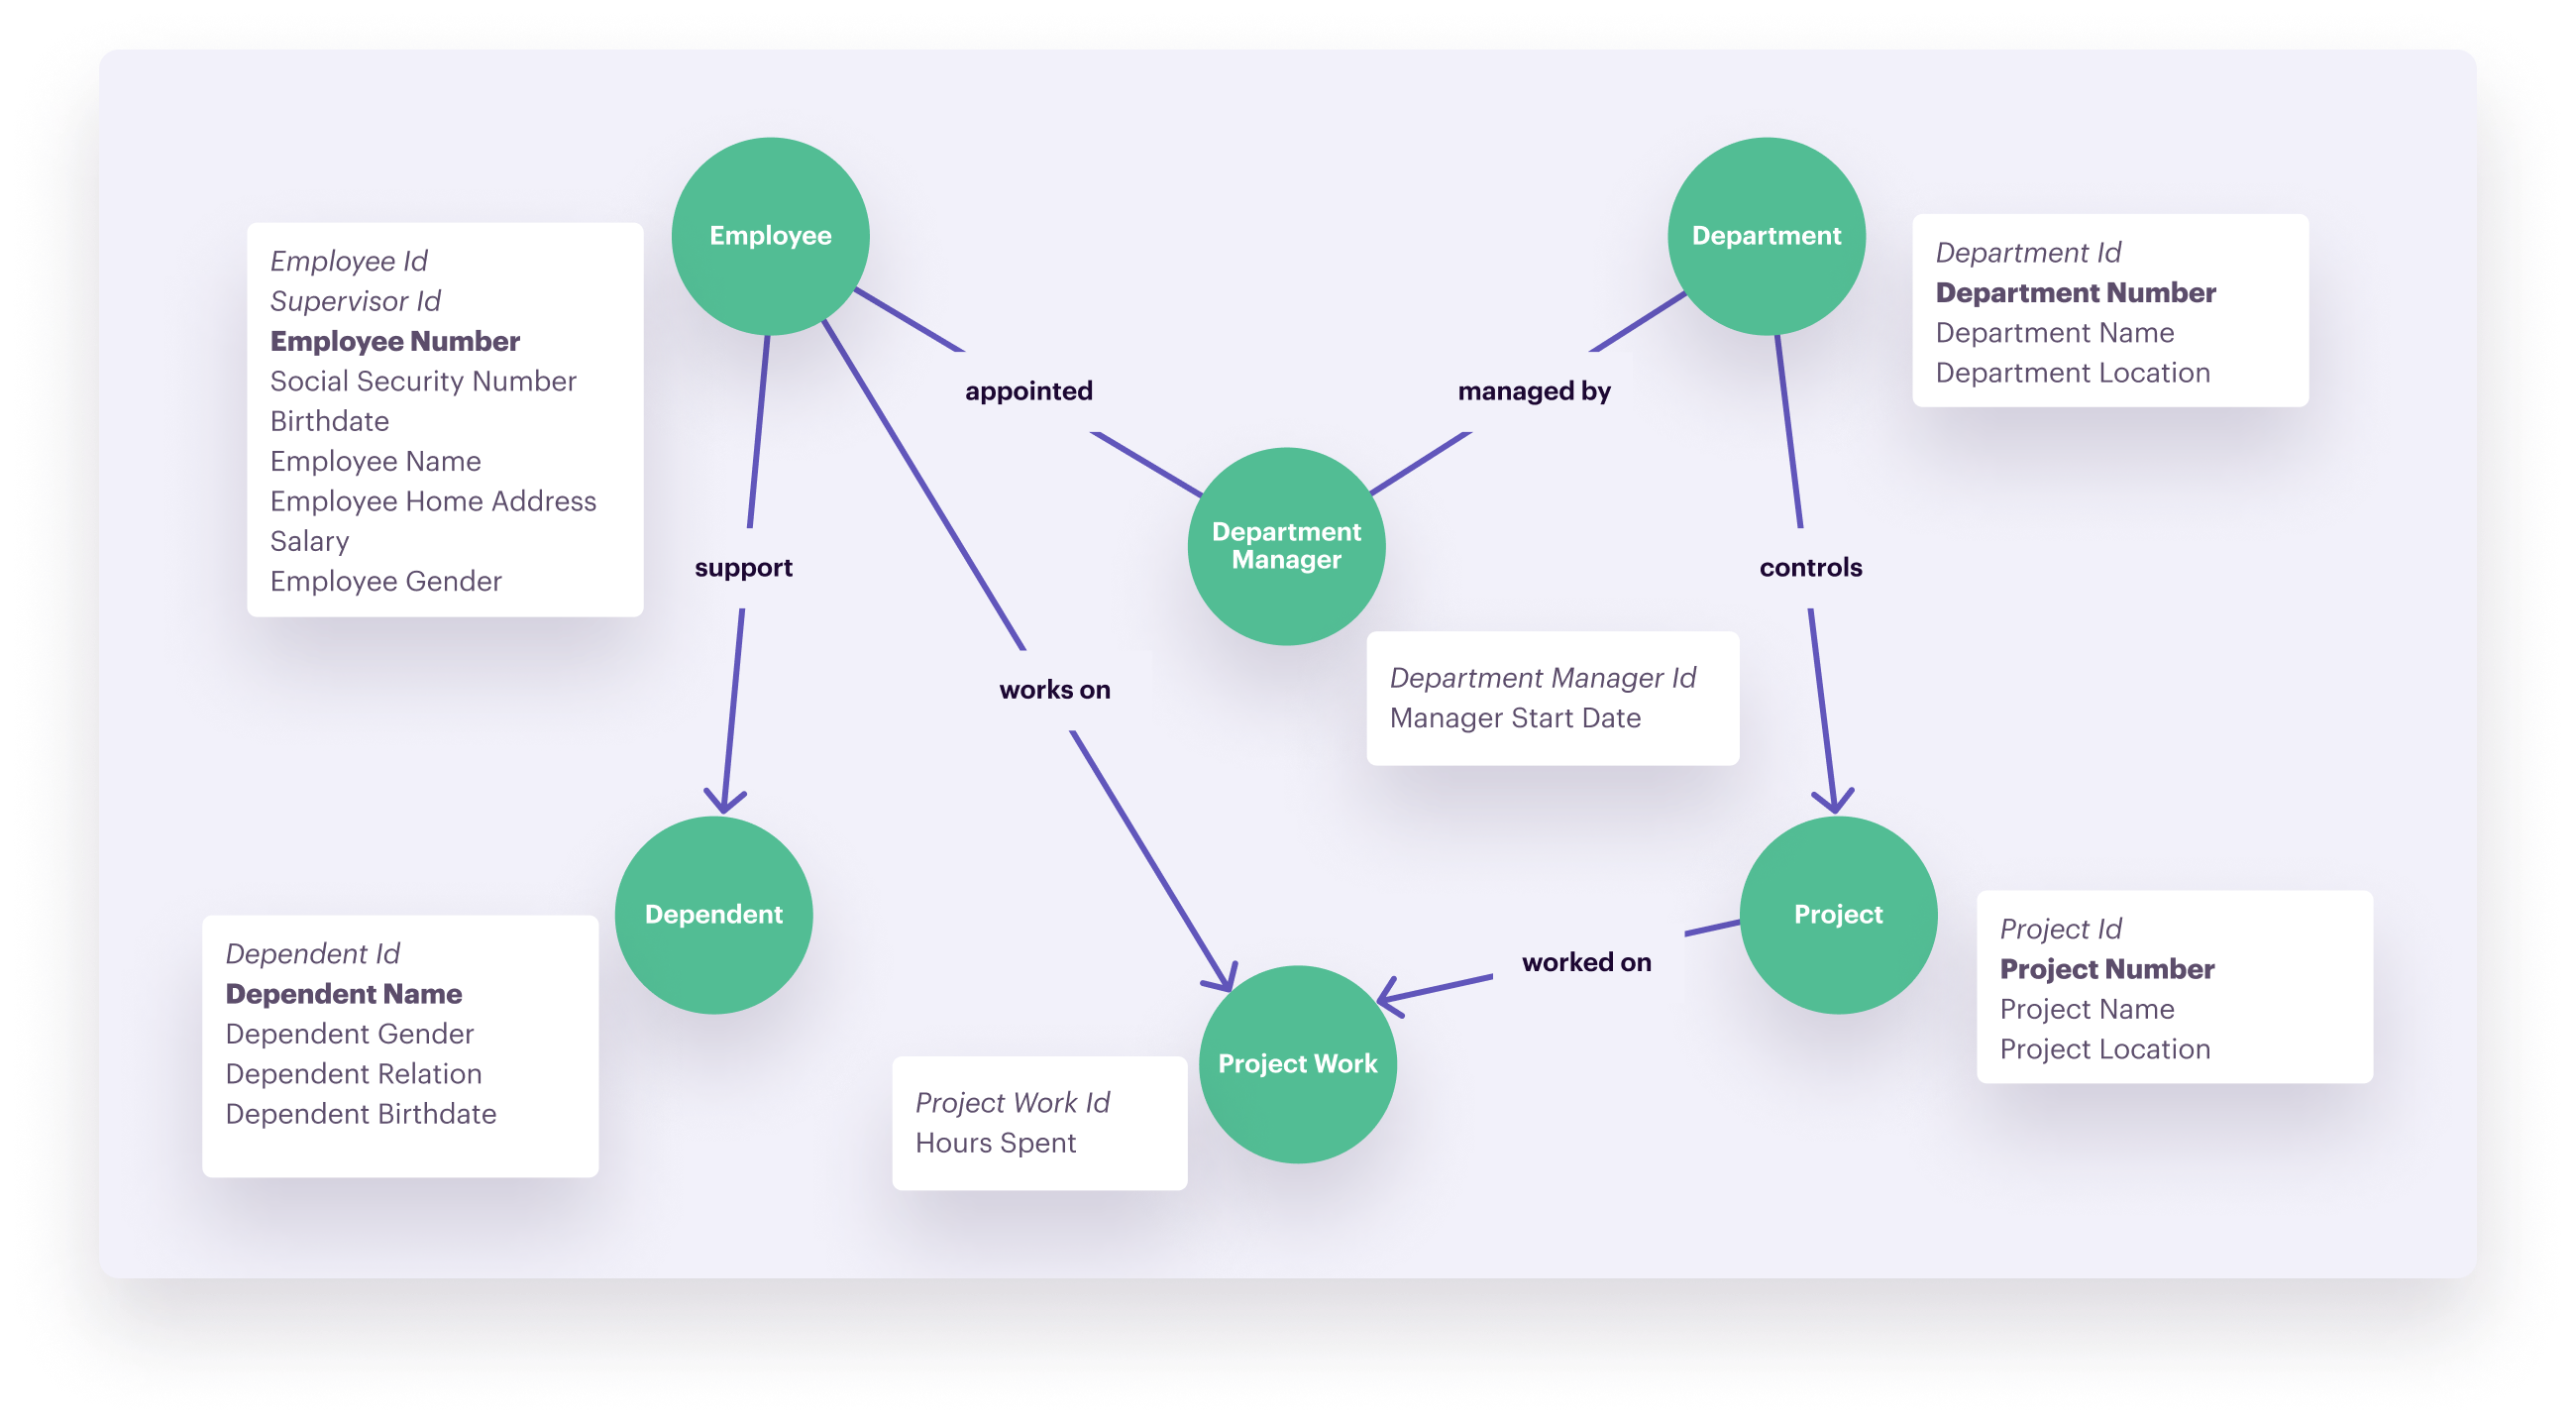
Other techniques require you to translate the output from the conceptual phase into a different format for the logical and physical implementation—for example, going from an ER to a relational model or from a cube model to a star schema. Not so with graph models. You can implement them straight away using technology like Neo4j, a native graph database platform.
Data modeling can quickly become a complex process. From choosing which data model is best for each use case, to getting into the nitty-gritty of naming conventions, we’ve compiled a list of best practices to follow to ensure all goes smoothly.
Data models are meant to support a specific business objective or goal. When building out your data model, it’s essential that you first identify the key stakeholders involved so that they can provide input, and the scope of the project (e.g., the overarching goal or objective).
As an example, if the overarching goal was to launch a win-back campaign to re-engage customers you would have to define:
Key data entities (e.g., customers behavioral history like purchases, engagement, page views)
The relationship between entities (e.g., relating customer transactions to their engagement with win-back campaigns)
Whether you want to focus on recently churned customers, high-lifetime value customers at risk of churning, etc.
Naming conventions are a set of rules and guidelines on how your organization will identify, format, and categorize the completion of events. Having a standardized approach to naming conventions is essential to avoid tracking duplicate events and to protect the accuracy of your data.
We recommend following the object-action framework when it comes to naming conventions. Using the example of “Page Viewed,” page would be the object and viewed would be the action someone performed on that object.
We also recommend tracking events along with properties to provide more context (e.g., instead of just seeing how often people viewed a product page, you could drill down into which products people were visiting the most).
Normalization is the process of organizing data into tables, and defining the relationship between those tables, to eliminate redundancies or data anomalies. Normalization helps protect the accuracy and integrity of data, especially when data is being integrated from multiple different storage systems within an organization.
“Normal forms” are rules and guidelines for normalization to help organize and structure data, which stipulate things like a table’s cells should only have individual, indivisible values (rather than lists or arrays) – which would be the First Normal Form or 1NF.
Denormalization is a technique that introduces redundancy into a database after normalization has already been applied. At first glance, this might seem counterintuitive – why would you want to introduce redundancy and risk data integrity?
First, denormalization can help optimize query performance by reducing the need to join multiple tables. This can be helpful for time-sensitive projects, or to simplify reporting with large datasets.
However, as referenced above, there are tradeoffs involved with denormalization, like unintentionally creating data inconsistencies, increased storage costs, and more complex maintenance.
Indexing helps improve query efficiency and data retrieval. In the simplest of terms, indexing essentially provides a reference of where data can be found in a database.
Indexing is a critical step of data modeling because it helps teams think through how data will be queried, and ensures that the database continues to perform even as the business scales.
Let’s go back to the example of an e-commerce company. Their database would include records of all their stock, customer orders, product descriptions, and more. Without indexing, if someone wanted to see all the orders for a specific product, they would have to scan through every order, one at a time. But if they were to create an index on “Product Names,” they could then easily query orders containing a specific product for faster results.
Data modeling isn’t without its challenges. From unclear objectives to ensuring data quality at scale, these are a few of the most common issues that teams tend to encounter.
Business goals and objectives will change over time. People will leave teams, and new stakeholders will be introduced. While these moments of change are to be expected, it doesn’t make data modeling any easier.
Ambiguity surrounding the purpose of your data model, and the insights your organization hopes to gain from it, make it difficult to evolve with changing expectations. How can you be successful when there’s no clear picture of what success looks like?
To remedy this, make sure there is clear documentation and communication around the overarching objectives and the KPIs being used to measure success.
Finding the right balance between normalization and denormalization can be tricky. While it will ultimately depend on the specific needs of your business and project, here are a couple key points to consider:
Normalization is best when data integrity is crucial and write operations are frequent (as data would be stored in fewer places).
Denormalization can be beneficial if storage space isn’t a concern, read performance is paramount, and you need to reduce query latency.
You can be meticulous in defining the relationship between data entities, but if the data that’s being fed into those models is missing, inaccurate, or redundant, all that work won’t amount to much insight.
Ensuring data quality and consistency can be a difficult task. For one, data volume has skyrocketed in recent years. With businesses collecting data from multiple sources and in multiple formats, the process of cleaning, validating, and transforming data becomes more complex.
Customer Data Platforms (CDPs) like Segment can do much of the heavy-lifting during data modeling projects by simplifying data cleaning, organization, and storage.
Segment Connections makes it easy to collect, clean, and organize your customer data. With hundreds of prebuilt connectors, businesses can quickly integrate all the tools in their tech stack to seamlessly orchestrate the flow of data. (As well as build custom Sources and Destinations as needed.)
Segment Protocols helps protect the integrity of your data at scale. Functionality like real-time data validation allows you to diagnose data issues before they enter downstream tools and corrupt reporting.
Issues like duplicate entries or misnamed events are blocked at the source, and quickly flagged for further investigation – ensuring your entire organization is aligned around a single source of truth.

Our annual look at how attitudes, preferences, and experiences with personalization have evolved over the past year.
An Entity-Relationship Diagram is one example of a data model. Using the example of an e-commerce store, an Entity-Relationship Diagram would define the different entities and how they relate to each other – like customer data, order data, and product data. Each customer could order one or more products (representing a one-to-many relationship). Each order could contain one or more products, and each product could be in one or more orders (which would be a many-to-many relationship).
The main steps of data modeling include: - Setting clear expectations and guidelines around the scope of the project, overarching business goals it ties into, and key stakeholders. - Establishing clear naming conventions for data to ensure accuracy. - Choosing the right kind of data model (e.g., graph data modeling, dimensional data modeling, relational data modeling).
Data modeling and database design have similar goals, in that they’re both concerned with how data entities relate to one another, and how they’re stored and organized. But a key distinction is that data modeling is more focused on the planning and conceptualization, acting as a kind of blueprint for data teams to follow. Database design is the process of turning the data model into a database schema. It focuses on how data will actually be stored, organized, and accessed.
Data modeling helps define the relationship between different data points, and dictate how it should be stored for better organization and deeper understanding. Data modeling helps streamline data retrieval and querying for faster analysis.