How VWO used product analytics to increase new feature adoption and reduce churn
By Doug Roberge
If you build it, they will come. While maybe true for amusement parks or $5 all-you-can-eat buffets, this adage does not apply to new software features.
A lot goes into building, designing, and marketing a new feature in your app. If one piece of the equation fails, your stellar feature could quickly turn into a dud.
Rahul Jain, longtime PM at experience optimization platform VWO, understands this better than most. He has rolled out countless features during his 5-year tenure and knows first-hand what makes some products more successful than others. But, it wasn’t always so easy.
In this story, we’ll share how Rahul used analytics to build a data-driven organization, improve product adoption by up to 15x, and prevent churn.
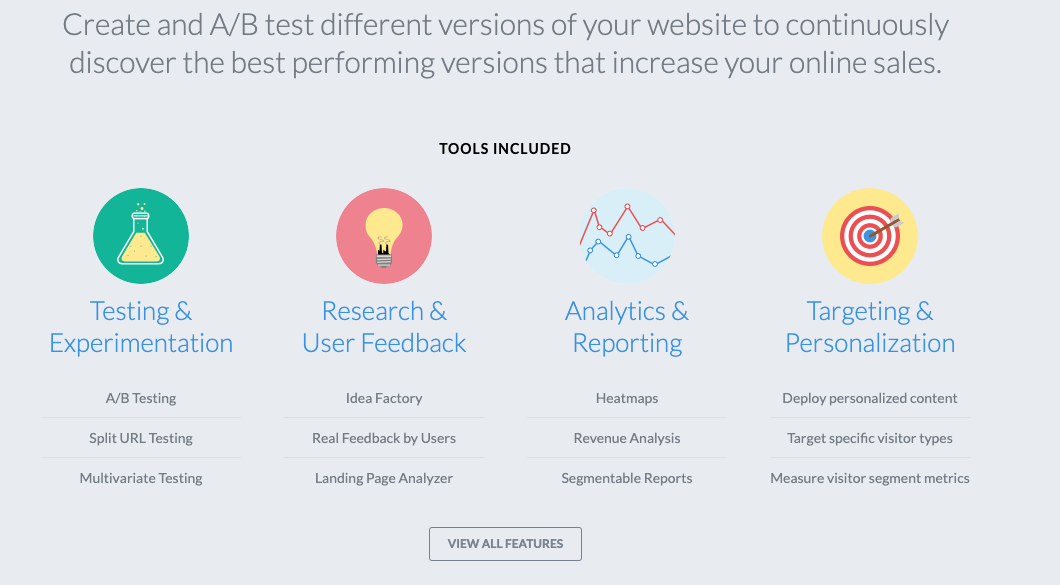
As with any SaaS platform, VWO is in a steady state of change. They build new features, get customer feedback, and then, naturally, build some more. Since Rahul joined the team, VWO has evolved from an A/B testing platform to a complete experience optimization platform that offers deep insights (like funnels, session recordings, and heatmaps) and push messaging, among a host of other things.
VWO product offering, September 2014
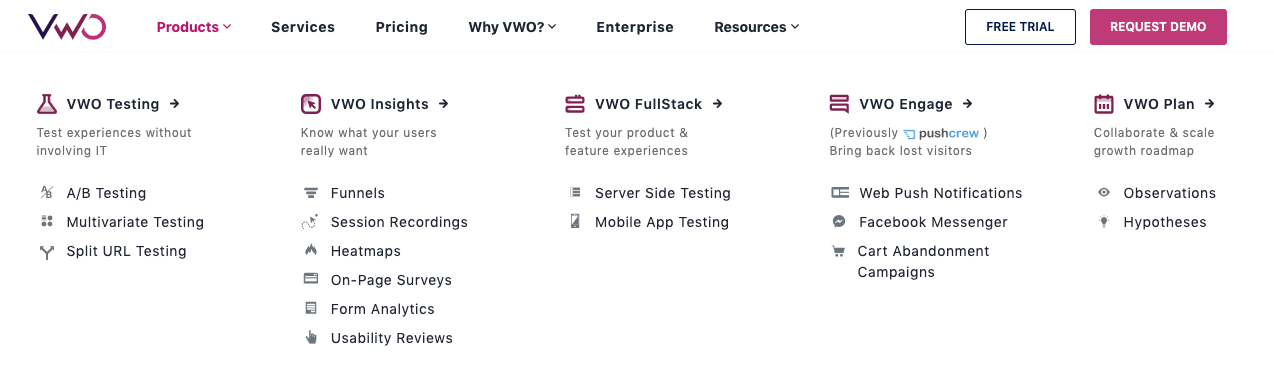
VWO product offering, September 2019
At first, VWO’s product analytics were less than stellar. Rahul was only able to track page views. Most of the actions users were taking in the app weren’t being tracked anywhere. For example, they weren’t tracking key user actions in the setup flow like URL selected and Audience created, which are critical in understanding product adoption and engagement. At that point, his team was only consistently tracking 10 events, which only covered one feature in the app.
“We knew that we couldn’t scale things on assumptions and intuition. We needed to be data-driven and let the data speak for us when it came time to manage stakeholders and make product decisions.”
Rahul needed a solution that would work with his existing architecture, require limited engineering resources (they had a product to build!), and provide granular product analytics. He did this by using Segment to collect user behavioral data in the VWO app and send that data in to their data warehouse, BigQuery. He then was able to run analysis and set up reports in their product analytics tool, PowerBI.
With analytics in place, it became much simpler to get an accurate view of how well new features were performing. Instead of just being able to see what pages a user engaged within the app, Rahul and his team implemented analytics for every element of the product. For example, they could now track each step required for creating and analyzing an A/B test, such as segmentation and targeting.
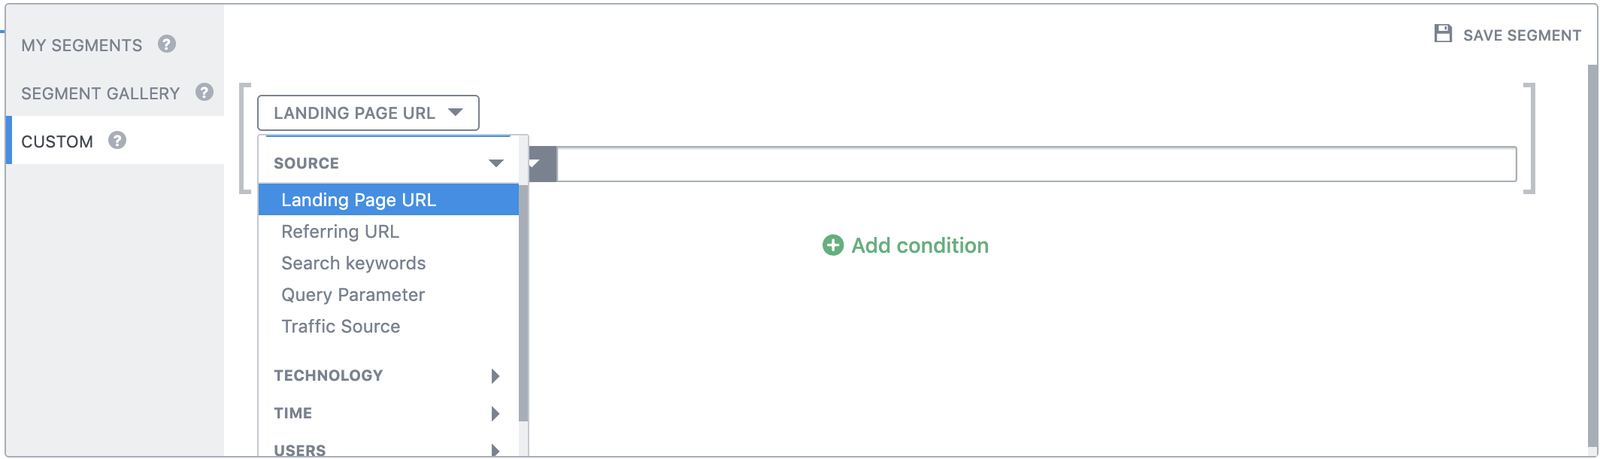
Elements in the VWO segmentation setup flow that can now be tracked
For VWO’s product team, one of their key KPIs is product activation rate — how many users are using a new product and at what frequency. To keep a pulse on that, they set up reports for every feature. In an ideal world, all features would just naturally land in the top right corner of the chart below. However, it’s rarely that simple.
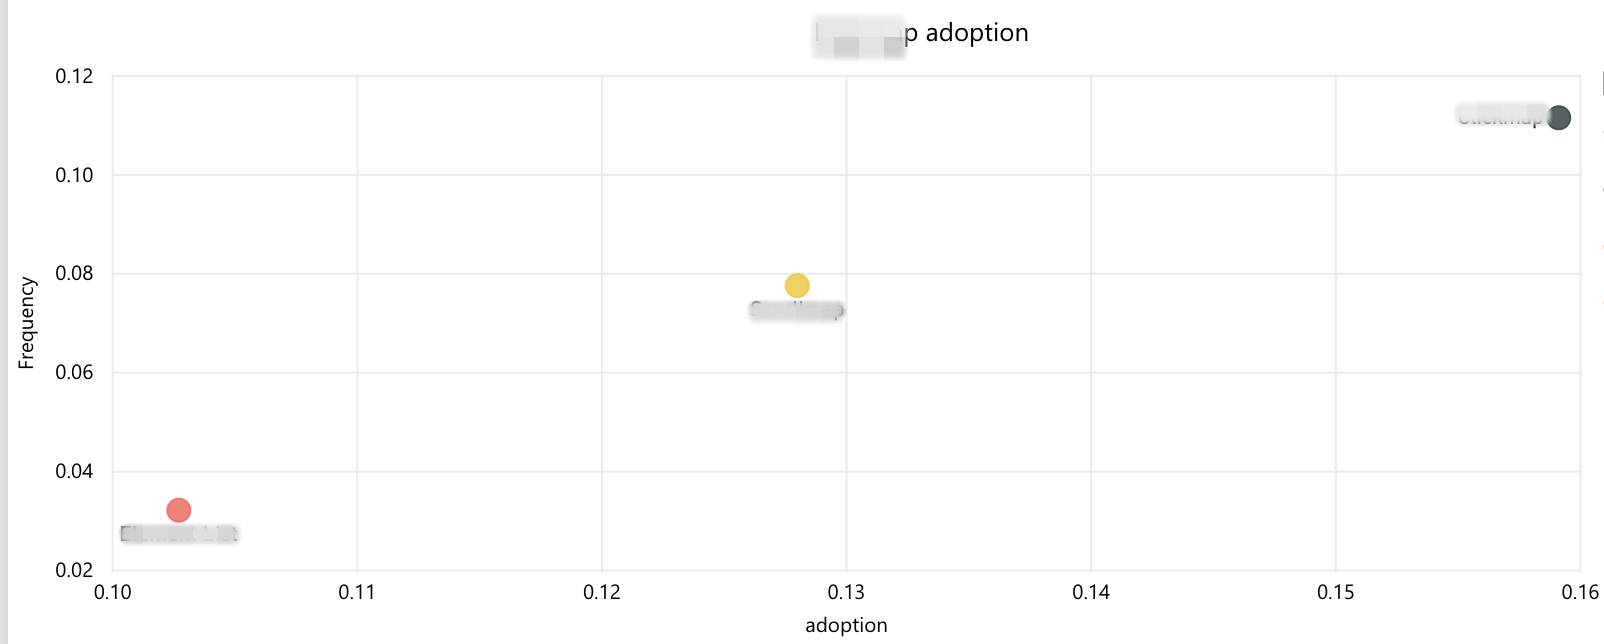
Adoption vs. frequency graph of a product feature
For the less successful features — the features that wound up in the bottom left of the chart — they could start exploring the reasons behind it. Are customers able to find the feature? Do customers know how to use the feature? Do customers need the feature?
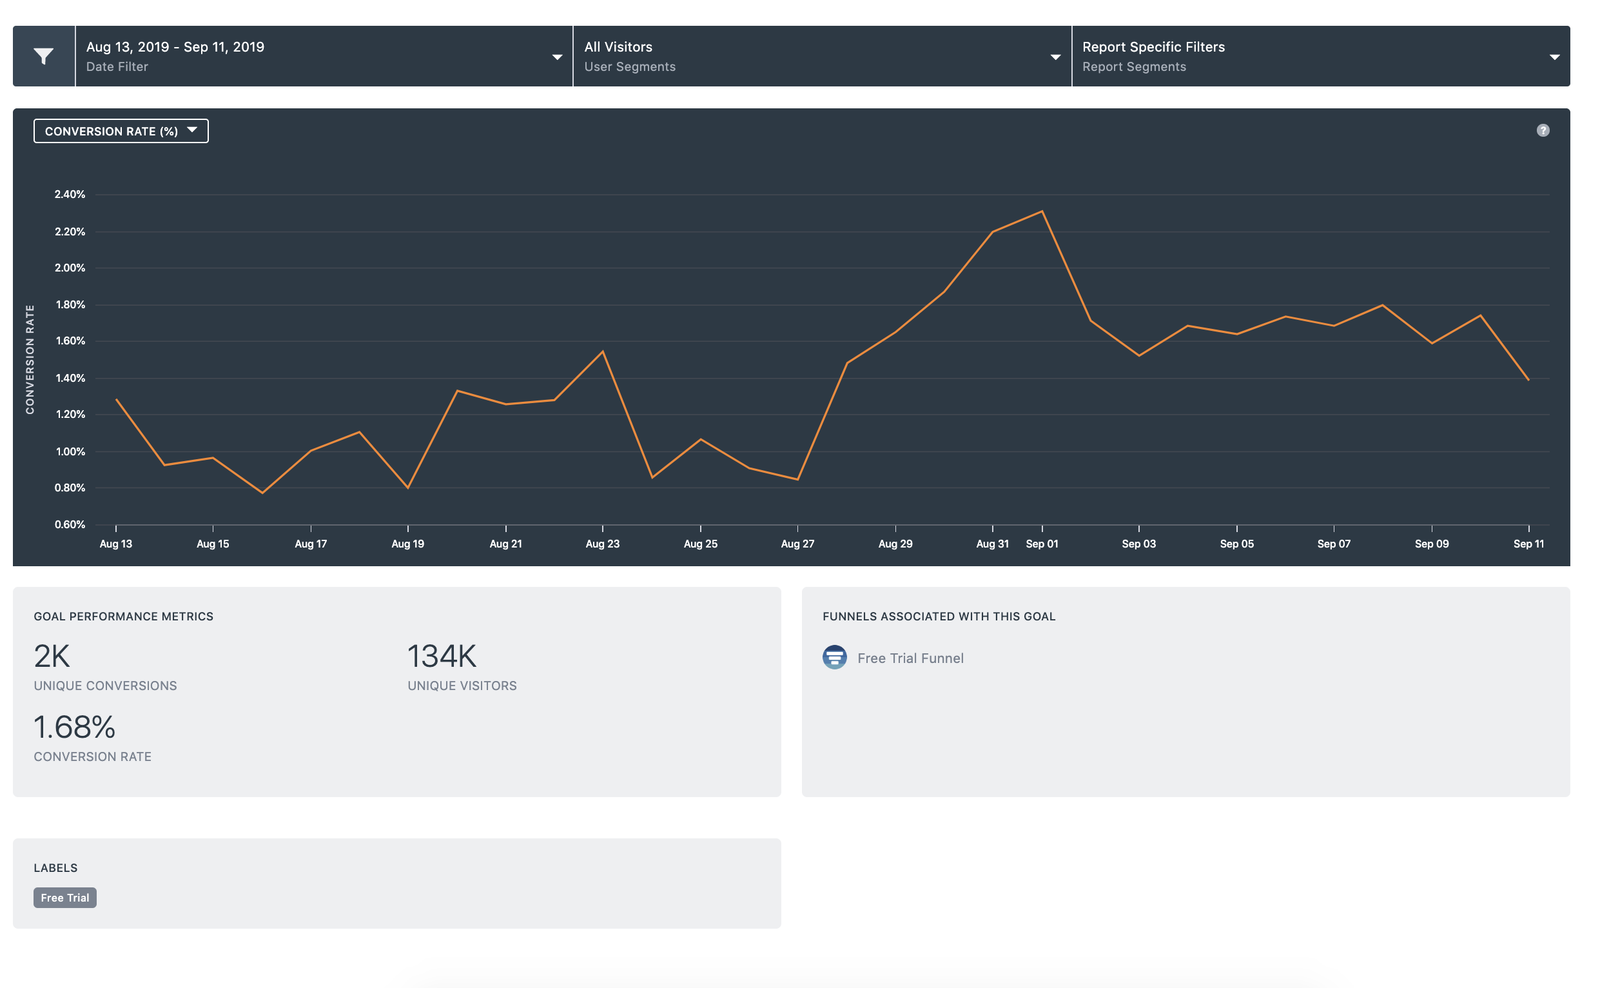
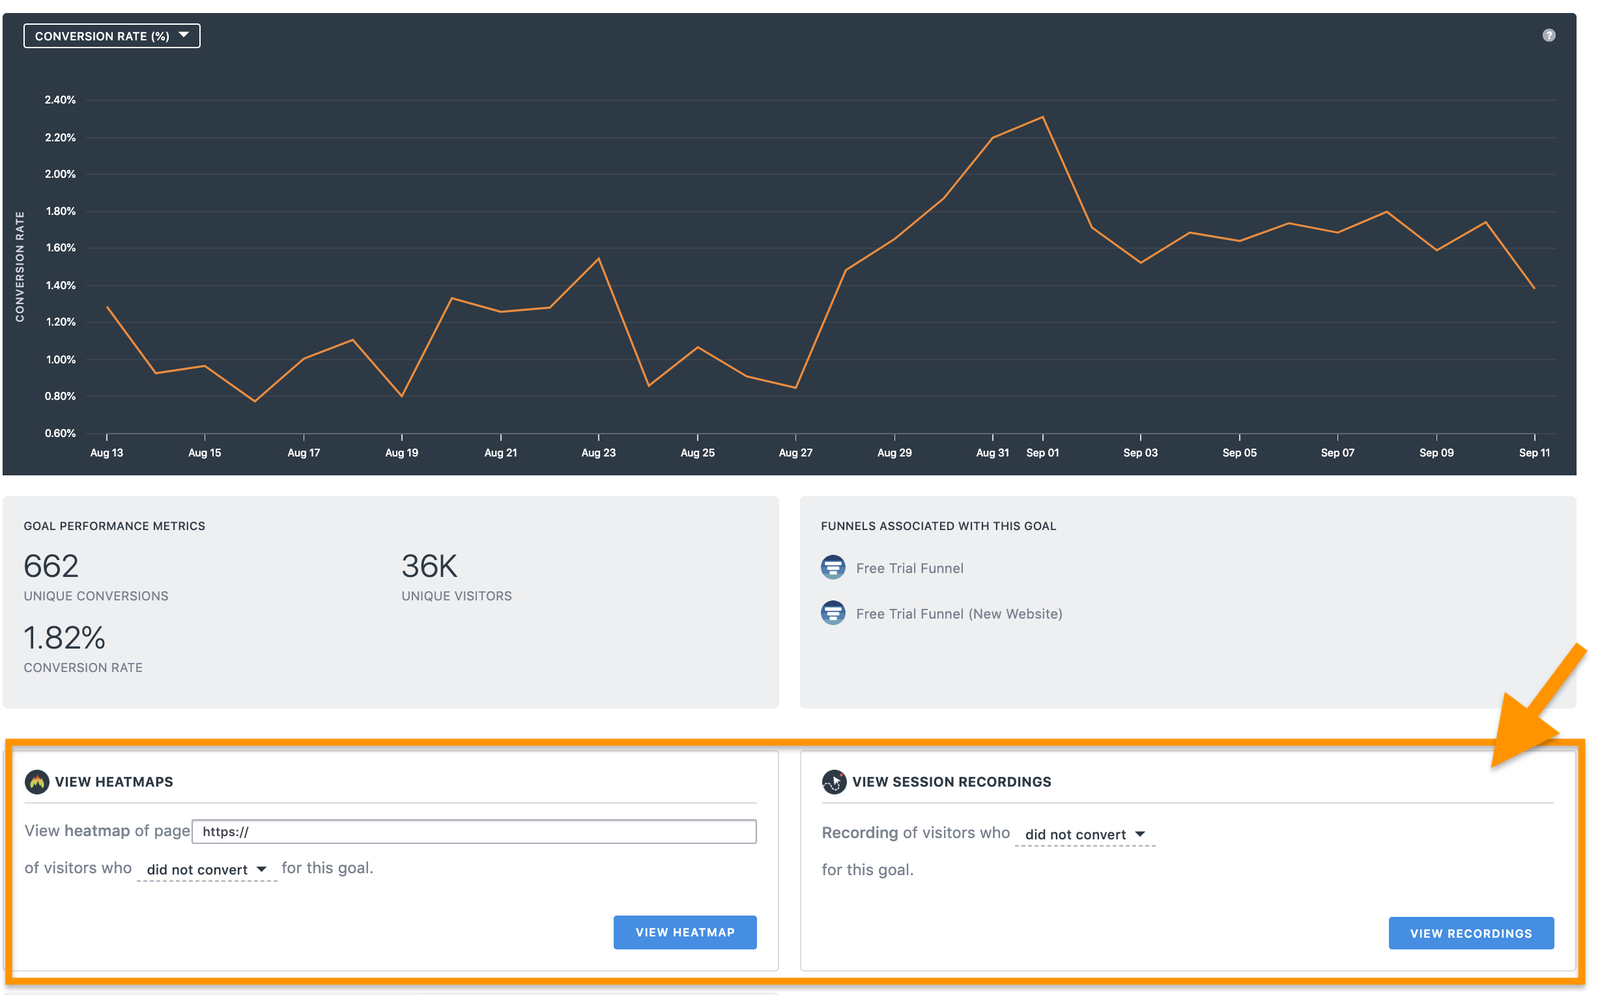
For example, Rahul and his team built and launched a new segmentation feature that allowed users to set up a behavioral analysis of visitors converting/not converting for a set goal. They added the feature to a dropdown menu where it seemed like a natural fit. But, it wasn’t being used! Naturally, his team wanted to understand why. They decided to send a survey to get some candid customer feedback on the feature. The results were surprising. They realized that it wasn’t that the feature wasn’t useful, it simply wasn’t discoverable!
Rahul and his team set out to fix it. They added a widget in the app which made the new feature more accessible to everyone. They also kicked off a marketing campaign via Appcues that highlighted the feature to users that hadn’t yet used it. This increased adoption from less than 1% to over 15%.
VWO app without the widget
VWO app with the new widget
Successful onboarding and ongoing usage is essential to retaining customers. With a baseline of product analytics in place that gave them clear insight into both these metrics, the success and growth teams at VWO were able to start getting ahead of churn risks.
Rahul started by giving more visibility to CSMs by setting up custom dashboards in PowerBI. Each dashboard had in-depth information about a customer’s current product adoption. That information was also reflected in the customer record stored in Salesforce. CSMs could quickly glance at their customer dashboards before getting on calls and give more insightful product recommendations.
The growth team at VWO also uses this data to build engagement buckets (high, medium, low, critical), which are based on the frequency of important actions a user takes inside the VWO app over a period of time. Customers with low and critical scores are churn risks. When a user is at risk, they’re automatically entered into a personalized email flow designed to get them re-engaged. Because this information is also in Salesforce, sales and customer success can take the appropriate action as well.
VWO’s data-driven approach to customer success and churn prediction has helped increase dollar retention rate (DRR) significantly.
The business impacts of this enhanced focus on product analytics are impressive:
Democratized access to detailed product analytics and adoption dashboards
Increased the number of events tracked from 10 to 1,000+, covering every possible customer action in the app
Improved adoption rates across all features, including a 15 percentage point increase of the new segmentation feature
Significant increase in dollar retention rates
In addition to all of that, Rahul and his team managed to create a more data-driven product organization. They now have a deep understanding of their customers and can make better decisions as a company. Growth can focus on promoting the right features to the right customers. Customer success can take action on at risk accounts before it’s too late. And, lastly, Rahul and his team can eliminate assumptions when it comes to prioritizing focus areas for the product.

Our annual look at how attitudes, preferences, and experiences with personalization have evolved over the past year.