New Sources Added: Analyze the Real Effects of Your Email Campaigns
Today we’re excited to announce a new wave of email Sources. You can now use Segment to collect and analyze email events like Email Opened and Email Link Clicked from eight popular email providers: ActiveCampaign, Mailjet, Customer.io, Vero, Klaviyo, Iterable, Drip, and Nudgespot.
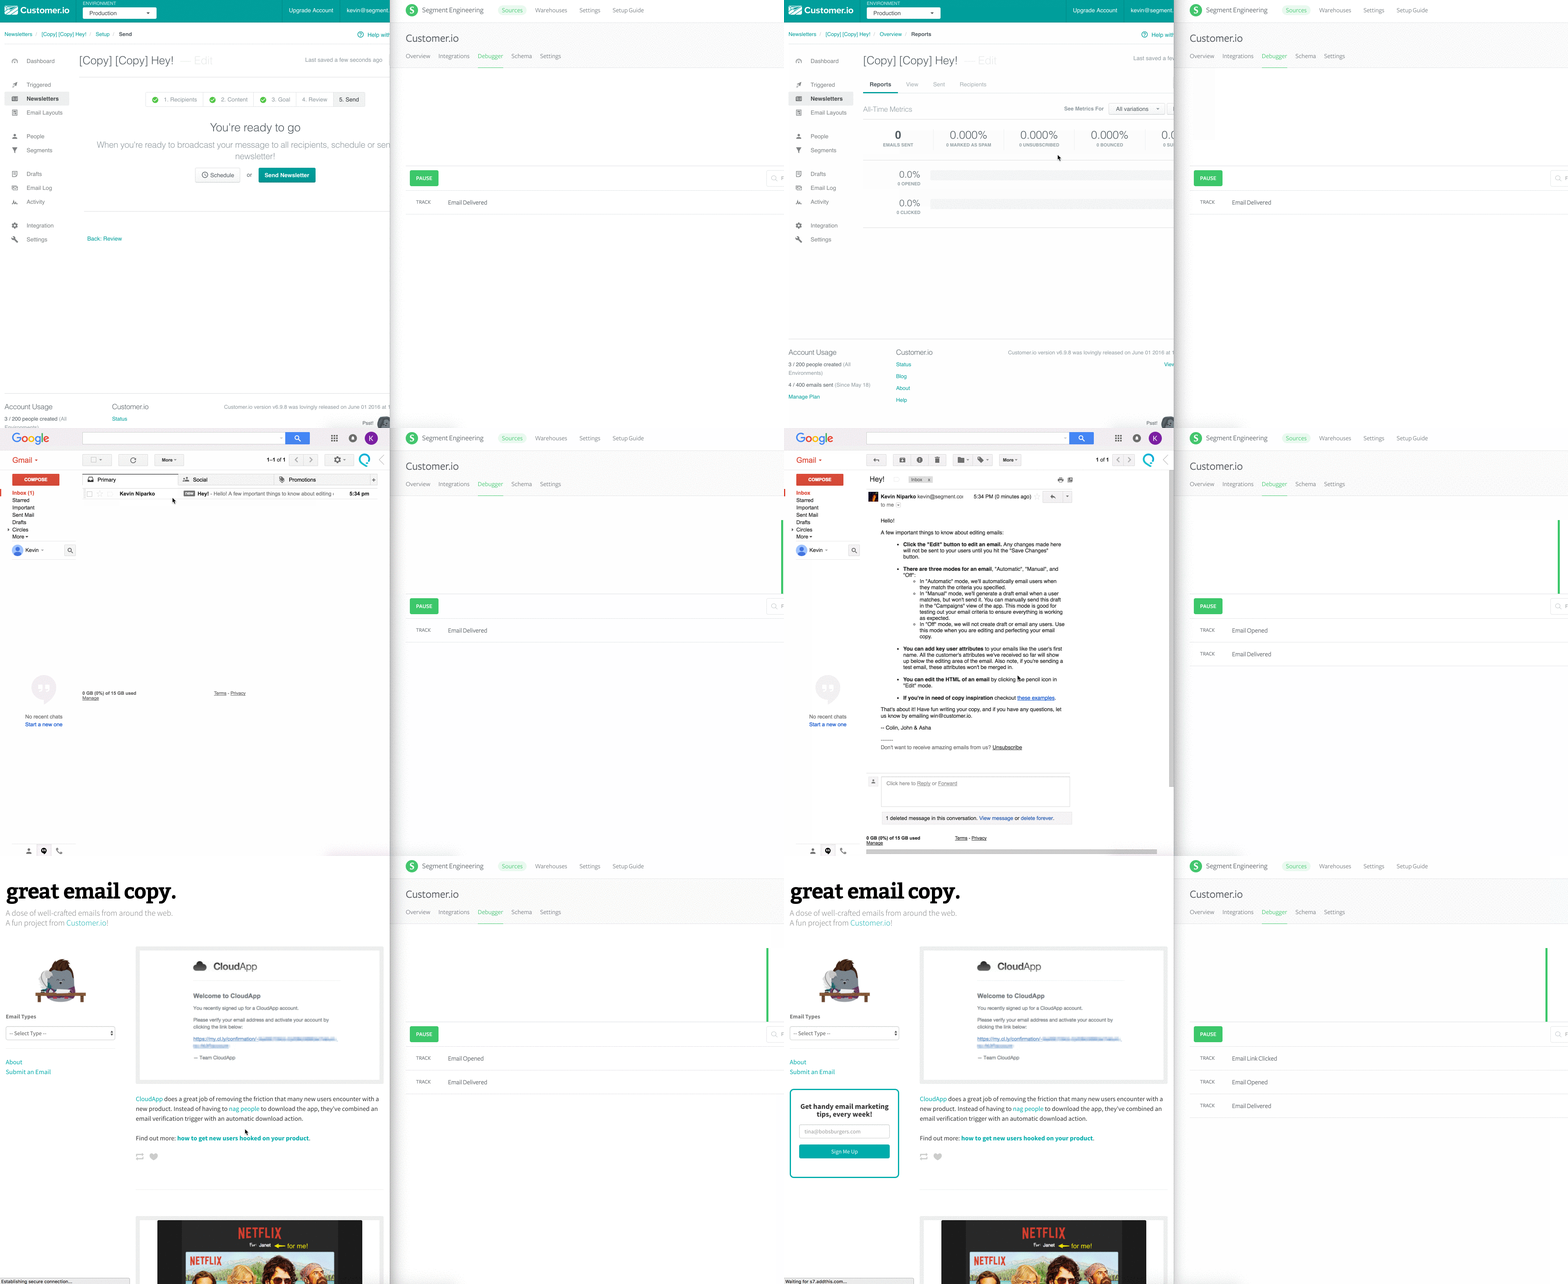
These Sources will help you ask and answer tough questions about how well your campaigns are actually performing.
Would the conversion rate increase if you didn’t send an email?
How does one email affect user behavior three steps down in your funnel?
Are you emailing customers too many times during an average week?
Performing these types of analyses has typically required spreadsheets or custom ETL processes. With Segment Sources, you can capture email data with just a few clicks and no new code!
When you activate any of the new email Sources, Segment will automatically capture Email Delivered, Email Opened, Email Bounced, Email Clicked, Unsubscribedand Email Marked as Spam events from your favorite email platforms. Then, we’ll send these events out to your data warehouse. Unlike most of our other Sources, these eight Sources will also send events out to the integrations you’ve connected through Segment. All you have to do is add your email platform credentials to Segment to get started!
To get started with email data, here are three analyses you can try today!
Analyze how email affects your conversion funnel
Test email performance with a “no email” control group
Find out if you’re sending a few too many emails
You can run these in any analytics integration or BI tool on the Segment platform!
Since most behavioral email tools focus on a measuring a single conversion event that occurs after an email is sent, analyzing email events within the context of your funnel isn’t easy.
Plus, most email tools show you the conversion rate for everyone who was sentthe email… whether they opened it or not. Analyzing email opens more accurately measures the effect of the email itself.
Let’s say you have a basic question: how many people signup, open a welcome email, and start a subscription? With your email data, you can finally figure this out.
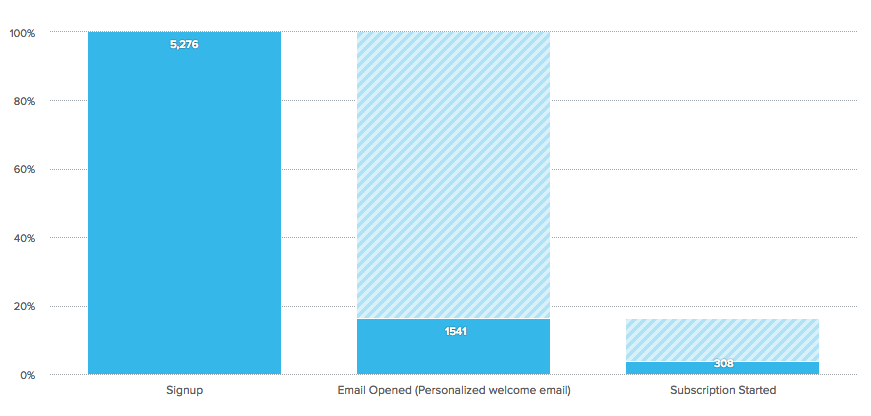
Email opened funnel. (Amplitude Dashboard)
Nice! Looks like ~30% of signups open the email, and then 20% of those people go on to start a subscription.
If you’re curious what happens after the subscription starts, you can add in even more events! This is only possible with your email data in analytics tools and data warehouses — very few email platforms allow for multi-conversion analysis.
To further dig into the performance of your emails, you should probably be testing the null hypothesis with a control group. How did the cohort of users who received a particular email behave compared to those who didn’t get the email? Using the Email Delivered event you can answer this question easily.
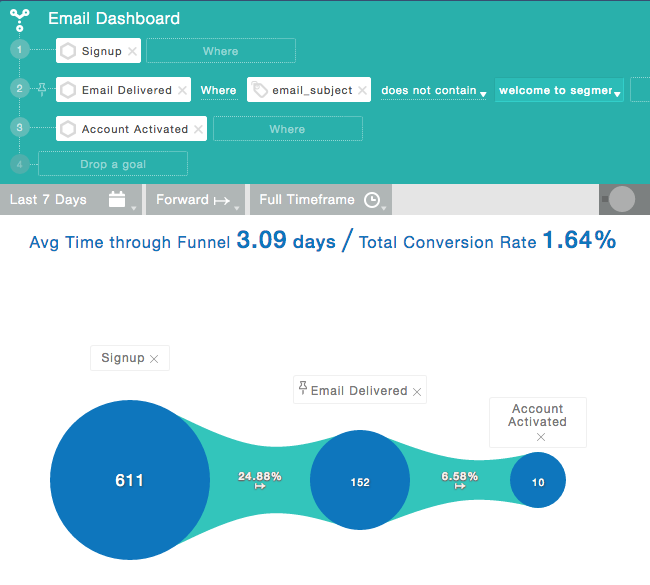
Activation rate when “Welcome” email is not delivered. (Indicative Dashboard)
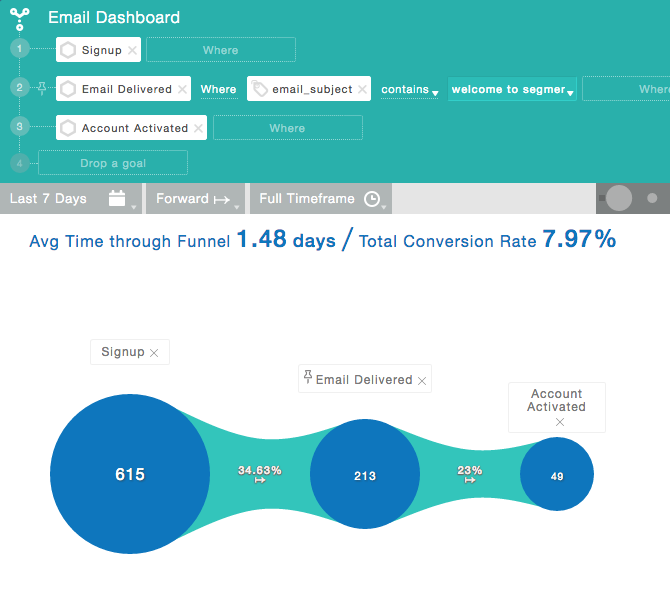
Activation rate when “Welcome” email is delivered. (Indicative Dashboard)
In the example on the top, you can see the one week activation rate for customers that do not receive a personalized onboarding email is 1.64%. In the second screenshot, you can see the activation rate for customers that did receive the email go up to 7.97%. And, they activate 100% faster (3.09 down to 1.48 days)!
Not bad! Having confirmed the value of this email, now you can experiment with different email variations and watch how that impacts your overall funnel.
Lastly, it’s a good idea to make sure you’re not inundating your customers with emails.
You can start this exploration by asking the simple question, how many emails do you send users on an average week? This is nearly impossible to discern in most email tools. But it’s easy to do with Segment and our Sources partners!
First, let’s look at the average number of emails sent to users, over time.
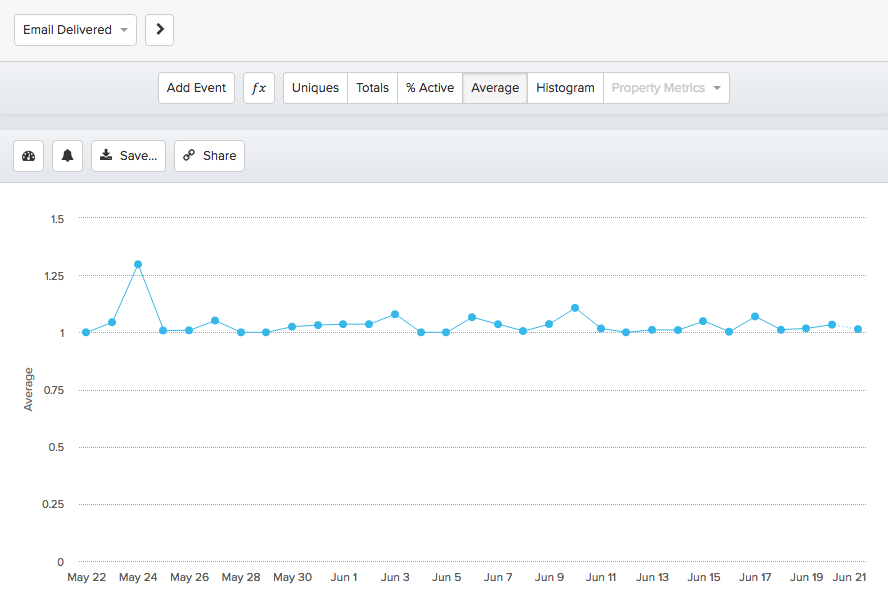
Average number of emails delivered per week. (Amplitude dashboard)
In this example, we’re averaging between 1–2 emails per week. That’s acceptable. But what does the distribution look like?
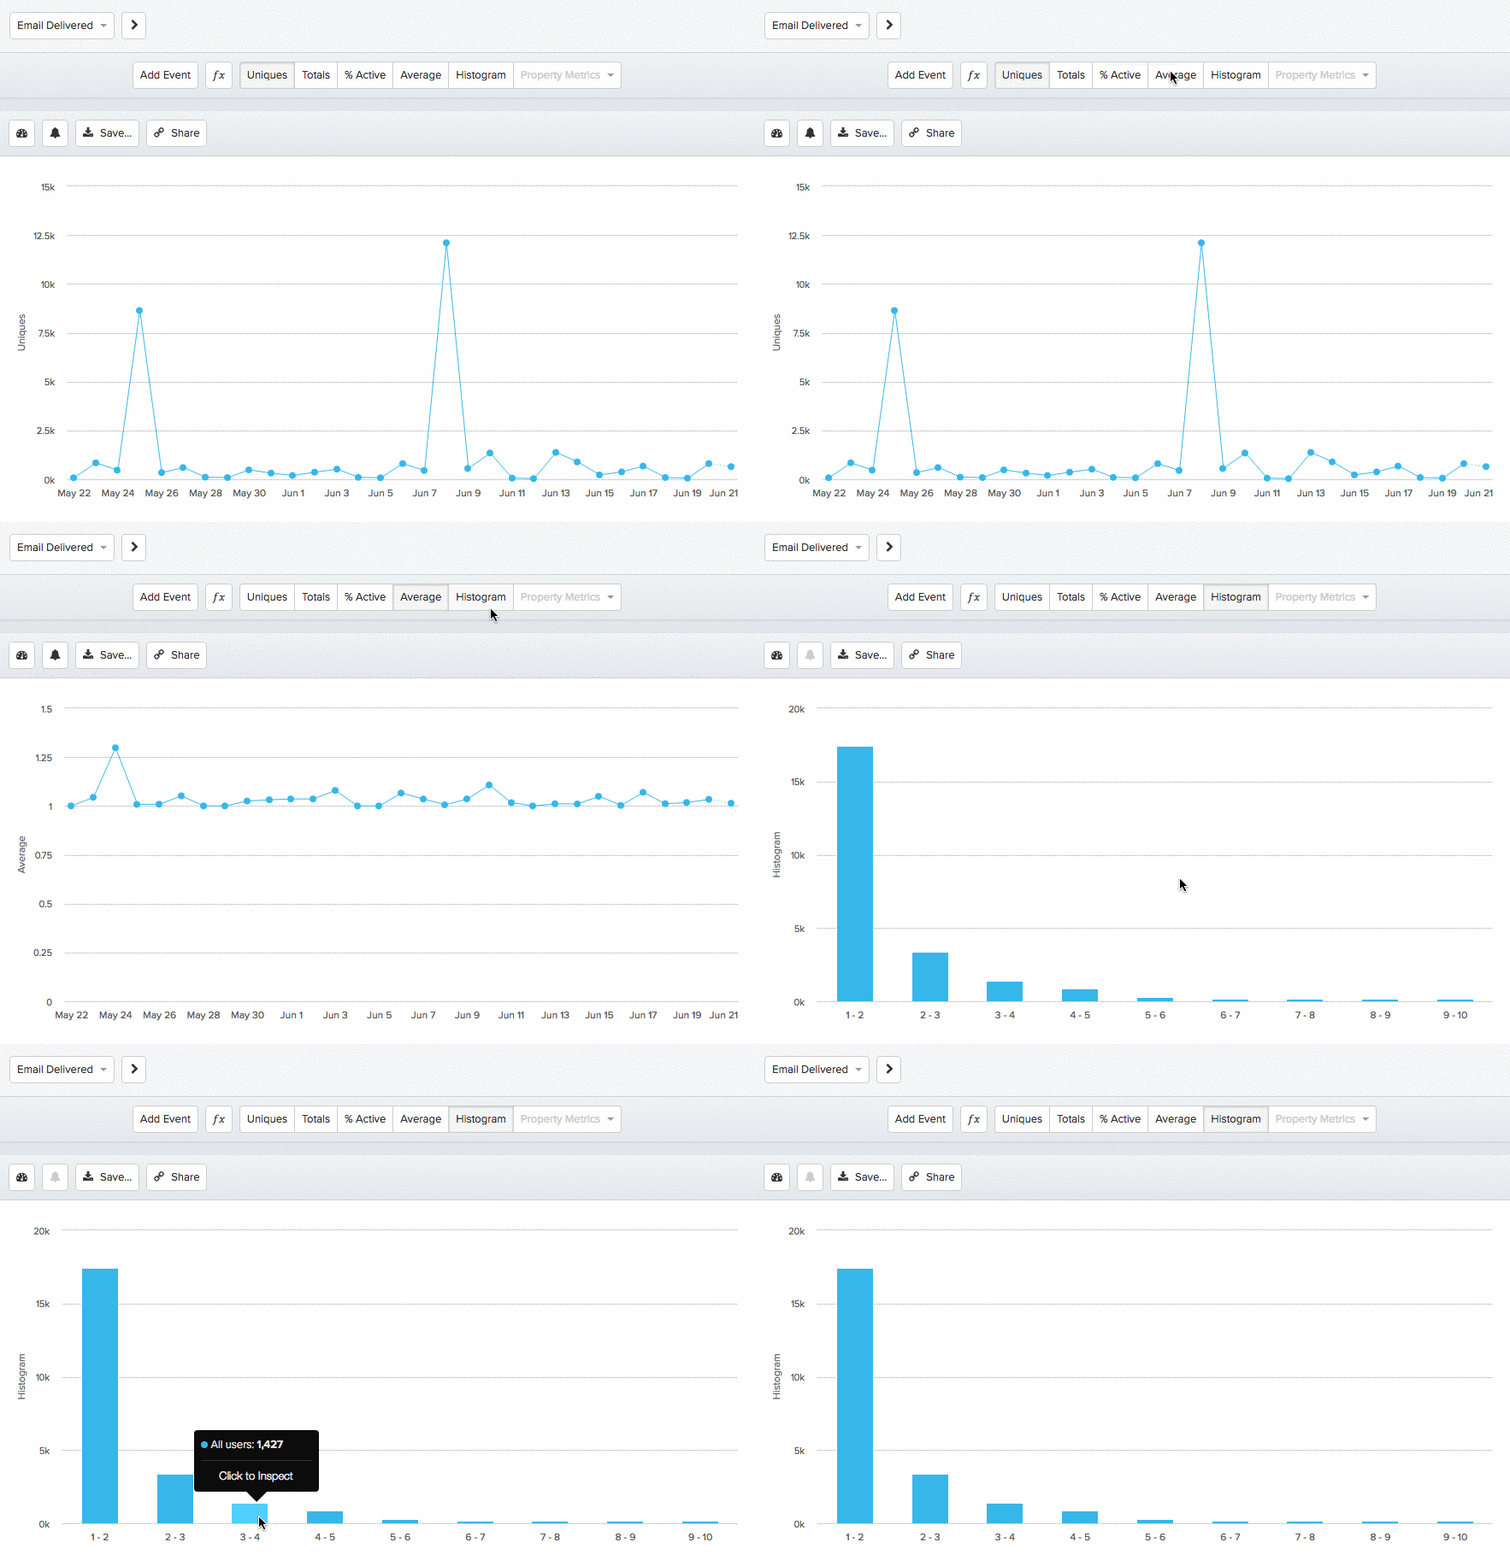
Email delivered analysis. (Amplitude dashboard)
Whoa! Looks like 300 customers got 5–6 marketing emails in a week which is probably too many. You can split these by campaign and subject to see where these emails are coming from and explore how to avoid email overload in the future.
Ready to start your own analysis? To collect your email data from ActiveCampaign, Mailjet, Customer.io, Vero, Klaviyo, Iterable, Drip, or Nudgespot, follow these steps:
Go to the Sources catalog in the Segment dashboard and click on your preferred email provider
Get your Segment write key
Jump into your email provider’s settings page and enter your Segment write key
Connect tools where you’d like to analyze this email source data
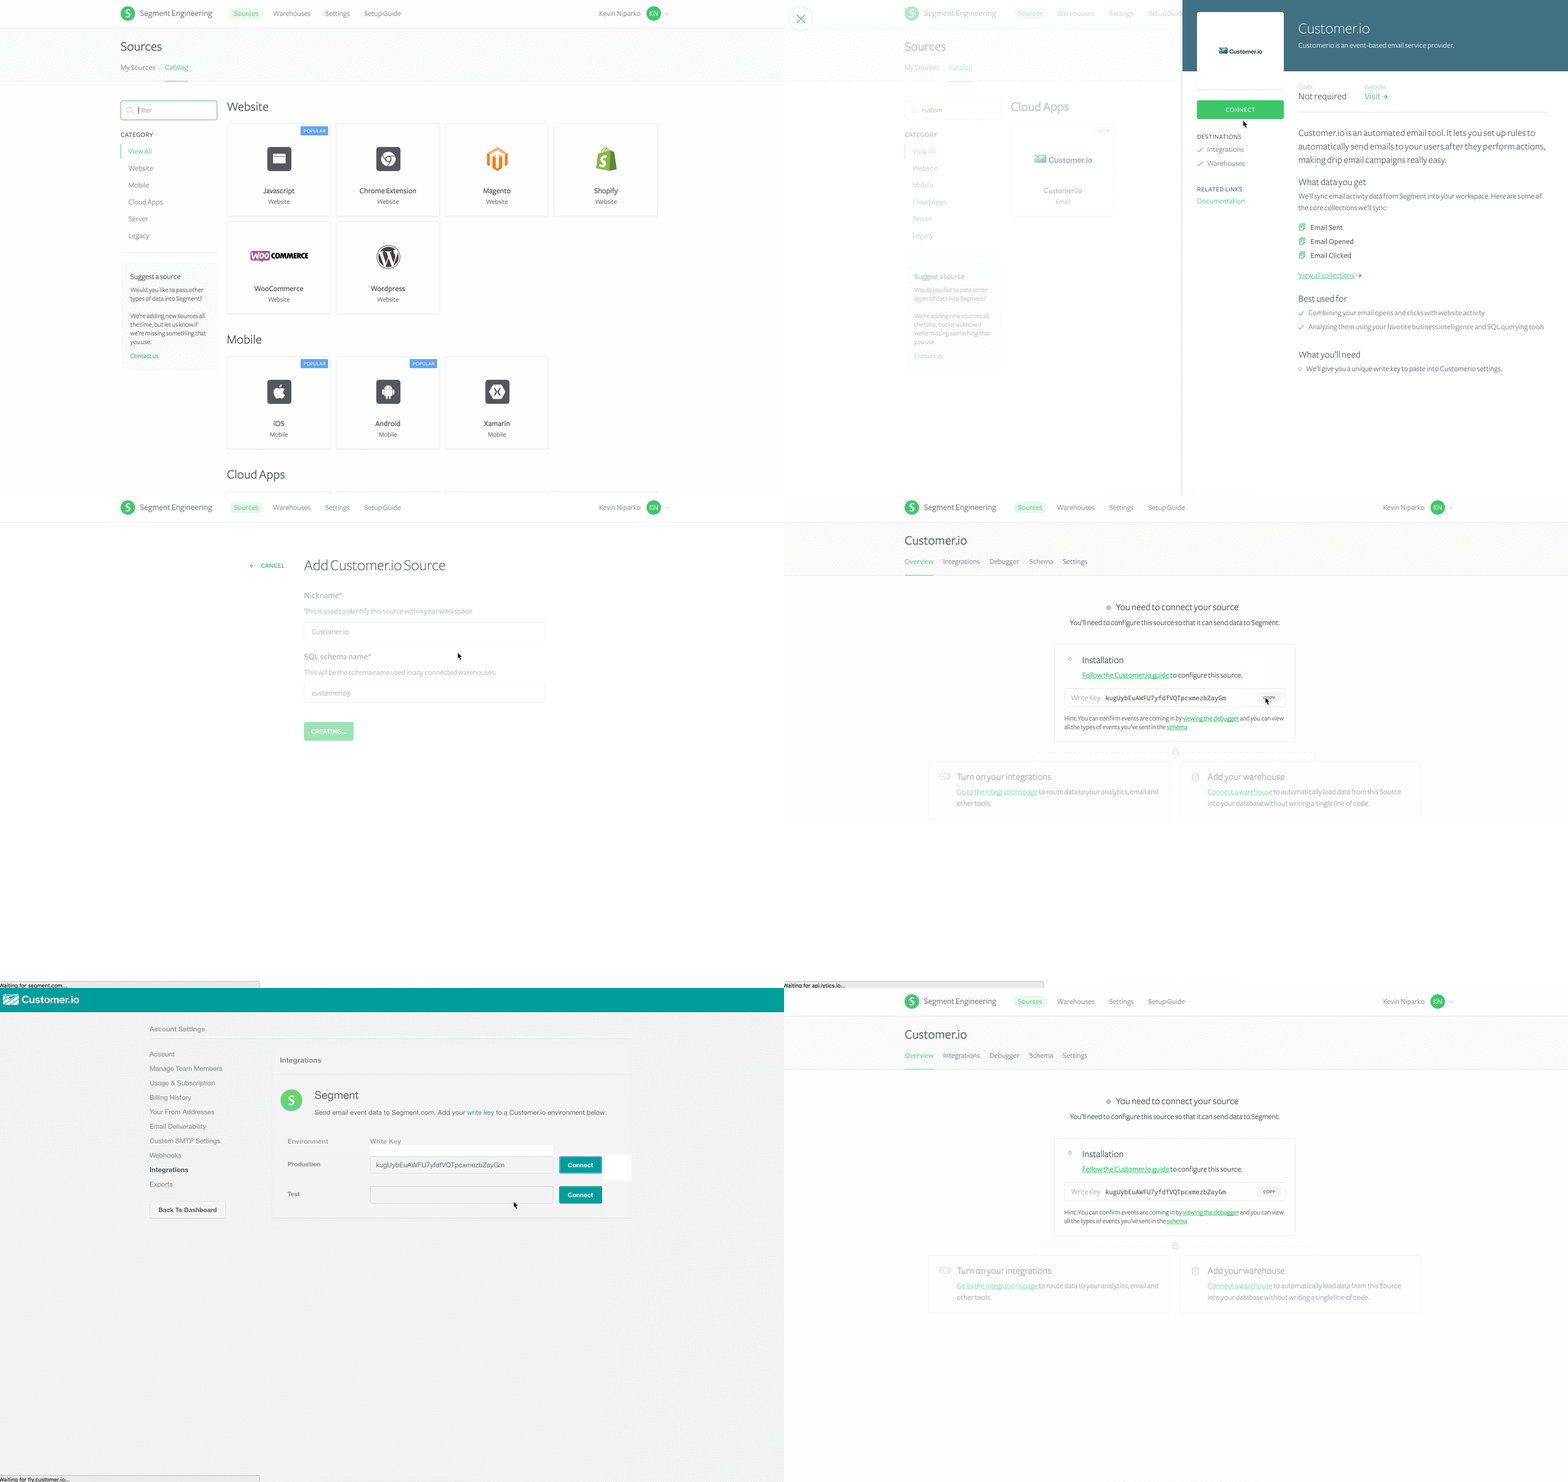
Boom! You’re ready to take your email marketing to the next level.
Without further ado, log in to add an Email Source today.
Not a Segment customer? Get started here!

Our annual look at how attitudes, preferences, and experiences with personalization have evolved over the past year.