Open Source SQL Queries for Your Behavioral Data
We welcome Derek Steer, CEO of Mode, to the Segment blog! Mode is a SQL integration partner and has created these open source queries so you can start learning ASAP. The best part? Their playbooks are tailor-made for the Segment SQL schema.
You’re planning ahead to 2015. “Be more data-driven” is on your company to-do list.
You want to give your team access to better information–and help them make more informed decisions. Questions like “how many invites did we see yesterday?” and “how are customers using the invite feature?” are popping up right and left. Maybe you’re hearing things like “what marketing channels lead to the highest lifetime value customers?” when six months ago this type of question sounded simpler, like “how many daily sign ups are we getting?”
It turns out a lot of these insights are hiding in the raw event data that your product is already generating, quietly in the background.
Thanks to Segment, you can track these analytics events and flip on Amazon Redshift to start digging into these questions.
As we started working with our own Segment data—and helping some customers beta testing the product—we found that many of us had similar questions about how people use our products.
To put all these questions in one place, we started writing SQL queries that could be tailored to anyone’s Segment data schema. These open source queries—we call them the Mode Playbook—can help you find Retention and User Behavior insights in your data from the moment you connect your database to Mode.
Let’s look at an imaginary messaging app as an example.
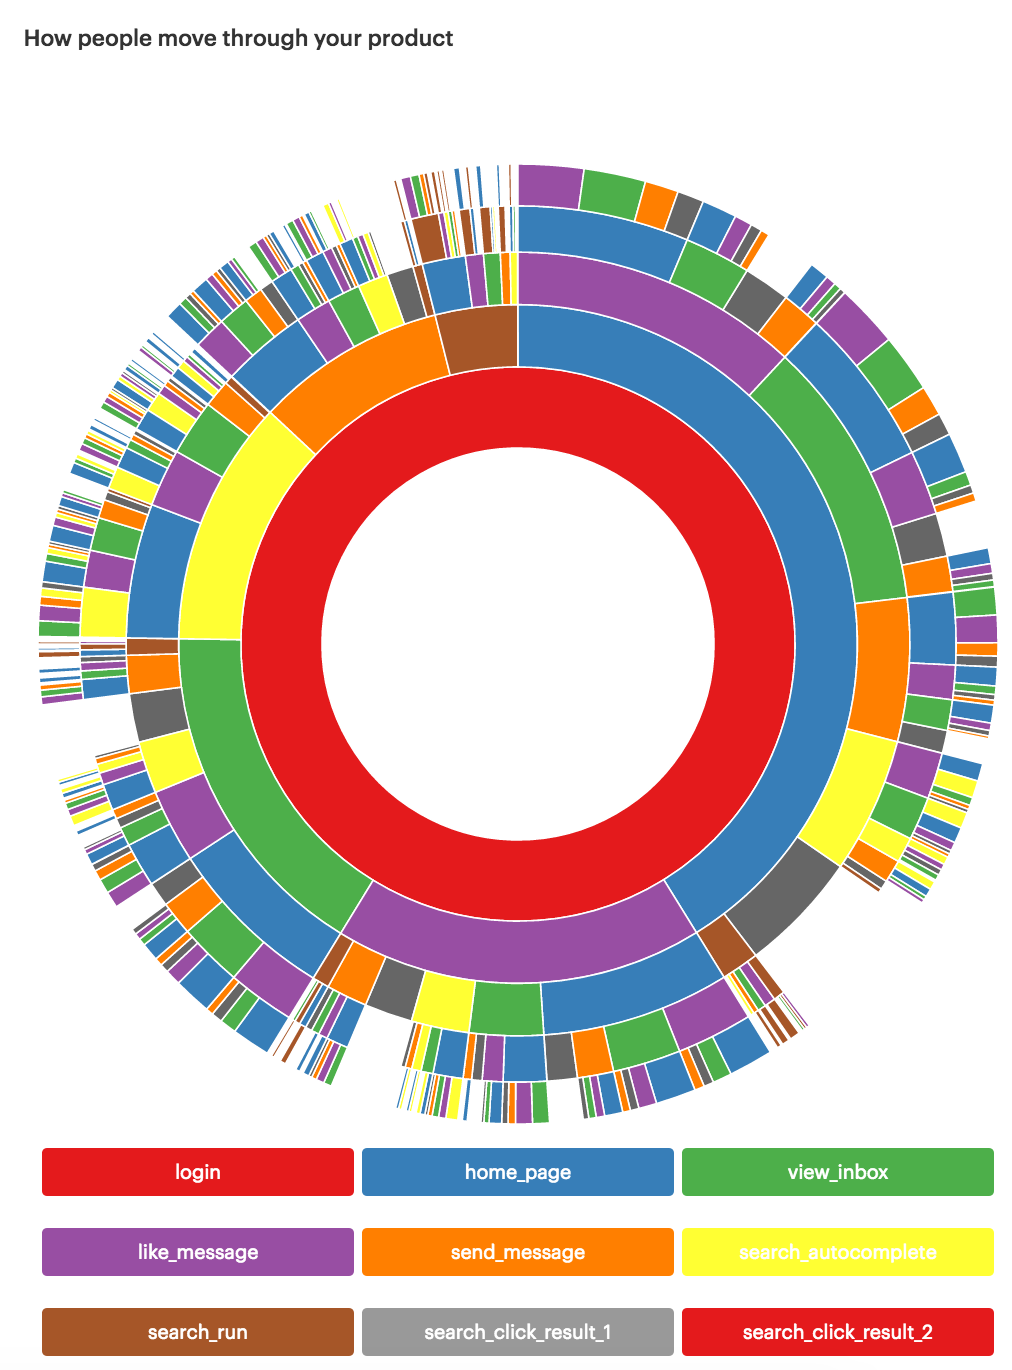
Your Product Managers are talking about how to increase sent messages but no one seems to have a specific understanding of what users do before they send a message. With the User Path report, you can help them visualize the paths the users take before sending a message.

This report, like every other Playbook report, uses a common table expression. Think of a common table expression like a temporary table that a subsequent query can reference. Modify the common table expression to reference your schema and run it. The next step is to share it with coworkers and start talking about what the data means for upcoming decisions.
The magic of this common table expression and the standardized Segment event stream is that this report will work whether you’re analyzing messages sent, photos shared, orders placed—anything. It can also work with mobile apps: Replace the pages table with the screens table, and the properties.title column with the name column.
If you’d like to use more explicit events other than page or screen views, you can combine Segment events together into a single table using the UNION function in Redshift. As long as the events table defined here has a user_id column, and event_name column, and an occurred_at column, the rest of the report just works.
You can also explore other aspects of retention and user behavior in the seven other Playbooks.
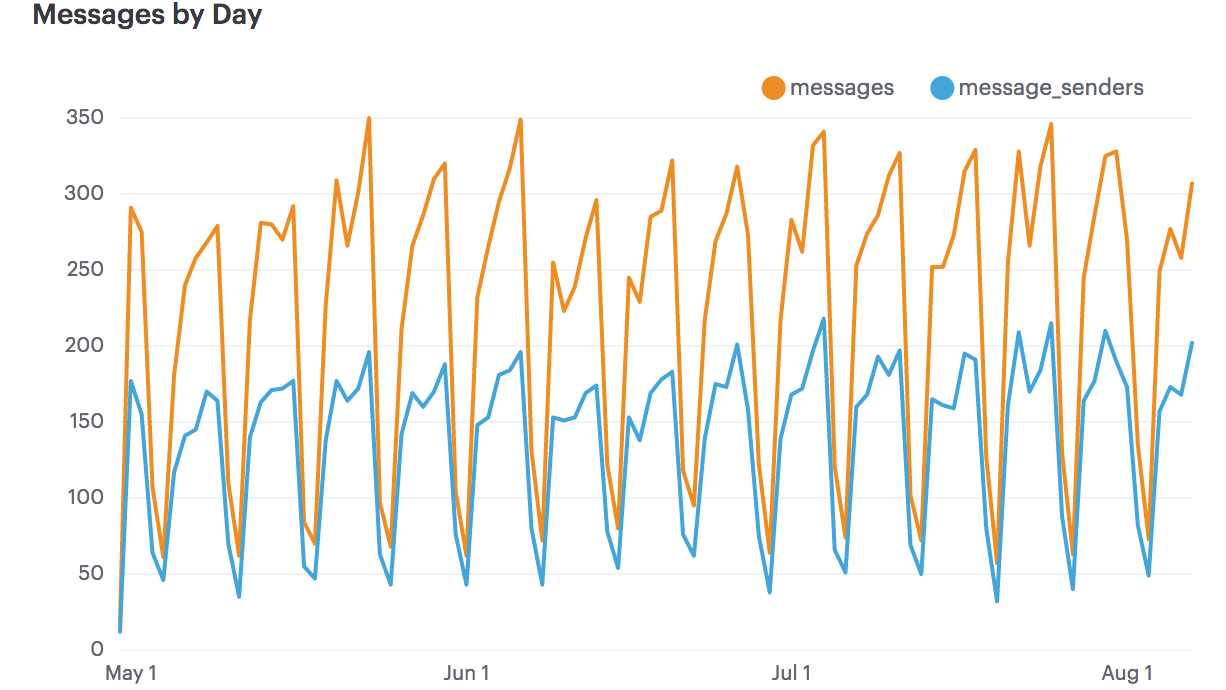
You don’t always need a fancy interactive chart to answer someone’s question—and dashboards often lead to requests for underlying data. So, we advocate starting with simple queries that get to the heart of your questions. Let’s say the Product Manager in the example above is curious how message volume changed since a feature launch. It just takes a quick query to find out:
Create a simple line chart and share the report out with stakeholders. They’ll be able to refresh the results any time.

We developed the Playbook to get you and your company on the fast track to being more data-driven, inspiring deeper exploration of your data with SQL. It’s easy to get started with SQL, especially if you’re familiar with Excel. We created a free, interactive tutorial called SQL School, so you can dive right into learning SQL or brush up your skills.
We’re excited to help you find insights in your Segment SQL data. You can sign up for Segment SQL here and for Mode here.
To learn more about how we seamlessly integrate with Segment SQL and have helped customers like Munchery get up-and-running quickly, mosey on over to Mode.

Our annual look at how attitudes, preferences, and experiences with personalization have evolved over the past year.