What is Ordinal Data?
We’ll walk you through what ordinal data is, how to understand it, and how to use it to your advantage.
By Segment
We’ll walk you through what ordinal data is, how to understand it, and how to use it to your advantage.
As a marketer, you’ve likely worked with an ordinal data set.
When a business asks a customer to rank their satisfaction with a new product, on a scale of 1 to 5, those responses become ordinal data. When your email campaigns ask how likely a customer is to recommend your business? Another example of ordinal data in the making.
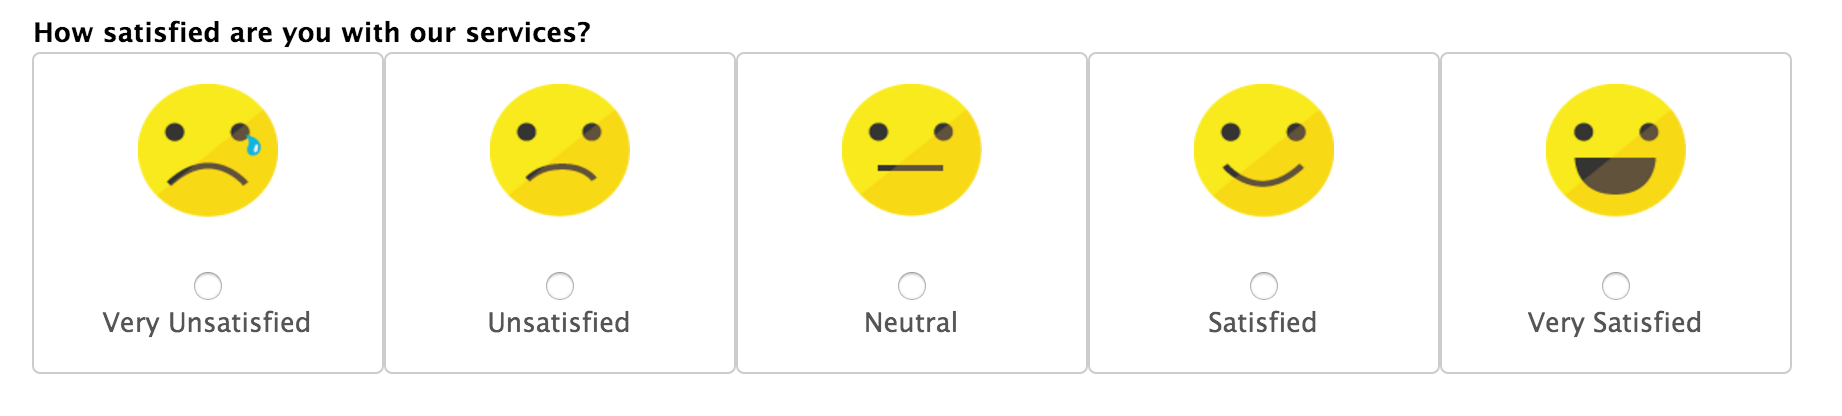
An example of a CSAT survey that would result in ordinal data
Knowing how to analyze ordinal data will result in better marketing reports and more valuable insights, which lays the foundation for successful campaigns. Below, we’ll walk you through what ordinal data is, how to understand it, and how to use it to your advantage.
When data points fall on a scale, or can be arranged in order, statisticians categorize it as ordinal data. It’s important to know that you can’t compare ordinal data points as equals. Often, the responses that people give are the result of individual interpretation.
Let’s explain.
Think about asking customers how often they buy products from Instagram ads on a scale of “daily” to “never.” As the statisticians at Scribbr point out, data like “sometimes” and “infrequently” will fall somewhere on the scale. But the distance between these two points is unknown – they’re not explicitly quantified by a certain number of times per week, month, or year. For some people, the response “sometimes” could mean once or twice a month. For others, that same response could mean “weekly.”
Ordinal data is valuable for marketers because it lends itself to visual representation, and provides useful, qualitative information.
Ordinal data is almost any data represented by a label or category that can be arranged in a certain order. It can be represented by a number but doesn’t signify actual numerical data, but rather the intensity of a thought or feeling.
Perhaps the most widely known way to collect ordinal data is the Likert scale. It asks on a scale of 1 to 5 how much you agree with something, with answers ranging from strongly agree to strongly disagree. Likert scales are often used to ask customers about the quality of customer support, their satisfaction, and so on, with 1 being very unsatisfied and 5 being very satisfied.
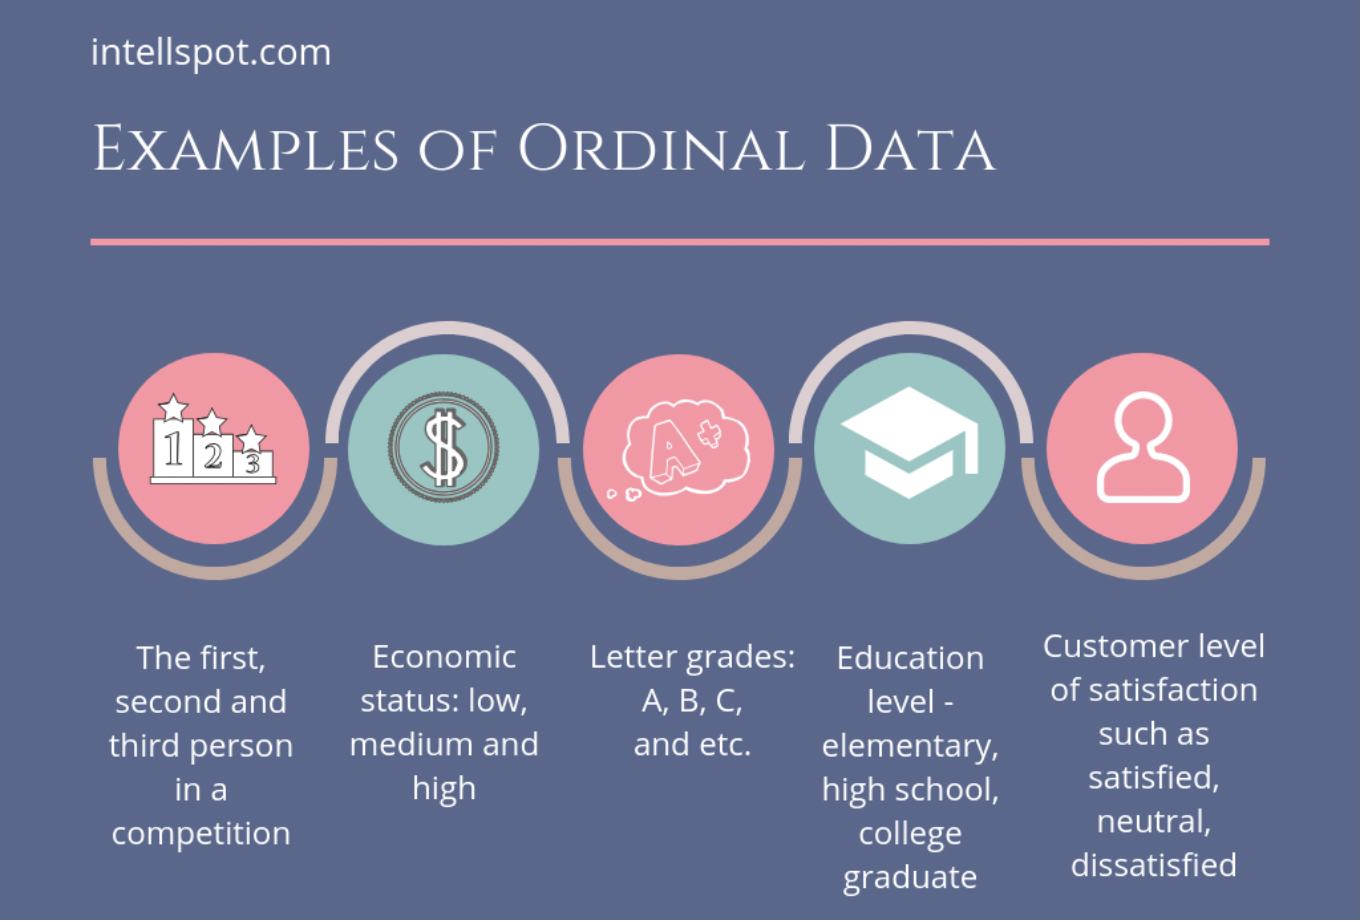
Other examples of ordinal data include Olympic medal positions (gold, silver, and bronze), level of pain on a pain scale (1 through 10), and siblings’ ages (youngest, middle, second oldest, oldest, etc.).
Types of data sets fall into different levels of measurement. They include nominal, ordinal, interval, and ratio data.
Nominal is the most basic and can only be categorized. For example, the city or state you live in is nominal, as are answers to questions about veteran status on job applications. The data points have no relation to each other, unlike ordinal data.
Ordinal data is different because it can be categorized and ranked in order.
Interval data can fall into categories and be ordered, and the data points have equal spacing between them. Interval data is apt for more detailed statistical analysis. Examples include temperature measurements, tax brackets, and standardized testing scores.
Ratio data is the most detailed measure and includes categories, rank order, and equal spacing, as well as a true zero.
In terms of precision, the ordinal scale is second. Ordinal data is more complex than nominal data but simpler than interval and ratio data.
Ordinal data is represented well in a visual format. For example, bar graphs, distribution charts, and pie charts are all effective ways to display participants’ answers and see what the most and least common responses are. Basic statistical indicators, like distribution, median, and range, are also useful.
If you’re looking to take a deeper dive into ordinal data with statistical tests, testing on ordinal variables can only be done with nonparametric tests, like the Mann-Whitney U Test or Wilcoxon test. Regular parametric tests such as t-tests or ANOVA won’t work on ordinal data.
Before you start data analysis, remember quality is key. Reliability, completeness, and uniqueness are all qualities of reliable data. That means the data must be formatted correctly, all fields of the form used to capture responses are filled out, and there are no duplicate entries. If those are satisfied, you can be more confident your data will reflect the surveyed population.
Frequency distributions often take the form of bar graphs, and display how many responses were given to a certain question. For example, if you’re looking at the frequency distribution of ages for people surveyed, you’ll get a sense of if the group was older, younger, or a more even split.
Median and mode are measures of central tendency and are meant to represent the most common or typical responses. (You cannot calculate the mean of ordinal variables because the data points don’t have a numeric value.)
With ordinal data, you can easily find the mode and median of the data set. The mode is the most common response. The median is whatever value sits at the center of the data. For a data set with an even number of ordinal variables, place all of the data in order, then count the total number of responses. Add one to the total number, then divide it by two. That will tell you where the median is located in the data set.
Ranges represent the difference between the highest and lowest values in a data set. Ranges are useful for advanced statistical analysis but are not usually strong indicators for ordinal data sets. That’s because with ordinal data, the survey’s author has already established the range when they create the survey. There’s also no way to quantify the difference between the high and low values of ordinal data sets, like unsatisfied and satisfied.
While understanding ordinal data and other types of data may seem complex, you don’t need a Ph.D. in statistics to effectively understand and optimize your company’s data. Segment helps organizations collect quality data with real-time data validation and automatic enforcement controls.
If you want to learn more about how our product works, reach out here.

Our annual look at how attitudes, preferences, and experiences with personalization have evolved over the past year.
Ordinal data is any data that fits into a category and has an unequal distribution between data points.
Nominal data is the most basic category of data and comprises data points that simply fall into a category. Ordinal data can be put in an order or ranking.
Interval data has equal spacing between the intervals, while ordinal data has an unequal distribution between data points.
Categorical data is a type of qualitative data (as opposed to quantitative data that’s composed of numbers). Categorical variables are given a label or description. Examples of ordinal categorical data include generation (Gen X, Gen Z, millennial, etc.), educational level (high school, college, masters, Ph.D.), or satisfaction survey (very low to very high).