How Can I QA My Twilio Segment Events?
Learn how to get greater visibility into what's happening with your events in Segment, and how to check for quality assurance.
By Adam Wolfman
Learn how to get greater visibility into what's happening with your events in Segment, and how to check for quality assurance.
One of the biggest complaints that customers have historically had about Segment is a lack of visibility on what is happening with their events, or that Segment is a “black box.” While in the past that was closer to the truth, we’ve made great strides in allowing for greater observability in to events as they flow through the Segment pipeline. This article will explain a few of the features Segment offers that allow customers to see what’s going on with their events, and run some quality assurance analysis when setting up new events.
Alright, here goes!
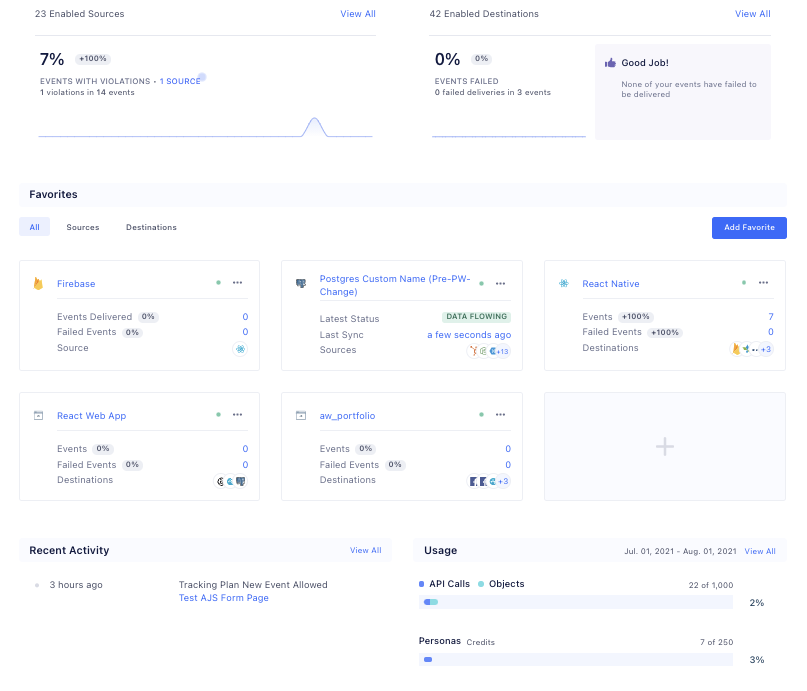
A new feature aimed at increasing observability is actually the first screen that you see when you log in to your workspace, the Workspace Home dashboard. This screen shows you some great metrics around what’s going on with your different sources including percentages of delivered and failed events, recent activity, as well as data on your overall workspace usage. If there’s an issue with events failing from a certain one of your sources, you’ll see it right away on the first page you see after logging in.
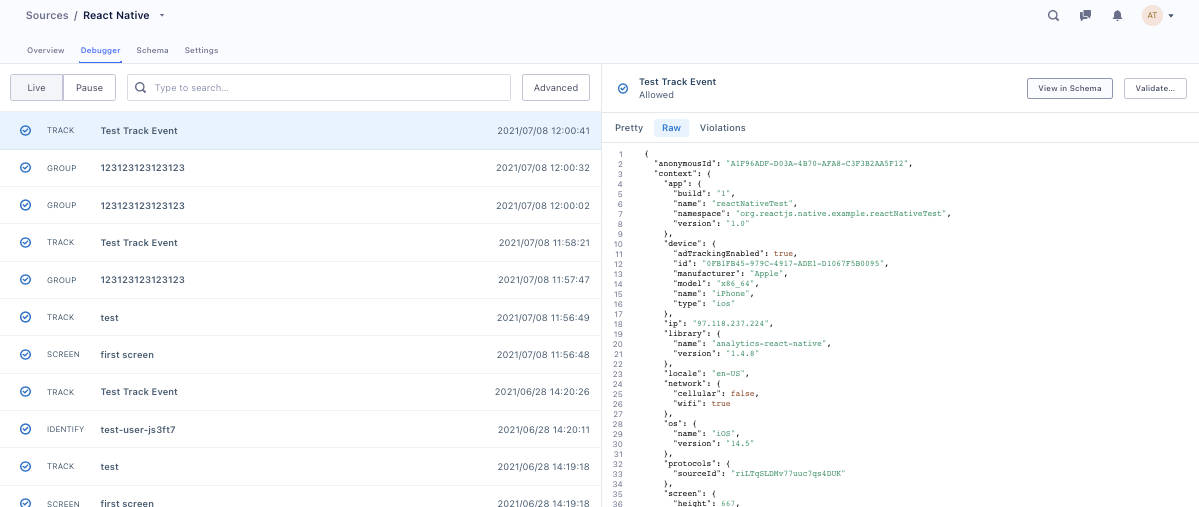
The next tool that comes to mind with regard to observability is the source debugger. Each source will have its own debugger screen where you can see a sampling of the events being received by Segment in real time! On this screen, you can see the details of the full event payloads that are received as they are ingested by Segment at the source level, before they get mapped and sent on to any specific connected destinations.
However, there are a few caveats to point out with the debugger. The biggest one is that it is not an exhaustive view of the events being received by the source, especially at high volume. The debugger will show a snapshot of 500 events at a time, so if there is a large number of events being received, some events may not appear at all. While the debugger is a very useful tool when testing, it can’t be relied upon as a complete source of truth, especially in production.
If having a full record of the events that are received is an important piece of your QA strategy, we recommend settings up a Storage Destination like Amazon S3, a Warehouse, or a Data Lake where you’d have a full record of all events received from all connected sources that could be used for analysis.
Another Segment product that can be useful when validating the data that you’re sending to Segment is Protocols. If you were in the San Francisco area in 2019 you may have seen the signs around town that said “what good is bad data”. Protocols is what those signs were all about. I won’t give a full explanation of the product in this article, but I’ll cover a few key points (and how they apply) to ensure that you’re only ingesting the events and event properties that you’re setting out to.
The Protocols product is centered around the Tracking Plan. With a Tracking Plan, you can tell Segment what events and what event properties you are expecting to receive from a given source. If you receive any events or properties that aren’t listed in your Tracking Plan, then a Violation is triggered. You can see these Violations both in your Source Debugger that we discussed earlier, as well as in the Source Schema. Though these can be viewed as violations, they are not inherently blocked. This allows you to not lose any data if you mistakenly forgot to add an event name or property to your Tracking Plan.
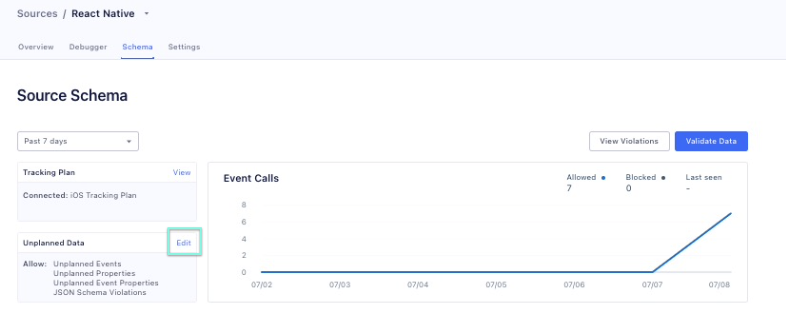
There are a few different things you can do with the violations that are triggered. First, you can use Schema Controls to tell Segment to drop these unplanned events entirely or to just drop the unexpected event properties. You can configure these settings in your Source Schema tab by clicking on the Edit Unplanned Data link highlighted in the screenshot here.
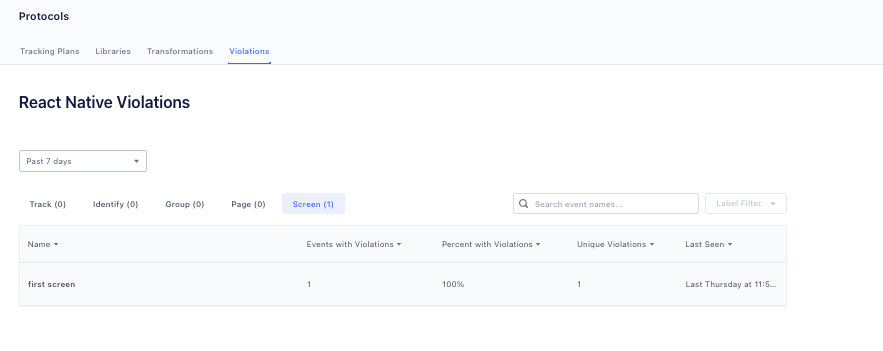
From here you can navigate to the Violations Page where you can view violations grouped by source, type of event, and specific individual event. You’re able to use filtering to only show events with violations within the past hour, 24 hours, or the past week.
Once on the Schema Configuration page, you can then set up what you’d like the source to do when a violation is received.
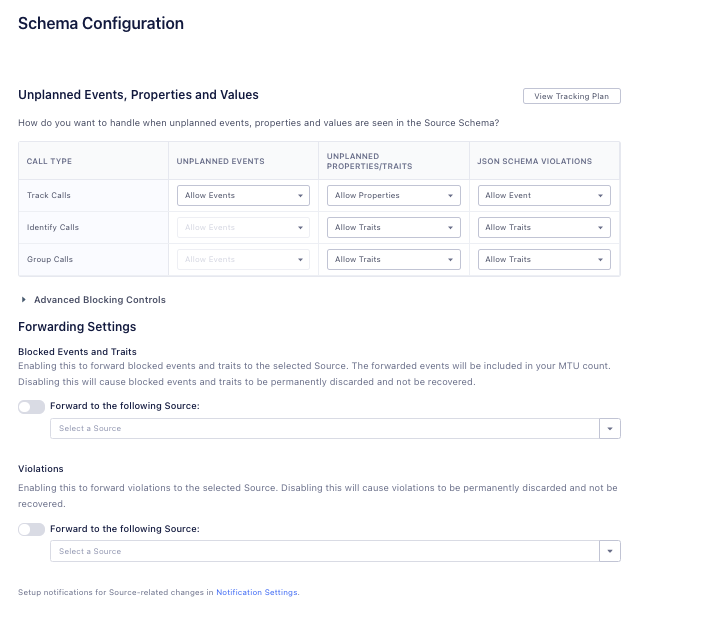
Another thing you might notice here is that you can forward these events with violations to another source, which can then be forwarded to a storage destination for further analysis! This allows you to keep a record of all the bad data that you receive so that you can investigate where it came from, identify where there may be implementation issues in your code, and make changes if necessary.
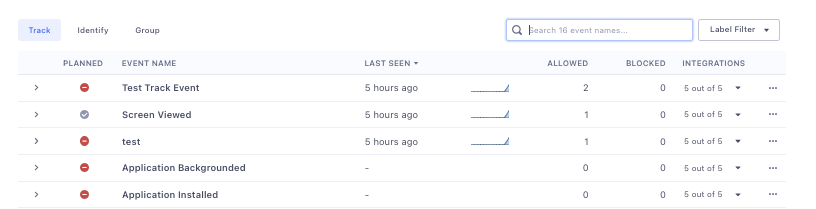
Using the Source Schema, you can also see directly in your workspace which events are planned or unplanned, and how many violations each event has received in a given timeframe.
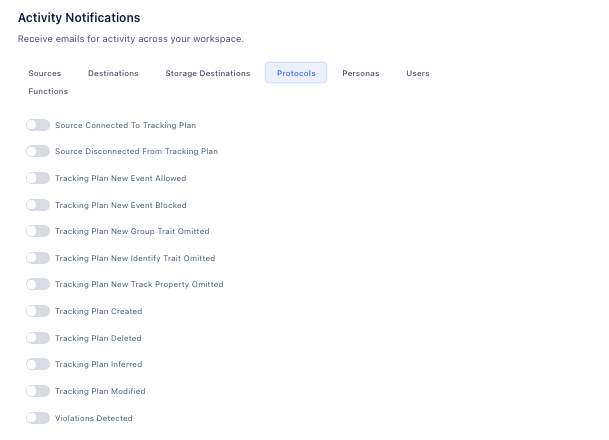
One last point around Protocols I want to mention is that you also have the ability to set up Activity notifications for when Violations are detected. This allows you to get an email or in-app notification when new violations are detected so that action could be taken as soon as possible. These can be set up in the Workspace Settings under User Preferences, and are scoped to the individual user.
Using Protocols in this way can help you figure out how the events you are sending to Segment might be different than what you’re expecting to send and make the adjustments needed based on that knowledge.
Another point of visibility into the Segment pipeline is at the point at which Segment is delivering events to your connected destinations. Every Cloud Mode destination has an Event Delivery screen. This shows how many events were delivered from Segment to that specific destination in real time. It also shows if events needed to be retried and if the retries were successful. And if there were any errors, it will show you what those errors were. When there are errors, you’ll be able to see a sampling of 20 events that triggered those errors, including the full payloads that were sent as well as the response was from the destination.
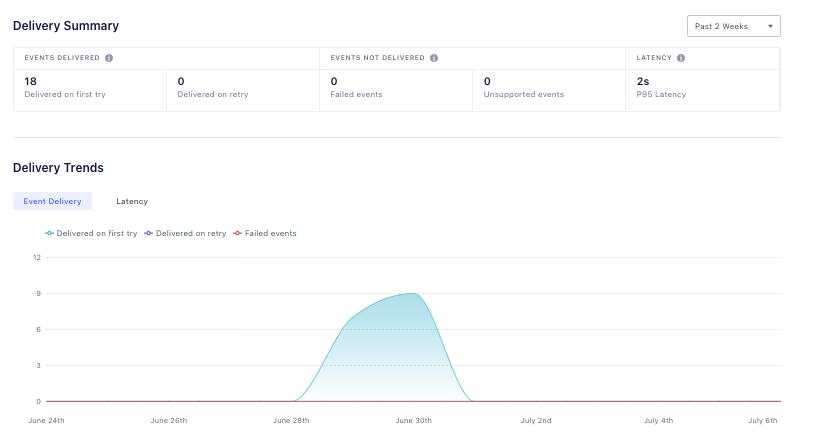
If you are setting up a new source, or even just new events, this Event Delivery information can be invaluable because it allows you to ensure that the destination is going to accept the event in the structure that you’re sending it.
Bearing this in mind, you can see how what once may have seemed like a black box actually allows for many points of visibility into what is happening to your events and when! You can have a snapshot of the events right as they are received with the Source Debugger, ensure you’re only receiving what you expect to with Protocols, and also see if there were any issues when events were delivered from Segment to your end destination.

Our annual look at how attitudes, preferences, and experiences with personalization have evolved over the past year.