For the past five years, nearly every company on the market has tried to become ‘data-driven’. You don’t want intuition and gut feelings driving company strategy. You want hard facts.
The unfortunate reality is that being ‘data-driven’ is incredibly hard to achieve in practice.
You need the relevant data from hundreds of different systems at your fingertips. You need to know where it lives, how it’s generated, and how to analyze it. And if you’re missing a key insight, you might be taking your company in the wrong strategic direction, costing you months of wasted effort and millions in spend.
Today, we’d like to share the story of one of the most data-informed companies we’ve seen amongst our thousands of customers: Houseparty.
In this post, Jeff Needles from Houseparty, shares how they’ve killed 40% of their experiments, increased signups across the board, and continuously focused on metrics and engagement. It’s a masterclass in using data to power your business.
Houseparty makes it incredibly easy for groups of up to 8 friends to get together and hang out in a video chat room. Over the years, the app has grown to host tens of millions of users, who on average, spend more than an hour per day chatting with their friends. In total, their users are generating more than seven billion data points every single month.
In order to make an impact, Jeff has scaled both the way they collect data and the way they experiment, so that he is able to provide the value of a much bigger team without doing extra manual work. These efforts have helped them reliably collect billions of events, run over one hundred experiments in the last year, and improve iOS invites-sent by 64%.
Collecting terabyte-scale data
Jeff knew Houseparty needed to invest in data collection from the start—but he had one problem.
Houseparty operates at a massive scale. Finding tools which would scale to billions of incoming events was one of the top requirements.
The search wasn’t easy. After testing to find the perfect combination of cost-effective tools that provided the deep insights he needed, he decided on the following architecture:

-
Collect user events via Segment
-
Send those events into Taplytics and Amazon Redshift
-
Analyze the Amazon Redshift data in Periscope.
With this simple setup, Jeff can quickly analyze the terabytes of data Houseparty is storing. His entire team can use Periscope to put together ad hoc reports and explore their data, while Jeff can query Amazon Redshift directly to get deep answers to his questions.
Not all experiments are good
With his data infrastructure in place, Jeff focused on helping his product team iterate fast and easily understand their results.
Experimentation is part of the Houseparty DNA. At their weekly team meeting, anyone is able to propose new ideas to test—ranging from app features to ideas for push notifications. The product team then decides to take some of these ideas and turn them into real experiments—fast.
Every experiment they ship is paired with a specific hypothesis to test. The team states which metrics they hope to move and how much they hope to move them. Then, they actually roll out the change to a cohort of users to see the results.
In the last year, Houseparty has run more than 100 different experiments, each backed by their own SQL query. Each experiment is analyzed using a consistent set of SQL queries running against the warehouse based on metrics that Houseparty team members can select using a simple UI.

Because the data is standardized in the warehouse using Segment’s schema, looking for statistical significance in a wide array of metrics is easy.
Every experiment has a default set of global metrics (retention, online-ness, and time in conversation) as well as additional local metrics unique to the experiment.
Results are calculated and stored every few hours for all active experiments.
While the results are continuously being calculated, the team reviews results at their weekly meeting to enforce solid practices. The team only look at results for the experiments that are statistically significant, have had enough time lapsed, and have a full cohort of users. Once all of those pieces are in place, the team makes a decision: ship it or kill it.
This weekly cadence helps the team stay laser-focused on user engagement. If an experiment is actively hurting their metrics, they kill it. No questions asked.
Last year, Jeff and team have run more than 100 experiments and have decided to fully roll out 60% of them.

In the above graph, his team modeled their growth rate if they had shipped 100% of all experiments (the red line) vs the just the set of experiments they decided to keep (the green line).
Shipping all experiments would have created a 40% drag on the business!
This shocked us. We can only wonder about how many areas of other businesses are being actively harmed, just because the team behind it isn’t measuring the impact.
Different users call for different experiences
One of the most exciting aspects of constant experimentation is that it allows you to discover really powerful insights that don’t seem obvious at first. One of those insights for Jeff is that Android users behave very differently than their iOS counterparts.
Regarding a redesign the team undertook last year, Jeff noted…
We tested everything. No matter what experiments we launch to unify the iOS and Android app experiences, they always perform worse.
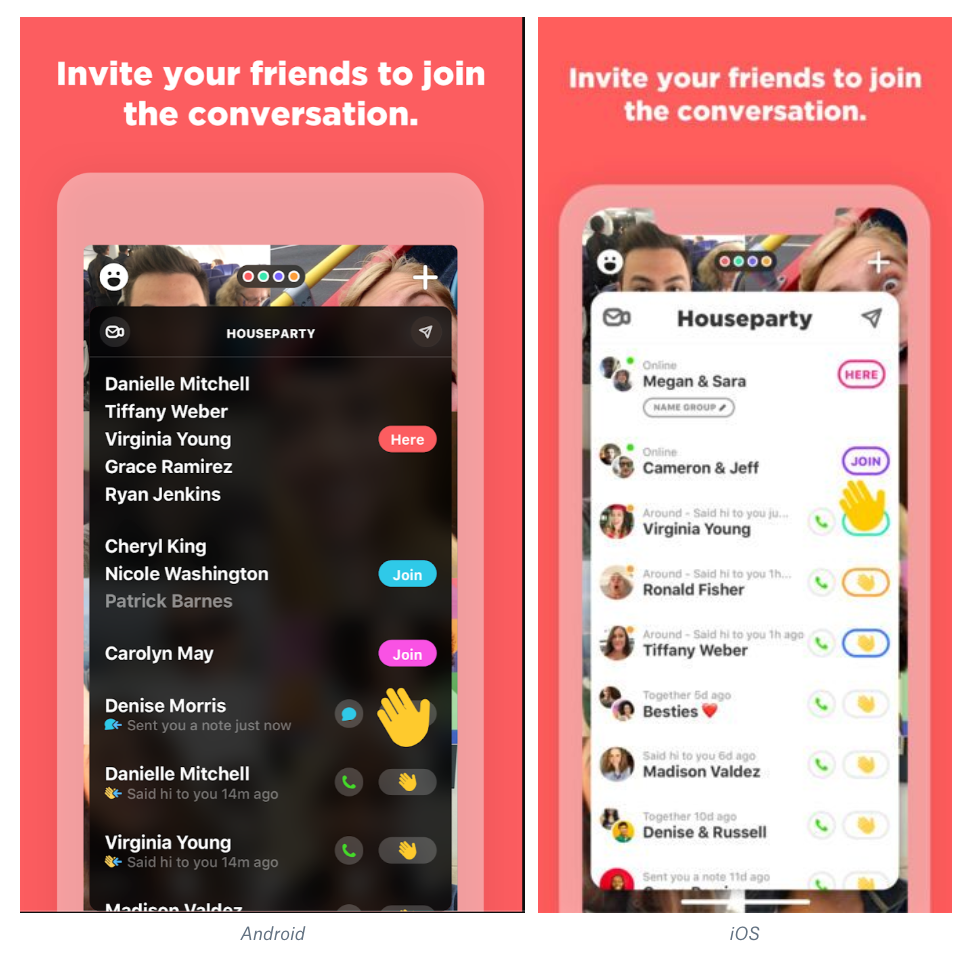
The bright side is that these same insights have helped them optimize the user experience for each set of users. Depending on the operating system, the user will receive a very different UI. Android users get a dark, translucent theme, but for iOS, it’s a light flat theme.

The differences don’t stop there. One of the biggest drivers of new Houseparty users comes from invites from friends. One friend will text another asking if they’d like to join them on the app. This text invitation is the single most important factor driving the company’s growth.
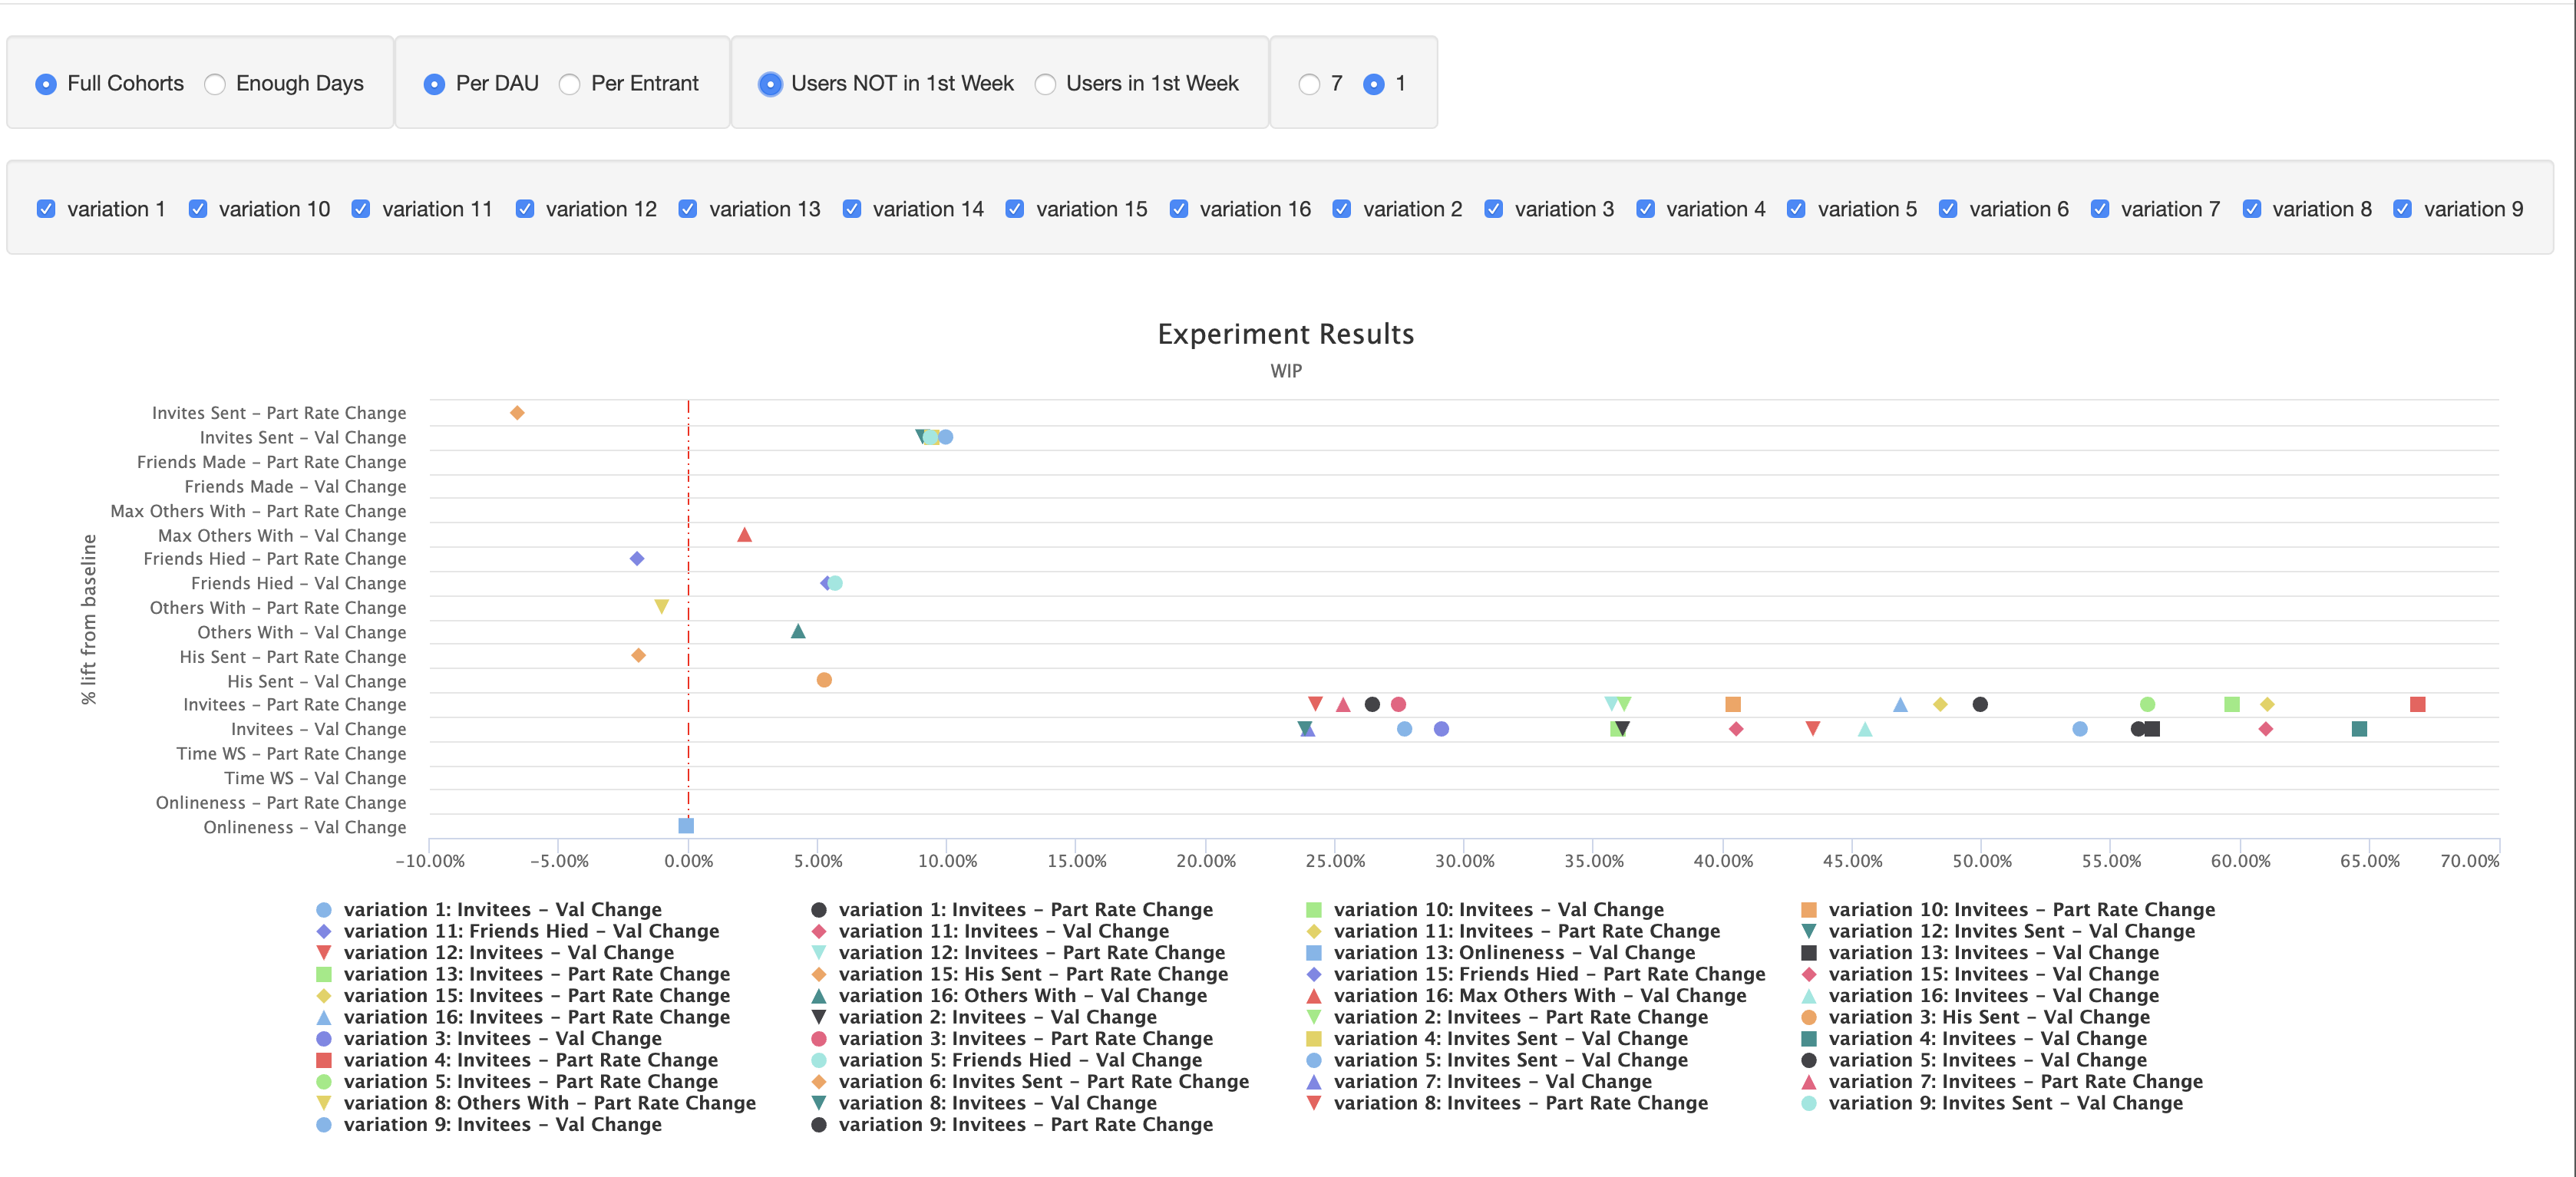
The team experimented with 16 different variations of the invite text, ranging from the mundane to the bizarre.
The winning entries? Well… they were different. iOS and Android each got their own text message. On iOS the text read “let’s (house)party”, on Android: “we need to talk ”.
This slight tweak increased the number of invites sent by 64% on iOS and 27% on Android! A massive improvement for overall viral growth.
When data informs
After talking with Jeff, it’s pretty clear that using data has revolutionized Houseparty’s business. Even as a small team, they’ve been able to use their metrics to achieve:
-
a 64% increase in invites sent on iOS
-
a 27% increase in invites sent on Android
-
certainty in the 60% of experiments which drive growth
-
avoiding the 40% of experiments which hurt engagements
-
separate tailored experiences for ios and android
These tools are just one tiny example of how Houseparty has used great data to power experimentation, which powers personalization, which in turn has inflected their growth curve.
With a product team that can test any idea, and get to statistical significance within the shortest possible window, the sky's the limit for where Houseparty can go.

The State of Personalization 2023
Our annual look at how attitudes, preferences, and experiences with personalization have evolved over the past year.