News

Act on your Data! Build Quick Customer Audiences with RFM Modeling

The term 'RFM' stands for Recency, Frequency, and Monetary Value. Tracking these three fairly straightforward characteristics allows you to quickly build complex models about how your customers relate to your brand, and how you should engage with them.

Nov 18, 2021

By Humberto Oliveira, Seth Familian, Charles Crawford


Twilio Segment Personas is now part of Segment’s Twilio Engage product offering.

If you were going to pick the business jargon term of the decade, it would be hard to go wrong with “data-driven.” Everyone wants to be data-driven these days. Data-driven decision making, data-driven marketing programs, data-driven sandwich options!

And while basing decisions on reliable data is a great idea, the problem is that, well, data’s hard. Getting it, managing it, and figuring out what to do once you have it.

Segment was built to solve those first two problems, but it’s still up to individual PMs, Marketers, and Analysts (not to mention Segment’s amazing Professional Services team - hit us up!) to make use of all that data after it’s been collected and cleaned. This post will walk through a very useful framework for analyzing customer behavioral data, highlight how Segment makes it possible, and discuss how you can act on it.

Recency, Frequency, and Monetary Value (RFM)

The RFM model is something you may remember from a marketing or business class. (And if you do, nice work! Your prof. would be pleased.) It stands for Recency, Frequency, and Monetary Value - three crucial indicators of the value of any given customer.

  • Recency - when did the customer last make a purchase?

  • Frequency - how often do they purchase?

  • Monetary value - how much did they spend?

The basic idea is that tracking these three fairly straightforward characteristics allows you to quickly build complex models about how your customers relate to your brand, and how you should engage with them. For example:

  1. A customer who used to buy a lot from you, but hasn’t lately (high frequency, low recency) might be a target for re-engagement programs. But what if they’re in the bottom decile for monetary value? Maybe not worth the effort.

  2. A customer who consistently makes a lot of small purchases (high frequency, high recency) is probably a great champion for your product, regardless of the monetary value they offer. Even if their LTV is on the low end, maybe they can serve as a reference account!

As you can see, the combination of all three factors gives you a great starting point for understanding any given customer. Better yet, applied programmatically, you can get this picture of all your customers at once.

A basic framework might look like this:

Loyalty Segments
Customer loyalty, based on recency and frequency.

And would further split out, based on customer value:

Value Segments
Loyalty measures broken out by monetary value.

Building an RFM Model

The pitfall that many people face when they try to apply RFM is a classic - they do it themselves instead of letting the data do it for them. For example, they’ll define ranges for each metric manually, usually starting from a hypothetical “best” customer. Maybe they talk to Sales, and find out that high-spend customers usually hit a particular LTV. Or they review last quarters’ data and find out that high-frequency customers made X number of purchases.

A model that results from this kind of process is dangerous. It feels very data-driven, but in fact it’s built on a foundation of guesswork. A salesperson’s idea of a great customer often doesn’t perfectly align with the company’s longer-term view. Similarly, if the data-pull from last quarter included Black Friday, the resulting picture of “good” or “bad” customers’ purchasing habits would be quite distorted.

Setting the accuracy problems aside, the other major downside to this approach is simply time. Surveying salespeople, and working with your data department (if you’re lucky enough to even have one) can constitute the bulk of the time required to build the model.

As you might have guessed, there’s a better way. So let’s put our CDP to work!

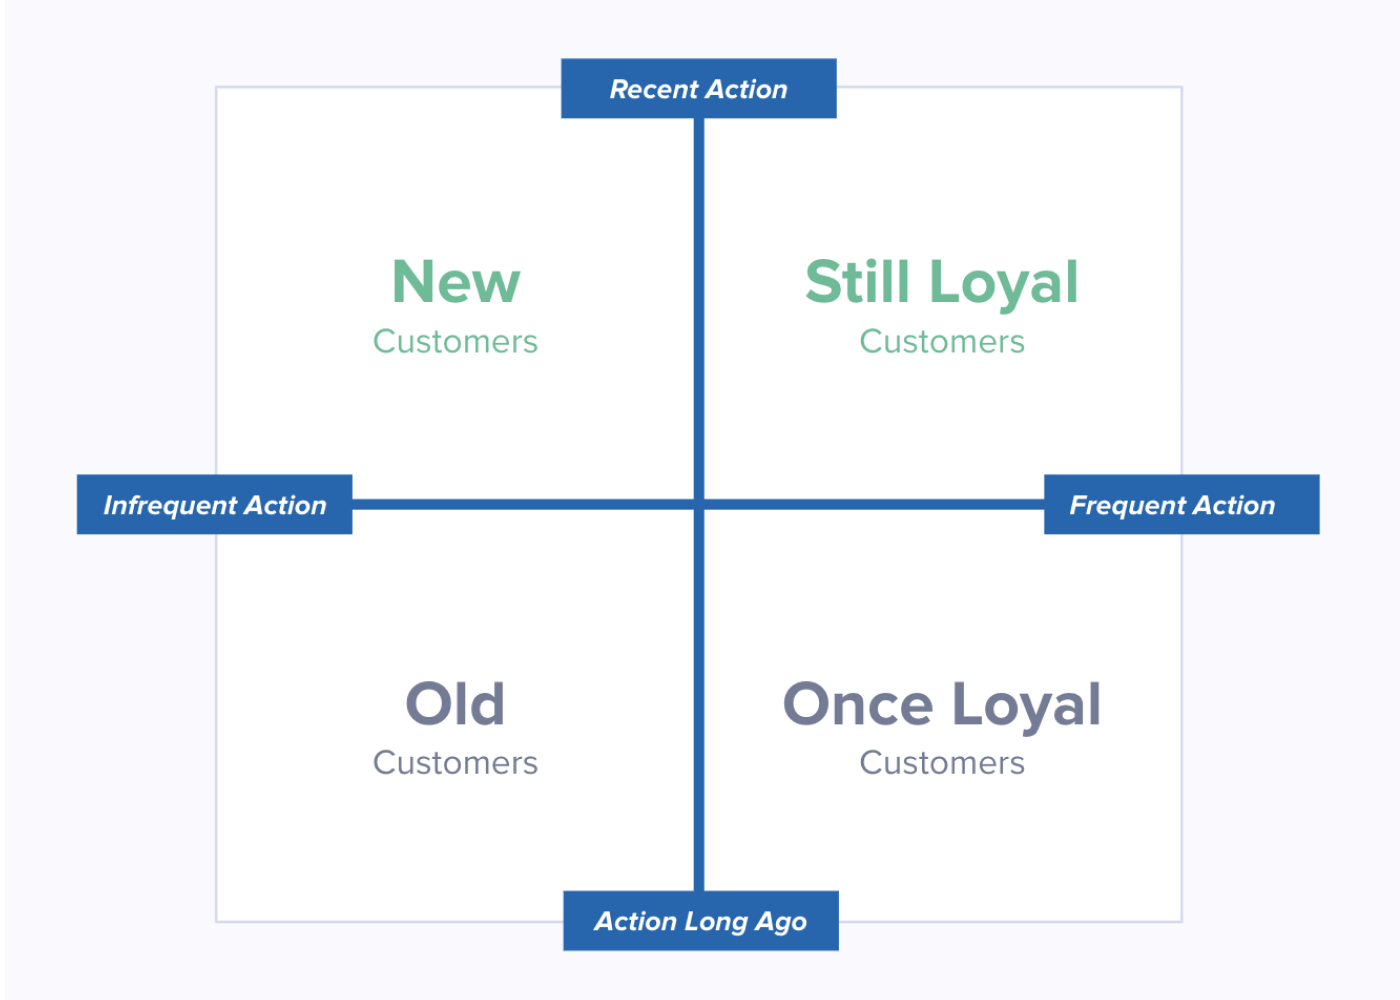
Building an RFM Model with Data

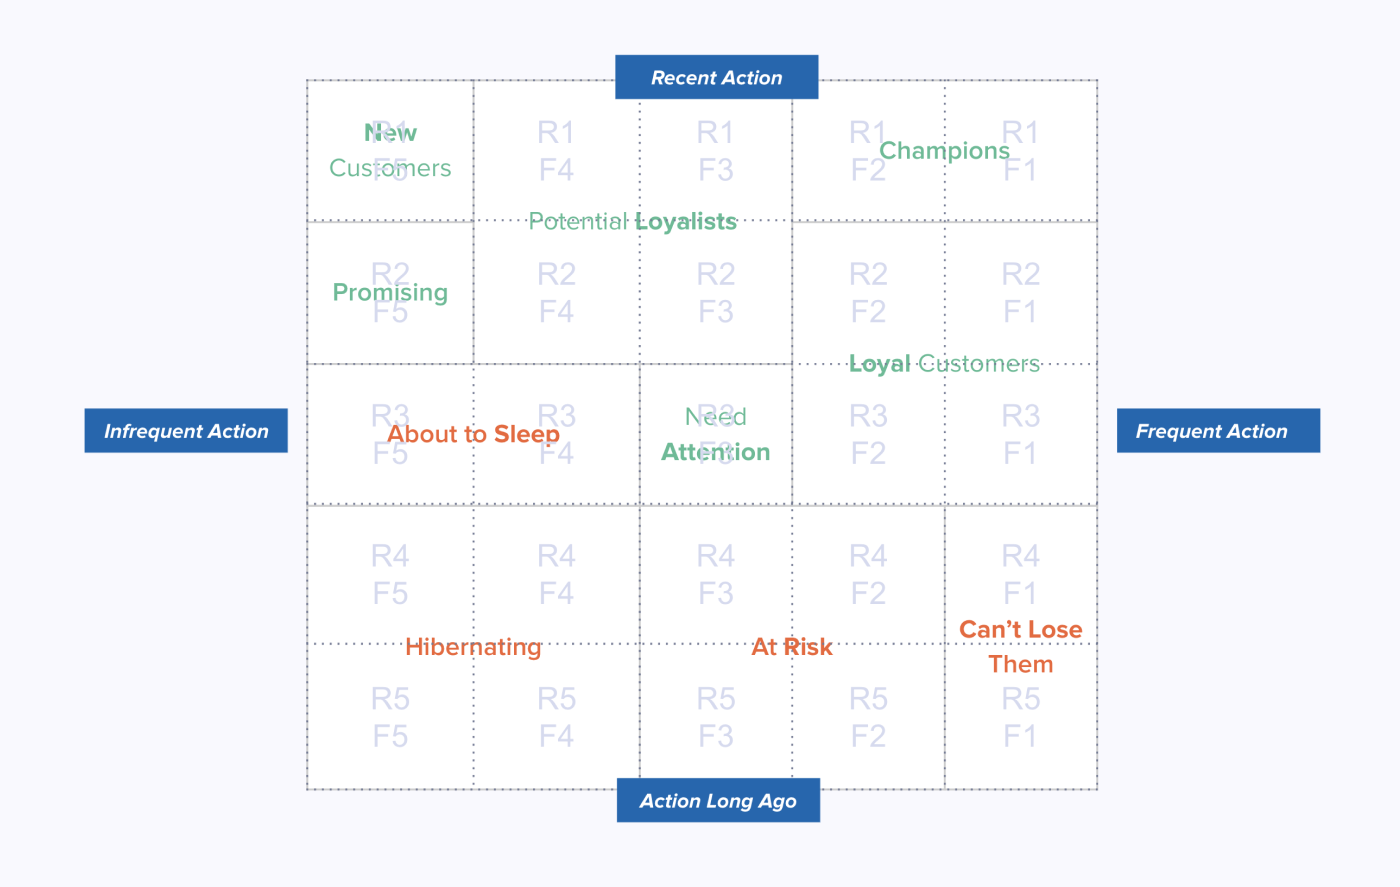
Our intuition is usually that we build a model, then populate it with data, and see what it spits out. However, with the right tools, an RFM model can build itself. Rather than manually defining exact boundaries for our ranges, we can let our data (AKA, the behavior of our customers in the market) establish them organically.

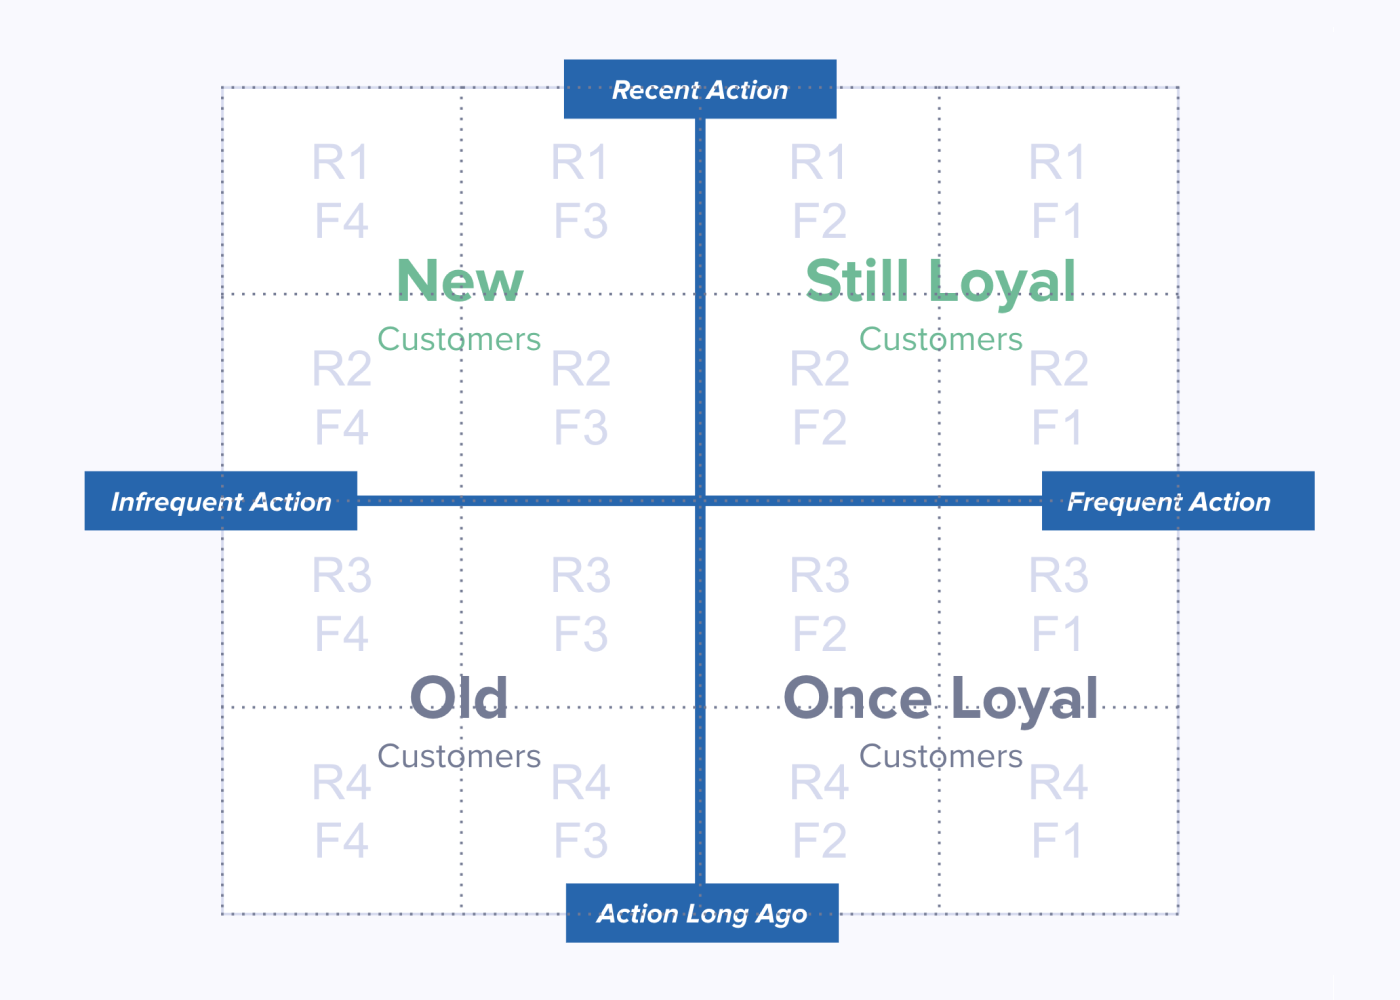
Segment’s Personas product has a feature called SQL Traits, which allows you to query your data warehouse, and define audiences with the results. SQL, in turn, has functions that evenly divide returned results into quartiles, quintiles, deciles, n-tiles. You get an even split, every time, and because that split is based on the live data from your warehouse, it’s always applicable. You build the model once, and it evolves right along with your product, customer base, and market.

Here’s an example query. You can paste this right into Segment, but hold your horses - we’re going to build on this, and we’ve got a unified query at the end. (Note: this query is written around “oc” (Order Completed) events, with a “revenue” property, but you can adjust based on your company’s naming conventions.)

select oc.user_id, oc.ltv, oc.total_orders, oc.last_order_date, -- Define RFM in 4 equal ranges: NTILE(4) OVER(ORDER BY oc.last_order_date desc) AS r, NTILE(4) OVER(ORDER BY oc.total_orders desc) AS f, NTILE(4) OVER(ORDER BY oc.ltv desc) AS m from ( select user_id, -- Capturing the raw values to compose RFM: max("timestamp") as last_order_date, -- underlying R value count(total) as total_orders, -- underlying F value sum(total) as ltv -- underlying M value from order_completed group by user_id ) oc

Presto! We’ve split customers into constantly-updated quartiles. The first RFM model we've built from this incorporates both Recency and Frequency.

Programatic Model
Customers split by recency and frequency quartile.

We can get even fancier by assigning this “loyalty segment” language right in the query.

select user_id, -- Define the Value Segments from R and F scores: CASE WHEN l.r <= 2 and l.f >= 3 THEN 'new' -- recent but not frequent WHEN l.r <= 2 and l.f <= 2 THEN 'still_loyal' -- recent and frequent WHEN l.r >= 3 and l.f >= 3 THEN 'old' -- not recent and not frequenct WHEN l.r >= 3 and l.f <= 2 THEN 'once_loyal' -- not recent but frequent END AS loyalty_segment, -- Preserve the lanes values to stamp on the traits l.r as r_score, l.f as f_score, l.m as m_score, l.ltv, l.total_orders, l.last_order_date from ( -- QUERY 1 ) l

And of course we need to layer on the Monetary Value component, which will produce two of these grids, for both low- and high-value customers. You could visualize this as a cube, if you’re the 12-dimensional-chess-playing type, but we’ll keep it simple for blog purposes.

select user_id, loyalty_segment, -- Define Value Segments CASE WHEN m_score >= 3 THEN 'low_value' WHEN m_score <= 2 THEN 'high_value' END AS value_segment, r_score, f_score, m_score, (ltv/total_orders) as aov, -- because, why not? :) ltv, total_orders, last_order_date from ( -- QUERY 2 ) loyalty_segment

Congrats! Your Personas instance knows about eight customer segments, and they are automatically generated, accurate, and up-to-date at all times. Now it’s time to activate!

Putting RFM to work

In this context, your goal is to move customers up and to the right, as well as from the low-value to high-value chart. (Incidentally, with our “track” events, Segment can monitor that movement between audiences, too, and deliver it to your analytics platform of choice.) This is where you come in, with specific knowledge of your product, customers, and market. 

Segment will help by letting you power your entire stack with these new audiences. Depending on your strategy and use-cases, you can deliver them to:

  • Advertising platforms like Google, Facebook, and Pinterest

  • Email marketing tools like Klaviyo, and Sendgrid

  • SMS destinations like Twilio

  • Customer service tools like Zendesk, and Intercom 

Here’s a simple example of the kind of campaigns that suggest themselves:

Basic Campaign Options
A simple set of campaigns to improve customer relationships.

But the sky is really the limit at this point. For example, a house-of-brands could model according to multiple sub-brands, like so:

Brand/Category Affinities
Layered value/loyalty segments by sub-brand.

Or you could split by pentiles, and get ultra-granular with your strategies:

Granular Segmentation
Customers sorted by pentiles, based on recency and frequency.

So that’s RFM in a nutshell, made easy by Segment Personas. As promised, here’s the full query. Segment customers can implement directly in the Personas SQL Traits UI, and if you need help with implementation, we have Professional Services experts that can help out. Now get out there, and show ‘em that “data-driven” isn’t just a buzz-word!

SELECT user_id, -- stamp underlying R,F,M scores onto profile as traits l.r AS r_score, l.f AS f_score, l.m AS m_score, -- provide useful metrics which drive RFM scores l.ltv AS ltv, l.total_orders AS order_count, (ltv/total_orders) AS aov, -- Define the Loyalty Segments from R and F scores: CASE WHEN l.r <= 2 AND l.f >= 3 THEN 'new' -- recent but not frequent WHEN l.r <= 2 AND l.f <= 2 THEN 'still_loyal' -- recent and frequent WHEN l.r >= 3 AND l.f >= 3 THEN 'old' -- not recent and not frequenct WHEN l.r >= 3 AND l.f <= 2 THEN 'once_loyal' -- not recent but frequent END AS loyalty_segment, -- Define Value Segments CASE WHEN l.m >= 3 THEN 'low_value' WHEN l.m <= 2 THEN 'high_value' END AS value_segment, FROM ( SELECT oc.user_id, oc.ltv, oc.total_orders, -- Define RFM: NTILE(4) OVER(ORDER BY oc.last_order_date DESC) AS r, NTILE(4) OVER(ORDER BY oc.total_orders DESC) AS f, NTILE(4) OVER(ORDER BY oc.ltv DESC) AS m -- 25% of top spenders will be here FROM ( SELECT user_id, -- Capturing the raw values to compose RFM: MAX(timestamp) AS last_order_date, -- underlying R value COUNT(total) AS total_orders, -- underlying F value SUM(total) AS ltv -- underlying M value FROM 'YOUR_SOURCE.order_completed' -- replace with your order completed table GROUP BY user_id ) oc ) l

The State of Personalization 2023

Our annual look at how attitudes, preferences, and experiences with personalization have evolved over the past year.

Get the report
SOP 2023

The State of Personalization 2023

Our annual look at how attitudes, preferences, and experiences with personalization have evolved over the past year.

Get the report
SOP 2023

Share article

Want to keep updated on Segment launches, events, and updates?

We’ll share a copy of this guide and send you content and updates about Twilio Segment’s products as we continue to build the world’s leading CDP. We use your information according to our privacy policy. You can update your preferences at any time.