Spotting a million dollars in your AWS account
Recently we shared the techniques we used to save more than a million dollars annually on our AWS bill. While we went into detail about the various problems and solutions, the most common question we heard was: "I know I’m spending a ton on AWS, but how do I actually break that into understandable pieces?"
At face value, this sounds like a fairly straightforward problem.
You can easily split your spend by AWS service per month and call it a day. Ten thousand dollars of EC2, one thousand to S3, five hundred dollars to network traffic, etc. But what’s still missing is a synthesis of which products and engineering teams are dominating your costs.
Then, add in the fact that you may have hundreds of instances and millions of containers that come and go. Soon, what started as simple analysis problem has quickly become unimaginably complex.
In this follow-up post, we’d like to share details on the toolkit we used. Our hope is to offer up a few ideas to help you analyze your AWS spend, no matter whether you’re running only a handful of instances, or tens of thousands.
If you’re operating AWS at scale–it’s likely that you’ve hit two major problems.
First, it’s difficult to notice if one part of the engineering team suddenly starts spending a lot more than it used to.
Our AWS bill is six figures per month, and the charges for each AWS component change rapidly. In a given week, we might deploy five new services, optimize our DynamoDB throughput, and add hundreds of customers. In this environment it’s easy to overlook that a single team spent $20,000 more on EC2 this month than they did last month.
Second, it can be difficult to predict how much new customers will cost.
As background, Segment offers a single API which can send analytics data to any number of third-party tools, data warehouses, S3, or internal data pipelines.
While customers are good at predicting how much traffic they will have and the products they’d like to use, we’ve historically had trouble translating this usage information to a dollar figure. Ideally we’d like to be able to say "1 million new API calls will cost us $X so we should make sure we are charging at least $Y."
Our solution to these problems was to bucket our infrastructure into what we dubbed ‘product areas’. In our case, these product areas are loosely defined as:
integrations (the code that sends data from Segment to various analytics providers)
API (the service that receives data customer libraries sent to Segment)
warehouses (the pipeline that loads Segment data into a customer's data warehouse)
website and CDN
internal (shared support logic for the four above)
In scoping the project, we realized it would be next to impossible to measure everything. So instead, we decided to target a percentage of the costs in the bill, say, 80%, and try to get that measurement working end-to-end.
It's better to deliver business value analyzing 80% of the bill than to shoot for 100%, get bogged down in the collection step, and never deliver any results. Shooting for 80% completeness (being willing to say "it's good enough") ended up saving us again and again from rabbit-holing into analysis that didn’t meaningfully impact our spend.
To break out costs by product area, we need to gather data for the billing system which we had to collect and then subsequently join together:
the AWS billing CSV - the CSV generated by AWS to provide the full billing line items
tagged AWS resources – resources which could be tagged within the billing CSV
untagged resources – services like EBS and ECS that required custom pipelines to tag usage with ‘product areas’
Once we calculated the product areas for each of these pieces of data, we could load them into Redshift for analysis.
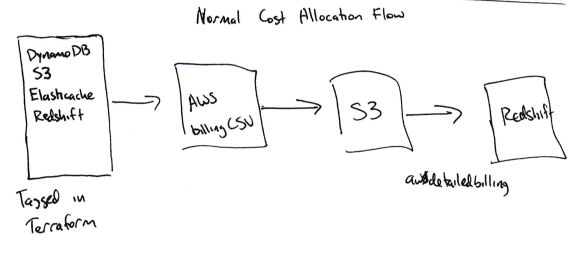
The place to start to understand your spend is the AWS Billing CSV. You can enable a setting in the billing portal and Amazon will write a CSV with detailed billing information to S3 every day.
By detailed, I mean VERY detailed. Here is a typical billing row:
That row is a charge for a whopping $0.00000001, or one one-millionth of a penny, for DynamoDB storage on a single table between 3AM and 4AM on February 7th. There are about six million rows in our billing CSV for a typical month. (Unfortunately, most cost more than a millionth of a penny.)
We use Heroku's awsdetailedbilling tool to copy the billing data from S3 to Redshift. This was a good first step, but we didn't have a great way to correlate a specific AWS cost with our own product areas (e.g. whether a given instance-hour is used for the integrations or warehouses product areas).
What’s more, about 60% of the bill is consumed by EC2. Despite being the lions’ share of the cost, understanding how a given EC2 instance mapped to a product area was impossible with the data provided by the billing CSV.
There’s a good reason why we couldn’t just use instance names to determine product areas. Instead of running a single process per host, we make heavy use of ECS (Elastic Container Service), to stack hundreds of containers on a host and achieve much higher utilization.
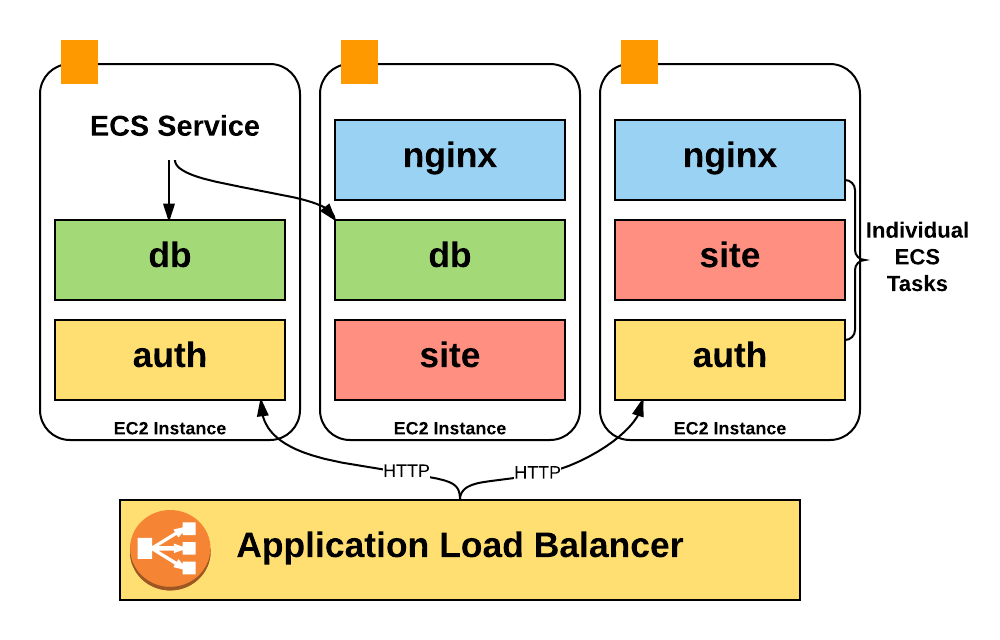
Unfortunately, Amazon bills only for the EC2 instance costs, so we had zero visibility into the costs of the containers running on an instance: how many containers we were running at a typical time, how much of the pool we were using, and how many CPU and memory units we were using.
Even worse, information about container auto-scaling isn’t reflected anywhere in the billing CSV. To get this data for analysis, we had to write our own tooling to gather and then process it. I’ll cover how this pipeline works in the following sections.
Still, the AWS Billing CSV will provide very good granular usage data that will become the basis for our analysis. We just need to associate that data with our product areas.
Note: This problem isn’t going away either. Billing by the instance-hour is going to be a bigger and bigger problem from a "what am I spending money on?" perspective, since more companies are running fleets of containers across a set of instances, with tools like ECS, Kubernetes and Mesos. In a slight twist of irony, Amazon has had this same problem for years - each EC2 instance is a Xen hypervisor, being run on the same bare metal machine as other instances.
The most important and readily available data comes from ‘tagged’ AWS resources.
Out of the box, the AWS billing CSV doesn’t include any tags in its analysis. As such, it’s impossible to discern how one EC2 instance or bucket might be used vs another.
However, you can enable certain tags to appear alongside your line item costs using cost allocation tags.
These tags are officially supported by many AWS resources, S3 buckets, DynamoDB tables, etc. You can toggle a setting in the AWS billing console to make a cost allocation tag show up in the CSV. After a day or so, your chosen tag (we chose product_area) will start showing up as a new column next to the associated resources in the detailed billing CSV.
If you are doing nothing else, start by using cost allocation tags to tag your infrastructure. It’s essentially ‘free’ and requires zero infrastructure to run.
After we enabled cost allocation tags, we had two challenges: 1) tagging all of the existing infrastructure, and 2) ensuring that any new resources would automatically have tags.
Tagging your existing infrastructure
Tagging your existing infrastructure is pretty easy: for a given AWS product, query Redshift for the resources with the highest costs, bug people in Slack until they tell you how those resources should be tagged, and stop when you've tagged 90% or more of the resources by cost.
However, enforcing that new resources stay tagged requires some automation and tooling.
To do this, we use Terraform. In most cases, Terraform's configuration supports adding the same cost allocation tags that you can add via the AWS console. Here's an example Terraform configuration for a S3 bucket:
Though Terraform provided the base configuration, we wanted to verify that every time someone wrote resource "aws_s3_bucket" into a Terraform file, they included a product_area tag.
Fortunately Terraform configurations are written in HCL (Hashicorp Configuration Language), which ships with a comment preserving configuration parser. So we wrote a checker that walks every Terraform file looking for taggable resources lacking a product_area tag.
We set up continuous integration for the repo with Terraform configs, and then added these checks, so the tests will fail if anyone tries to check in a tag-able resource that's not tagged with a product area.
This isn't perfect - the tests are finicky, and people can still technically create untagged resources directly in the AWS console, but it's good enough for now–the easiest way to provision new infrastructure is via Terraform.
Rolling up cost allocation tag data
Once you've tagged resources, accounting for them is fairly simple.
Find the product_area tags for each resource, so you have a map of resource id => product area tags.
Sum the unblended costs for each resource
Sum those costs by product area, and write the result to a rollup table.
SELECT sum(unblended_cost) FROM awsbilling.line_items WHERE statement_month = $1 AND product_name='Amazon DynamoDB';
You might also want to break out data by AWS product - we have two separate tables, one for Segment product areas, and one for AWS products.
We were able to account for about 35% of the bill using traditional cost allocation tags.
Analyzing Reserved Instances
This approach works great for tagged, on-demand instances. But in some cases, may have paid AWS up front for a ‘reservation’. Reservations guarantee a certain amount of capacity, in exchange for up-front payment at a lower fixed rate.
In our case, this means several large charges that show up in the December 2016 billing CSV need to be amortized across each month in the year.
To properly account for these costs, we wanted to use the unblended cost that was incurred in the desired time period. The query looks like this:
Subscription costs take the form "$X0000 of DynamoDB," so they are impossible to attribute to a single resource or product area.
Instead, we sum the per-resource costs by product area and then amortize the subscription costs according to the percentages. If the warehouses pipeline used 60% of our EC2 compute costs, we assume it used 60% of the reservation as well.
This isn't perfect. If a large percentage of your bill is reserved up front, this amortization strategy will be distorted by small changes in the on-demand costs. In that case you'll want to amortize based on the usage for each resource, which is more difficult to sum than the costs.
While tagging instances and DynamoDB tables is great, other AWS resources don't support cost allocation tags. These resources required that we build a Rube Goldberg-ian-style workflow to successfully get the cost data into Redshift.
The two biggest untagged resources groups we had to deal with were ECS and EBS.
ECS
ECS is constantly scaling our services up and down, depending on how many containers a given service needs. It’s also responsible for re-balancing and bin-packing containers across individual instances.
ECS starts containers on hosts based upon “CPU and memory reservation”. A given service indicates how many CPU shares it requires, and ECS will either put new containers on a host with capacity, or scale up the number of instances to add more capacity.
None of these ECS actions are directly reflected within our AWS Billing CSV–but ECS is still responsible for triggering the auto-scaling for each of our instances.
Put simply, we wanted to understand what ‘slice’ of each machine a given container was using, but the billing CSV only gives us ‘whole unit’ breakdown by instance.
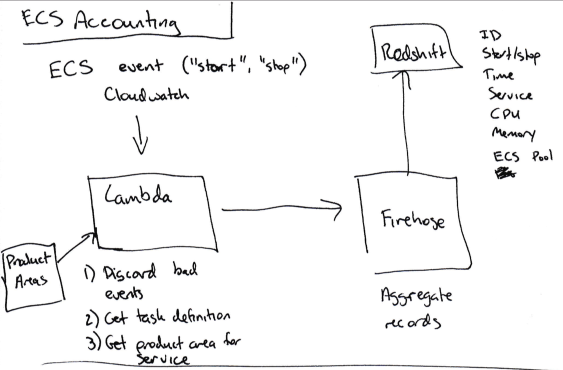
To determine the cost of a given service, we built our own pipeline that makes use of the following pieces:
Set up a Cloudwatch subscription any time an ECS task gets started or stopped.
Push the relevant data (Service name, CPU/memory usage, starting or stopping, EC2 instance ID) from the event to Kinesis Firehose (to aggregate individual events).
Push the data from Kinesis Firehose to Redshift.
Once all of the task start/stop/size data is in Redshift, we multiply the amount of time a given ECS task ran (say, 120 seconds) by the number of CPU units it used on that machine (up to 4096 - this info is available in the task definition), to get a number of CPU-seconds for each service that ran on the instance.
The total bill for the instance is then divided across services according to the number of CPU-seconds each one used.
It's not a perfect method. EC2 instances aren't running at 100% capacity all the time, and the excess currently gets divided across the services running on the instance, which may or may not be the right culprits for that overhead. But (and you may recognize this as a common theme in this post), it's good enough.
Additionally, we want to map the right product area for each ECS service. However we can't tag those services in AWS because ECS doesn't support cost allocation tags.
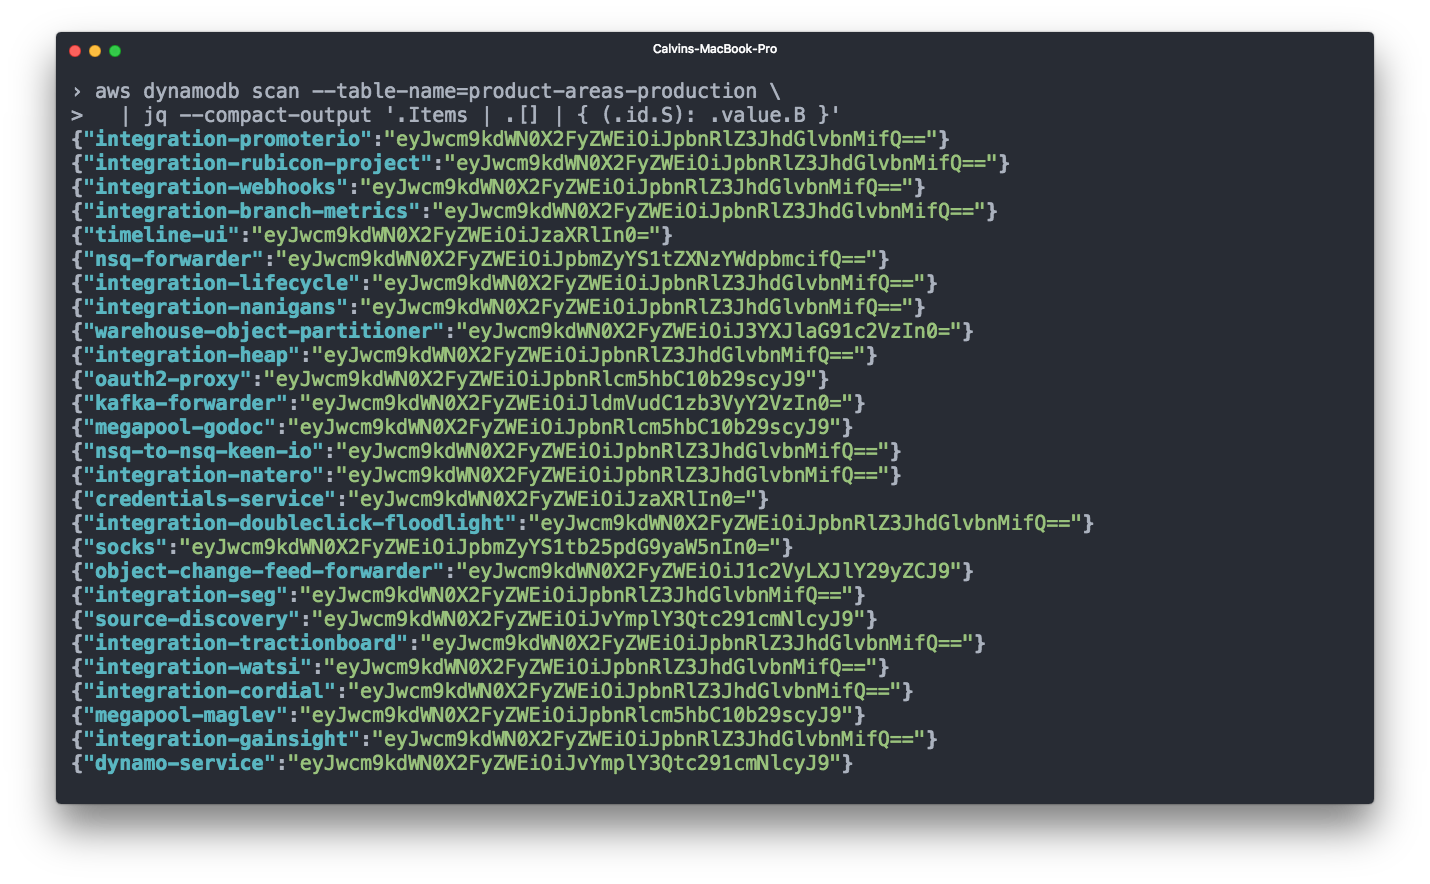
Instead we added a product_area key to the Terraform module for each ECS service. This key doesn't lead to any metadata being sent to AWS, but it does populate a script script that reads the product_area keys for each service.
That script then publishes the service name => b64encoded product area mappings to DynamoDB on every new push to the master branch.
Finally, our tests then validate that each new service has been tagged with a product area.
EBS
Elastic Block Storage (EBS) also makes up a significant portion of our bill. EBS volumes are typically attached to an EC2 instance, and for accounting purposes it makes sense to count the EBS volume costs together with the EC2 instance. However, the AWS billing CSV doesn't show you which EBS volume was attached to which instance.
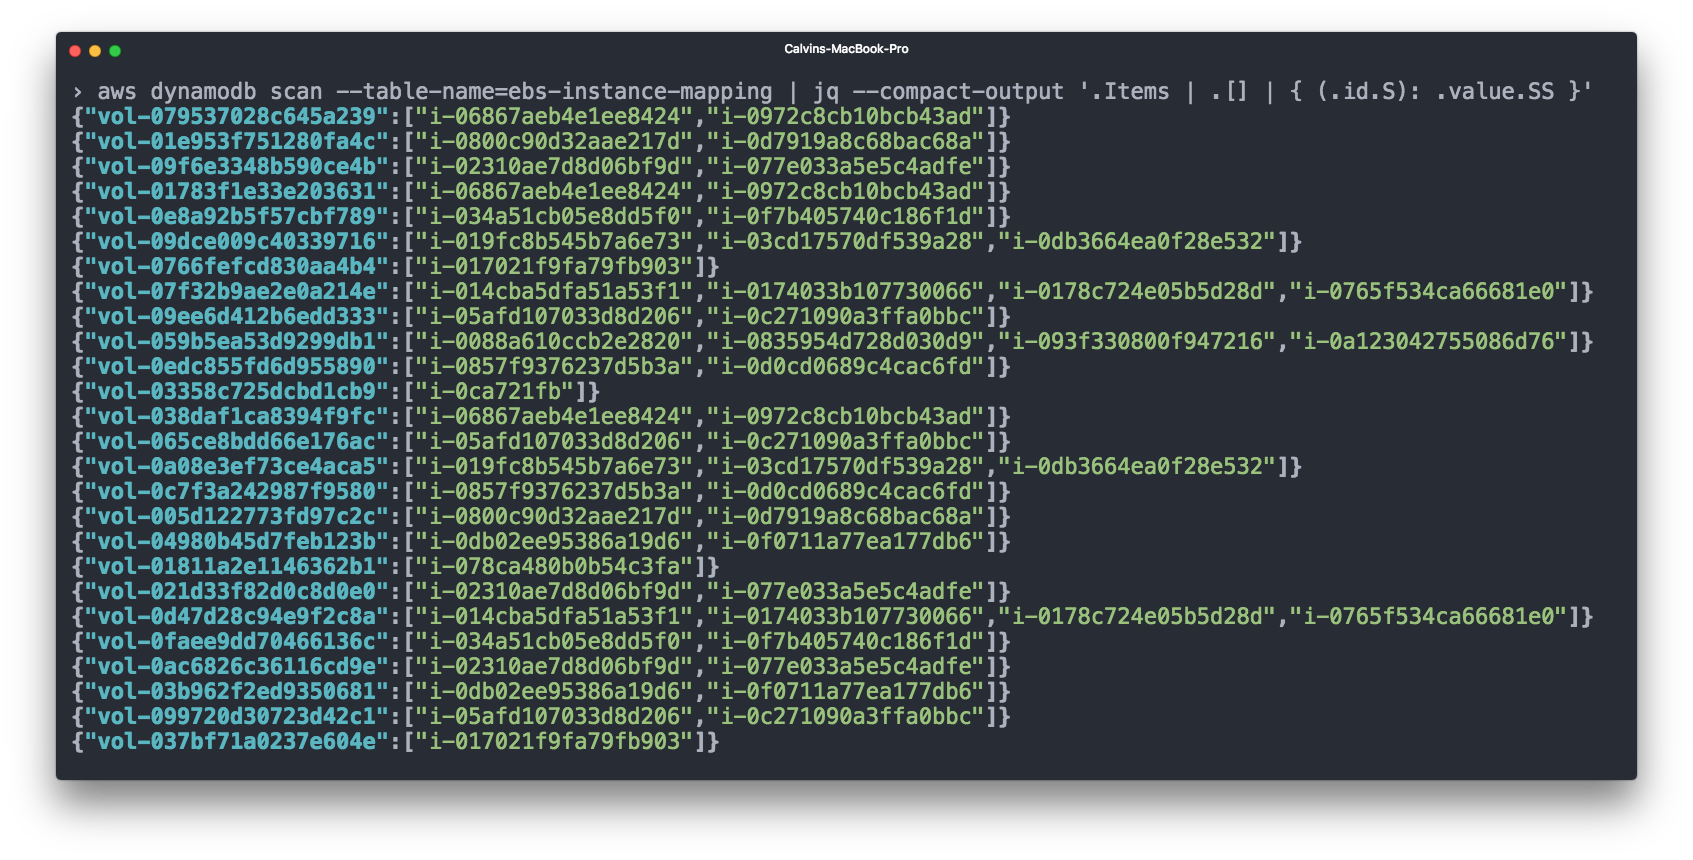
We again used Cloudwatch for this - we subscribe to any "volume attached" or "volume unattached" events, and then record the EBS => EC2 mappings in a DynamoDB table.
We can then add EBS volume costs to the relevant EC2 instances before accounting for ECS costs.
So far we’ve talked about all of our costs within the context of a single AWS account. However, this doesn’t actually reflect our AWS setup, which is spread across different physical AWS accounts.
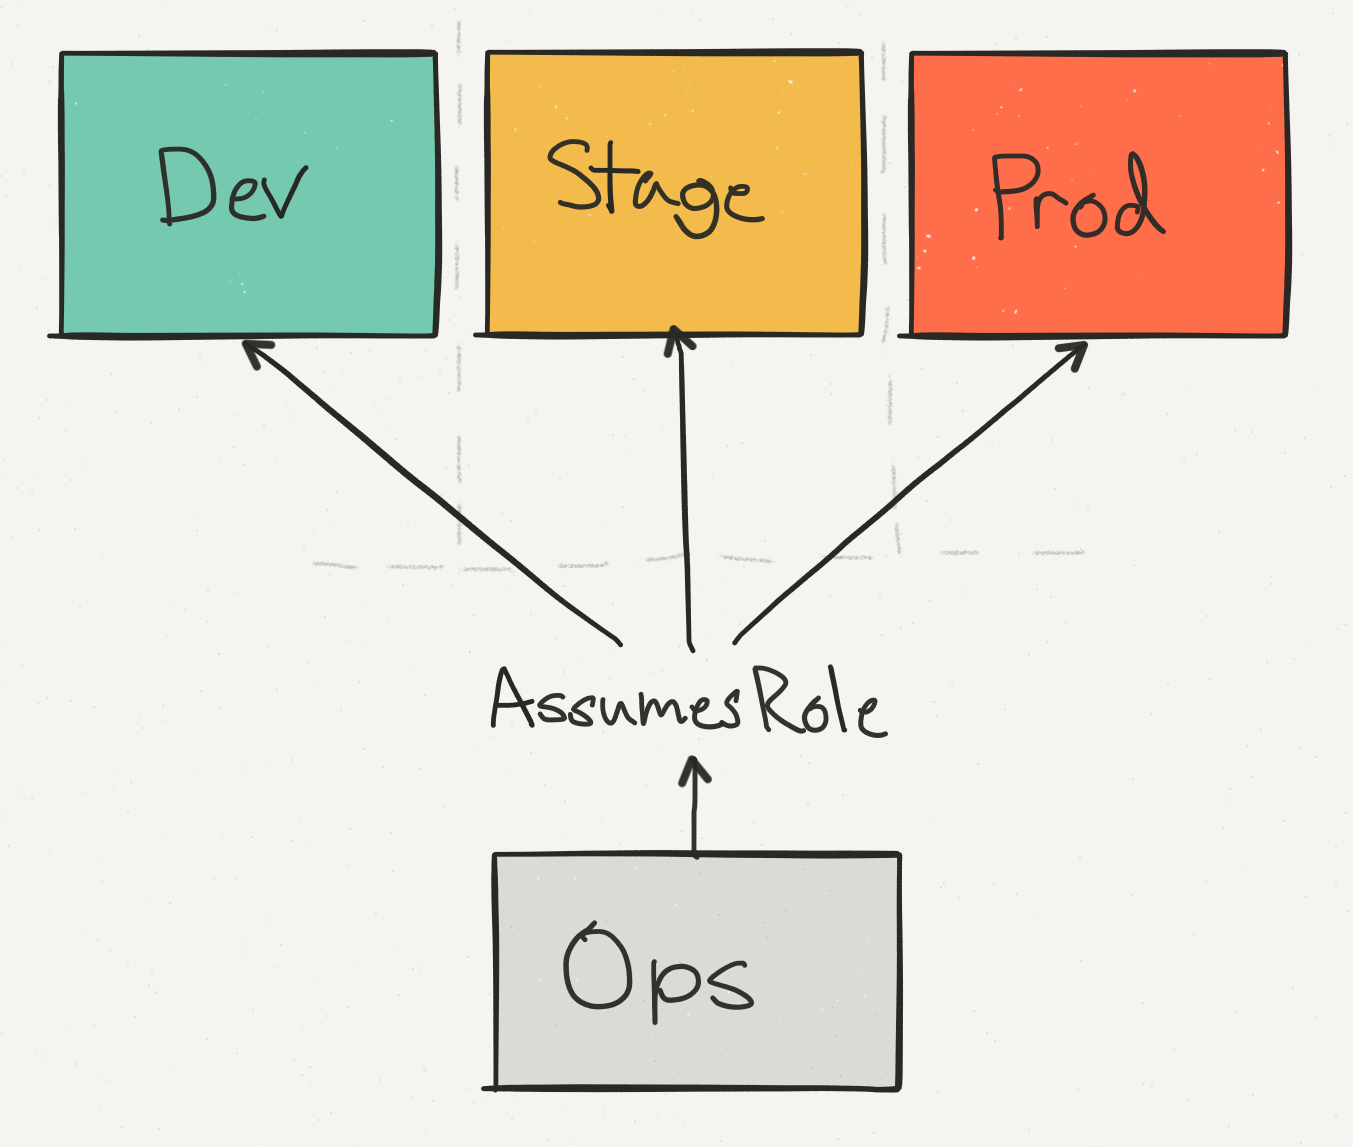
We use an ops account not only for consolidated, cross-account billing, but to help provide a single access point for engineers making changes to production. We separate staging from production to ensure that an API call which might, say, delete a DynamoDB table, can be run safely with the appropriate checks.
Of these accounts, prod dominates the cost–but our staging costs are still a significant percentage of the overall AWS bill.
Where this gets tricky is when we need to write the data about ECS services in the stage realm to the production Redshift cluster.
To achieve writing ‘cross account’, we needed to allow the Cloudwatch subscription handlers to assume a role in production that can write to Firehose (for ECS) or to DynamoDB (for EBS). These are tricky to set up because you have to add the correct permissions to the right role in the staging account (sts.AssumeRole) and in the production account, and any mistake will lead to a confusing permission error.
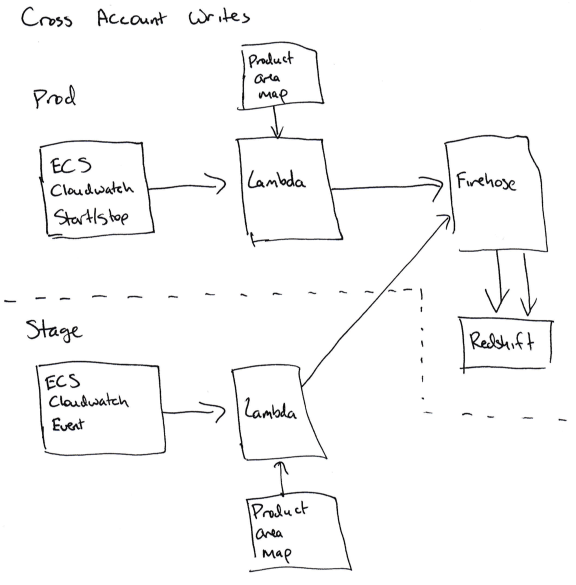
For us, this means that we don't have a staging realm for our accounting code, since the accounting code in stage is writing to the production database.
While it’s possible to add a second service in stage that subscribes to the same data but doesn't write it, we decided that we can swallow the occasional problems with the stage accounting code.
Finally we have all of the pieces we need to run proper analysis:
tagged resources in the AWS billing CSV
data about when every ECS event started and stopped
a mapping between ECS service names and the relevant product areas
a mapping between EBS volumes and the instances they are attached to
To roll all of this up for the analytics team, I broke out the analysis by AWS product. For each AWS product, I totaled the Segment product areas and their costs, for that AWS product.
The data gets rolled up into three different tables:
Total costs for a given ECS service in a given month
Total costs for a given product area in a given month
Total costs for a (AWS product, Segment product area) in a given month. For example, "The warehouses product area used $1000 worth of DynamoDB last month."
The total costs for a given product area look like this:
And the costs for an AWS product combined with Segment product area look like this:
For each of these tables, we have a finalized table that contains the finalized numbers for each month, and a rollup append-only table that writes new data for a month as it updates every day. A unique identifier in the rollup table identifies a given run, so you can sum the AWS bill by finding all of the rows in a given run.
Finalized data effectively becomes our golden ‘source of truth’ that we use for top-level metrics and board reporting. Rollup tables are used to monitor our spend over the course of the month.
Note: AWS does not "finalize" your bill until several days after the end of the month, so any sort of logic that marks the billing record as complete when the month flips over is incorrect. You can detect when the bill becomes "final" because the invoice_id field in the billing CSV will be an integer instead of the word "Estimated".
Before closing, we realized that there are a few places where a little bit of preparation and knowledge could have saved us a lot of time. In no particular order, they are:
Scripts that aggregate data or copy it from one place to another are infrequently touched and often under-monitored. As an example, we had a script that copied the Amazon billing CSV from one S3 bucket to another, but it failed on the 27th-28th of each month because the Lambda handler doing the copying ran out of memory as the CSV got large. It took a while to notice this, because the Redshift database had a lot of data and the right-ish numbers for each month. We’ve since added monitoring to the Lambda function to ensure that it runs without errors.
Be sure these scripts are well documented, especially with information about how they are deployed and what configuration they need. Link to the source code in other places where they are referenced - for example, any place you pull data out of an S3 bucket, link to the script that puts the data in the bucket. Also consider putting a README in the S3 bucket root.
Redshift queries can be really slow without optimization. Consult with the Redshift specialist at your company, and think about the queries you need, before creating new tables in Redshift. In our case we were missing the right sortkey on the billing CSV tables. You cannot add sortkeys after you create the table, so if you don't do it up front you have to create a second table with the right keys, send writes to that one and then copy all the data over.
Using the right sortkeys took the query portion of the rollup run from about 7 minutes to 10-30 seconds.
Initially we planned to run the rollup scripts on a schedule - Cloudwatch would trigger an AWS Lambda function a few times a day. However the run length was variable (especially when it involved writing data to Redshift) and exceeded the maximum Lambda timeout, so we moved it to an ECS service instead.
We chose Javascript for the rollup code initially because it runs on Lambda and most of the other scripts at the company were in Javascript. If I had realized I was going to need to switch it to ECS, I would have chosen a language with better support for 64 bit integer addition, and parallelization and cancellation of work.
Any time you start writing new data to Redshift, the data in Redshift changes (say, new columns are added), or you fix integrity errors in the way the data is analyzed, add a note in the README with the date and information about what changed. This will be extremely helpful to your data analysis team.
The blended costs are not useful for this type of analysis - stick to the unblended costs, which show what AWS actually charged you for a given resource.
There are 8 or 9 rows in the billing CSV that don't have an Amazon product name attached. These represent the total invoice amount, but throw off any attempt to sum the unblended costs for a given month. Be sure to exclude these before trying to sum costs.
As you might imagine, getting visibility into your AWS bill takes a large amount of work–both in terms of custom tooling and identifying expensive resources within AWS.
The biggest win we’ve found comes from making it easy to continuously estimate your spend rather than running the occasional ‘one-time-analysis’.
To do that, we’ve automated all of the data collection, enforced tagging within Terraform and our CI, and educated the entire engineering team how to properly tag their infrastructure.
Rather than sitting within a PDF, all of our data is continuously updated within Redshift. If we want to answer new questions or generate new reports, we can instantly get results via a new SQL query.
Additionally we’ve exported that data into an Excel model so we can estimate exactly how much a new customer will cost. And we can also see if a single service or a single product area is suddenly costing a lot more, before that causes too much of a hit to our bottom line.
While it may not exactly mirror your infrastructure, hopefully this case study will be useful for helping you get a better sense of your costs and manage them as you scale!

Our annual look at how attitudes, preferences, and experiences with personalization have evolved over the past year.