Using ClickHouse to count unique users at scale

By implementing semantic sharding and optimizing filtering and grouping with ClickHouse, we transformed query times from minutes to seconds, ensuring efficient handling of high-volume journeys in production while paving the way for future enhancements.

By Rahul Ramakrishna, Lew Gordon, Clayton McClure

With Twilio Engage, customers can define a customer’s journey using our Journeys product. When we launched this product, we provided a way to show how many users were in each step of the journey, but it was difficult to find statistics on how the campaign was doing overall. Additionally, interpreting step-level stats proved difficult.

We wanted to provide Engage customers with a way to see overall stats per journey, as well as provide more accurate step level stats.

Two factors that made this particularly challenging came from trying to calculate exact unique users who interacted with the campaigns over arbitrary date ranges (ex. entered, exited, completed.) The Segment product provides some use cases, and for those we generally use a self managed ClickHouse. 

We have a rough common pattern of writing to the individual shards as separate tables within ClickHouse and using a distributed table to serve queries. Most of the use cases we’d had so far required basic total counts where we could utilize pre-aggregation via materialized views. For this scenario, we could not pre-aggregate due to the requirement of exact unique counts over arbitrary date ranges.

Initially, we launched this feature using some standard setups - we had to ingest the data and query it. 

Our general approach is to randomly distribute incoming events into the multiple shards of the cluster to prevent hotspotting. The goal is to get an even amount of data volume per shard since we are not using an elastic object store for persistence. Instead, use an instance store with NVMe disks for performance. Since we do not have an elastic object store to back any of our queryable data, excessive storage use on one node would lead to failure. 

At query time, we query the distributed table which fans out to the various shards to collect the data and return a result. This has worked very well for other use cases where we cannot pre-aggregate the data.

However, upon launching this, we noticed that the performance results for high-volume journeys were not adequate. Despite the success of this approach in other use cases, the performance was not up to par once we actually implemented it.

For 95% of all journeys, we did not have a problem, but like most products that we have, data volume per customer follows a power law distribution where a handful of customers are generating significantly more data than others. 

What this means for us is that only a handful (< 1%)  of journeys would fail to be queried in the UI. This was either due to memory consumption on the query where we hit the max memory query limit or the query took too long and we hit a service timeout of 60 seconds. We could not just increase the memory limit because the only way to do so here was to vertical scale the cluster which would be cost-prohibitive. We also didn’t want to increase the service timeout which could negatively impact the user experience. While ClickHouse served us well in brute forcing most customers, analyzing journeys with billions of events required a different approach.

How does someone begin to solve this?

Let’s look at logically what our query was trying to do:

clickhouse-journey-events

SELECT event, count(distinct user_id)
FROM journey_events
WHERE journey_id = 'jou_123'
AND timestamp between now() - interval 7 day and now()

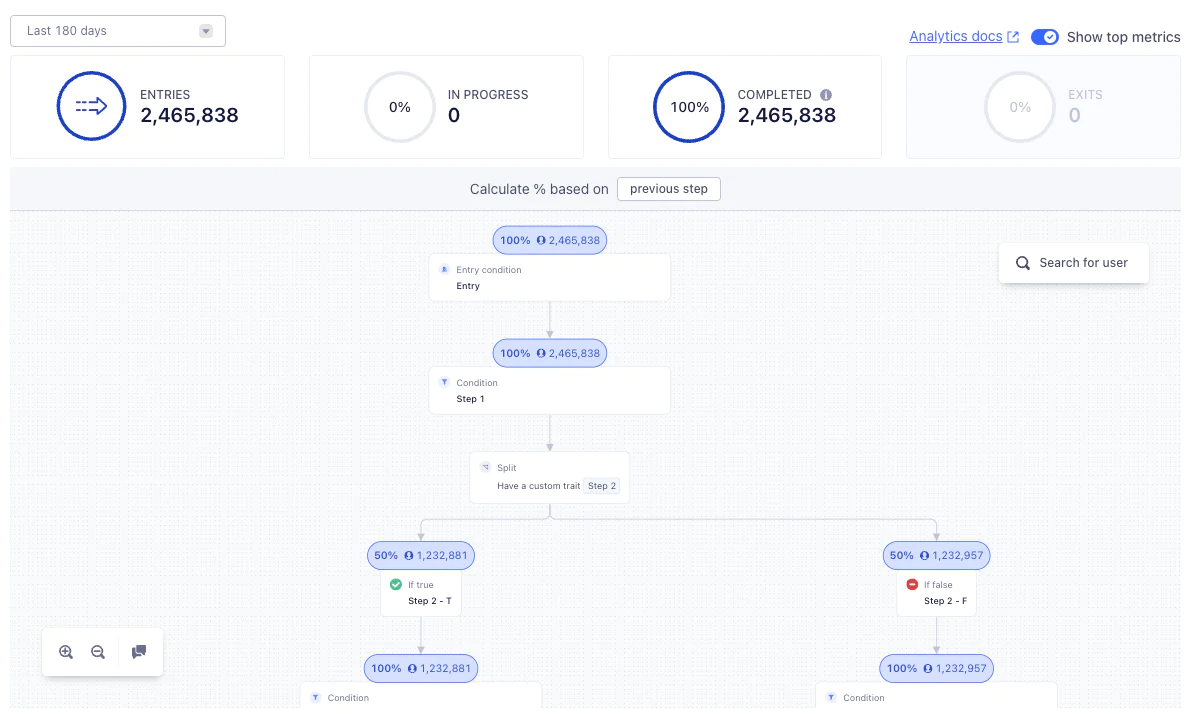
The semantic meaning of this query is to “Find me all unique users for a journey over the last 7 days by event (e.g. entered/completed/exited the journey)”. 

Now how could you solve this without SQL? One way is to create a hash table and throw all the user ids in there. Once you’ve iterated through all the records, the key set is your unique set. Assuming this is what ClickHouse does under the hood might explain the large memory consumption on query since many of these large journeys could have 100 million or more unique users and billions of events. 

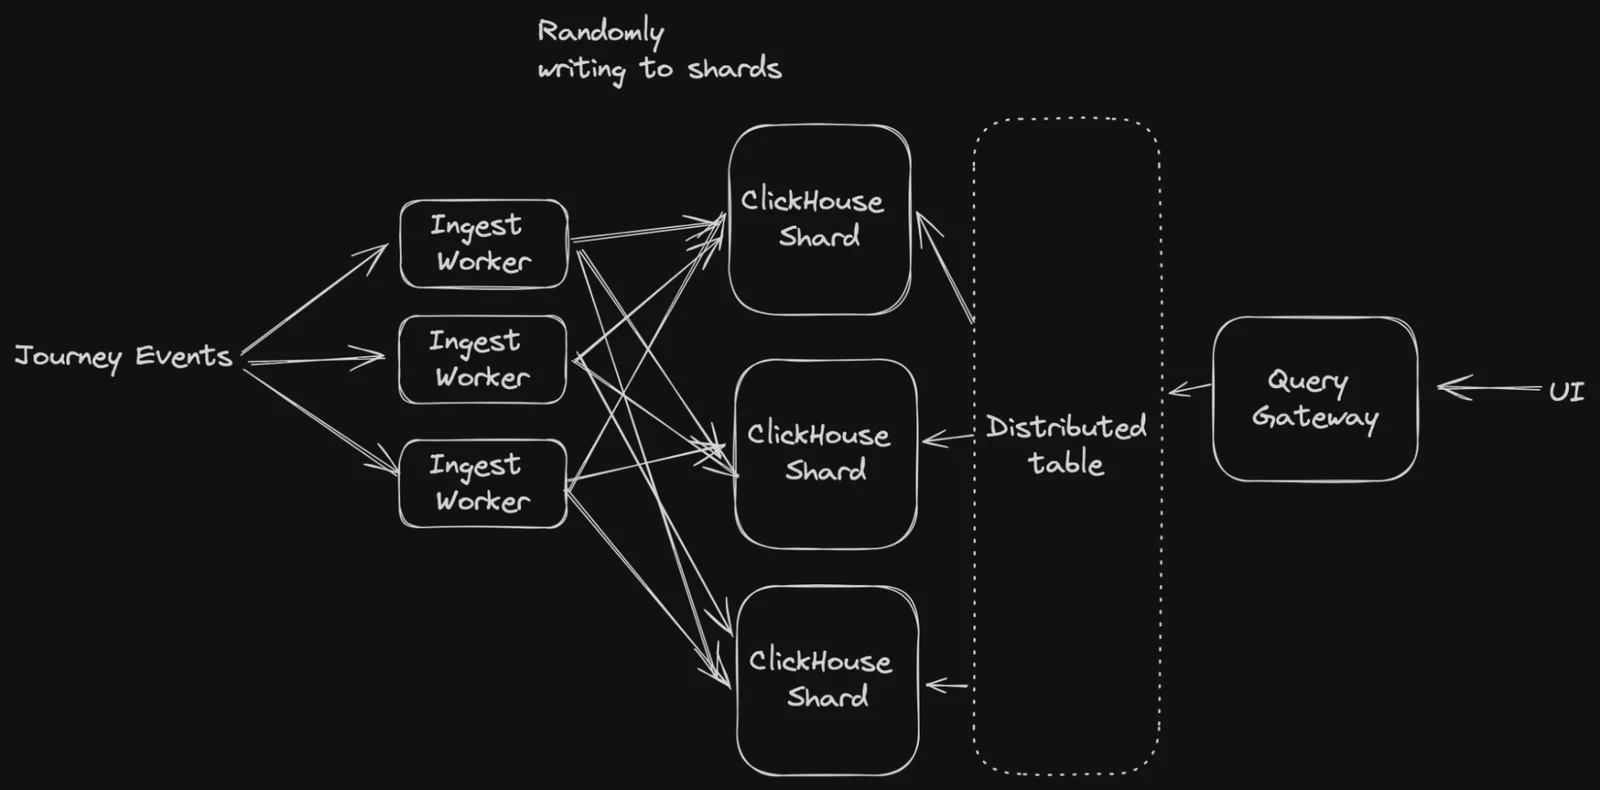
Due to the data being spread across multiple ClickHouse nodes, when you query for unique counts, you have to gather all the rows that are relevant back to the initiator node to perform the uniqueness.

What are potential ways to fix this?

  • Spill to disk?  Even though we are using NVMe instance storage, this was a non-starter because of the perceived drastic performance impact.

  • Use an approximation algorithm (HyperLogLoguniqCombined)  or sample the data? This was not a viable approach based on the product requirements.

What we came up with:

We wanted to keep the requirement of providing exact unique values for our customers so that they’d have an accurate view of their campaigns. Without the skill set to effectively dive into the ClickHouse code and truly understand what was going on, we had to make a hypothesis of what ClickHouse was doing. 

We hypothesized that because we were randomly distributing events across all nodes, the initiating query node would need to pull all Segment IDs to one node. From here, it would build a set to determine the unique keys. One simple way to solve this would be to constantly vertically scale the nodes in the cluster, though this would be cost-prohibitive and give us an effective upper bound of how many events we could process. Could we do something else to maintain a distributed workload and fully use multiple machines?

Semantic sharding:

Instead of randomly placing events on nodes, we could be a bit more clever and ensure that for a given user, they always end up on the same node. 

Why would this matter? Imagine if we could guarantee that a user exists on one node at all times. In this case, we could assume that our unique sets wouldn’t have overlap. This gives the nice property of being able to calculate the unique number of users on each node and simply transfer the resulting unique counts from each node to the initiator node and sum those numbers up. This would drastically reduce the memory footprint of calculating uniques per node and the final aggregation would be trivial.

The question now is, how can we actually do this in ClickHouse? Luckily there is a distributed_group_by_no_merge setting that allowed us to do this with a slight tweak of the query. That is, instead of getting one aggregated count we also needed to do a final sum on the query to get the true result.

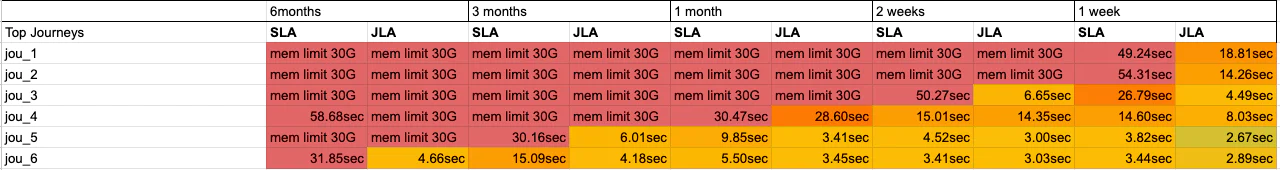
Implementing this made 100% of our queries usable against any journey at any time range. Previously sluggish 50-second queries now fly at sub-second speeds, unlocking the ability to instantly analyze any journey data near real-time.

Hashing of Filter and Group By Keys:

Another major factor of performance turned out to be how we were filtering and grouping by our UUID keys.  All of our UUIDs were 32 character UUID strings.  Under the hood, string comparison is of course O(n), so when doing a group by or a filter with a string with billions or trillions of rows, each of those comparisons was O(n) and while the strings would usually start differing rapidly, sometimes the similarities would last several characters into the string.  So what was the solution? We started using CityHash64 to turn the strings into integers. Integer comparison is O(1). This reduced the query time by 80%.

What about collisions?  With a 64 bit hash, there were 9,223,372,036,854,775,807 possible values.  So even with a billion unique values, the odds of collisions were roughly 9 billion to 1.  For our use case, we tested with our hashed unique values vs our UUID string values and had the exact same number of unique values, verifying we had no collisions.

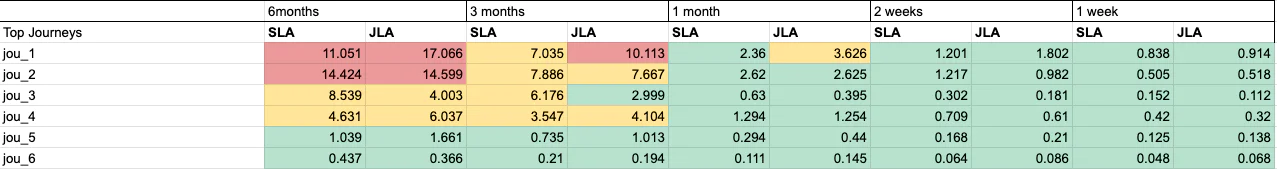
Post Optimization Results:

Today in Production, we continued to see large journeys generate a lot of events. However, with the optimizations we took here, we are able to handle queries for even the largest of journeys. As we see further product adoption and the age of journeys increase, we expect that we’ll need to continue to make improvements to our performance. However, taking these initial steps we’re hoping gets us a long runway.

Test drive Segment CDP today

It’s free to connect your data sources and destinations to the Segment CDP. Use one API to collect analytics data across any platform.

Recommended articles

Loading

Want to keep updated on Segment launches, events, and updates?