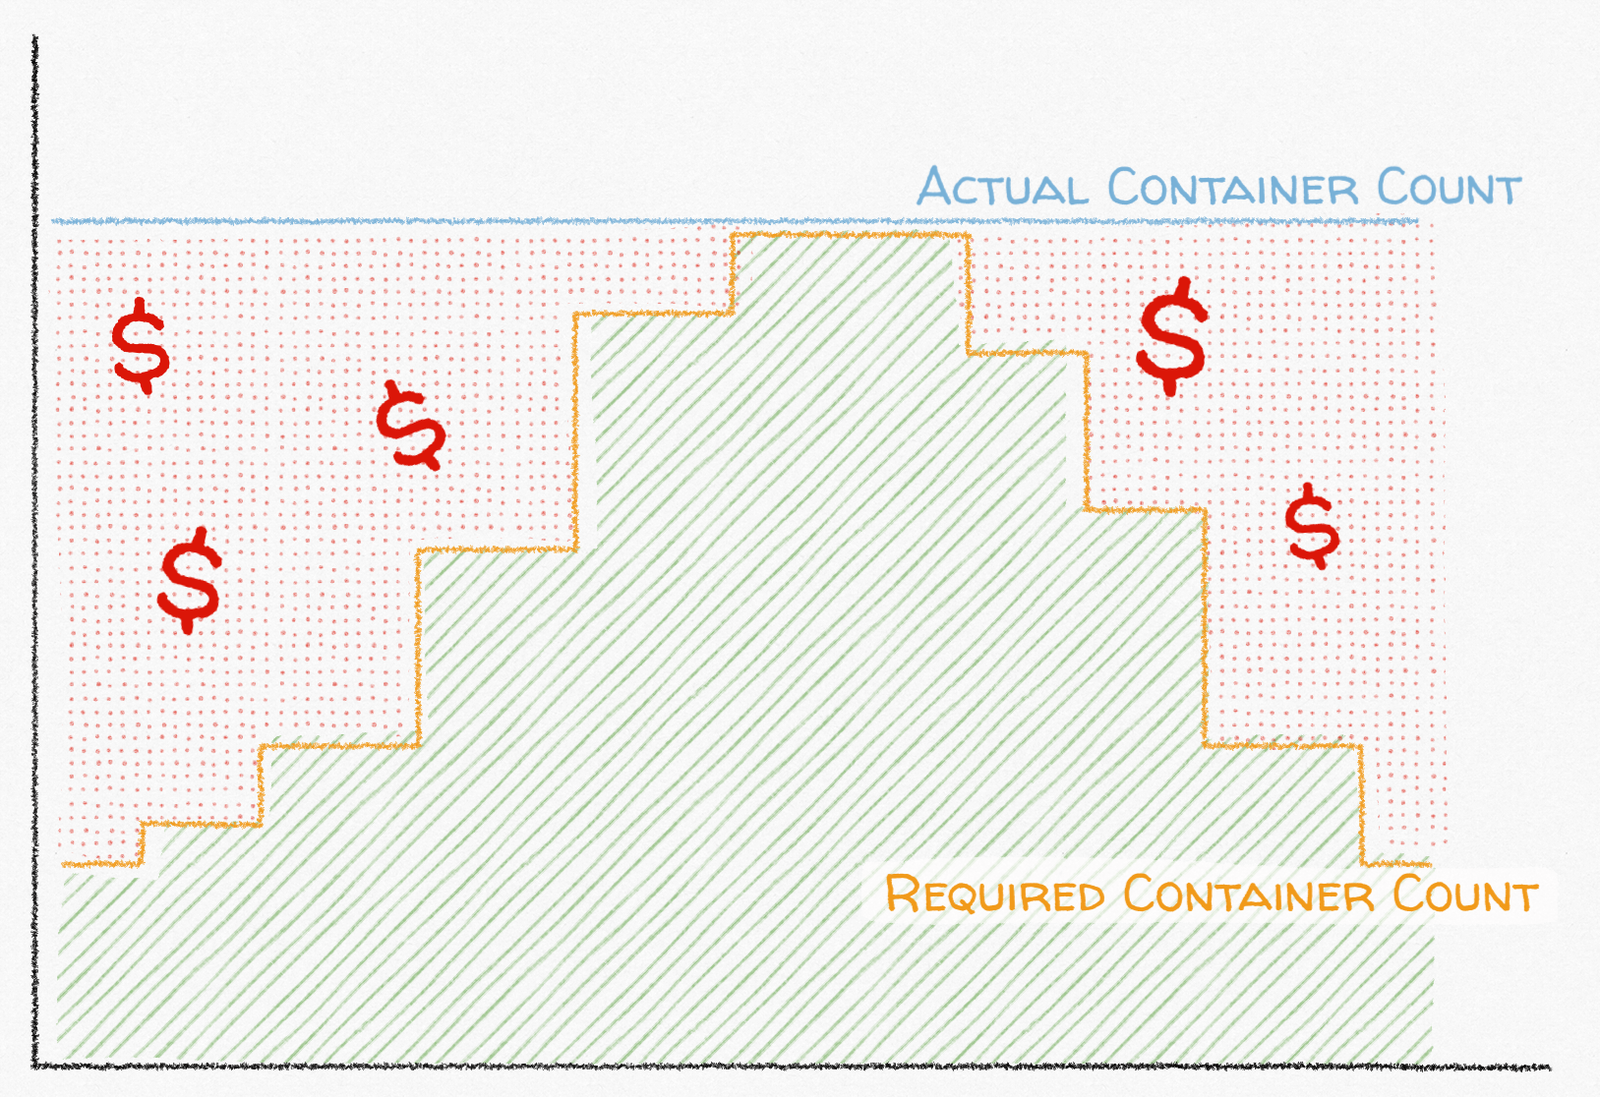
The premise behind autoscaling in AWS is simple: you can maximize your ability to handle load spikes and minimize costs if you automatically scale your application out based on metrics like CPU or memory utilization. If you need 100 Docker containers to support your load during the day but only 10 when load is lower at night, running 100 containers at all times means that you’re using 900% more capacity than you need every night. With a constant container count, you’re either spending more money than you need to most of the time or your service will likely fall over during a load spike.

At Segment, we reliably deliver hundreds of thousands of events per second to cloud-based destinations but we also routinely handle traffic spikes of up to 300% with no warning and while keeping our infrastructure costs reasonable. There are many possible causes for traffic spikes. A new Segment customer may instrument their high-volume website or app with Segment and turn it on at 3 AM. A partner API may have a partial outage causing the time to process each event to skyrocket. Alternatively, a customer may experience an extreme traffic spike themselves, thereby passing on that traffic to Segment. Regardless of the cause, the results are similar: a fast increase in message volume higher than what the current running process count can handle.
Sidebar: you can use Segment to track events once and send to all the tools in your stack. Sign up for a free workspace here or a get a demo here 👉
To handle this variation in load, we use target-tracking AWS Application Autoscaling to automatically scale out (and in) the number of Docker containers and EC2 servers running in an Elastic Container Service (ECS) cluster. Application Autoscaling is not a magic wand, however. In our experience, people new to target tracking autoscaling on AWS encounter three common surprises leading to slow scaling and giant AWS billing statements.
Surprise 1: Scaling Speed Is Limited
Target tracking autoscaling scales out your service in proportion to the amount that a metric is exceeding a target value. For example, if your CPU target utilization is 80%, but your actual utilization is 90%, AWS scales out by just the right number of tasks to bring the CPU utilization from 90% to your target of 80% using the following formula:
Continuing the above example, AWS would scale out a task count of 40 to 45 to bring the CPU utilization from 90% to 80% because the ratio of actual metric value to target metric value is 113%:
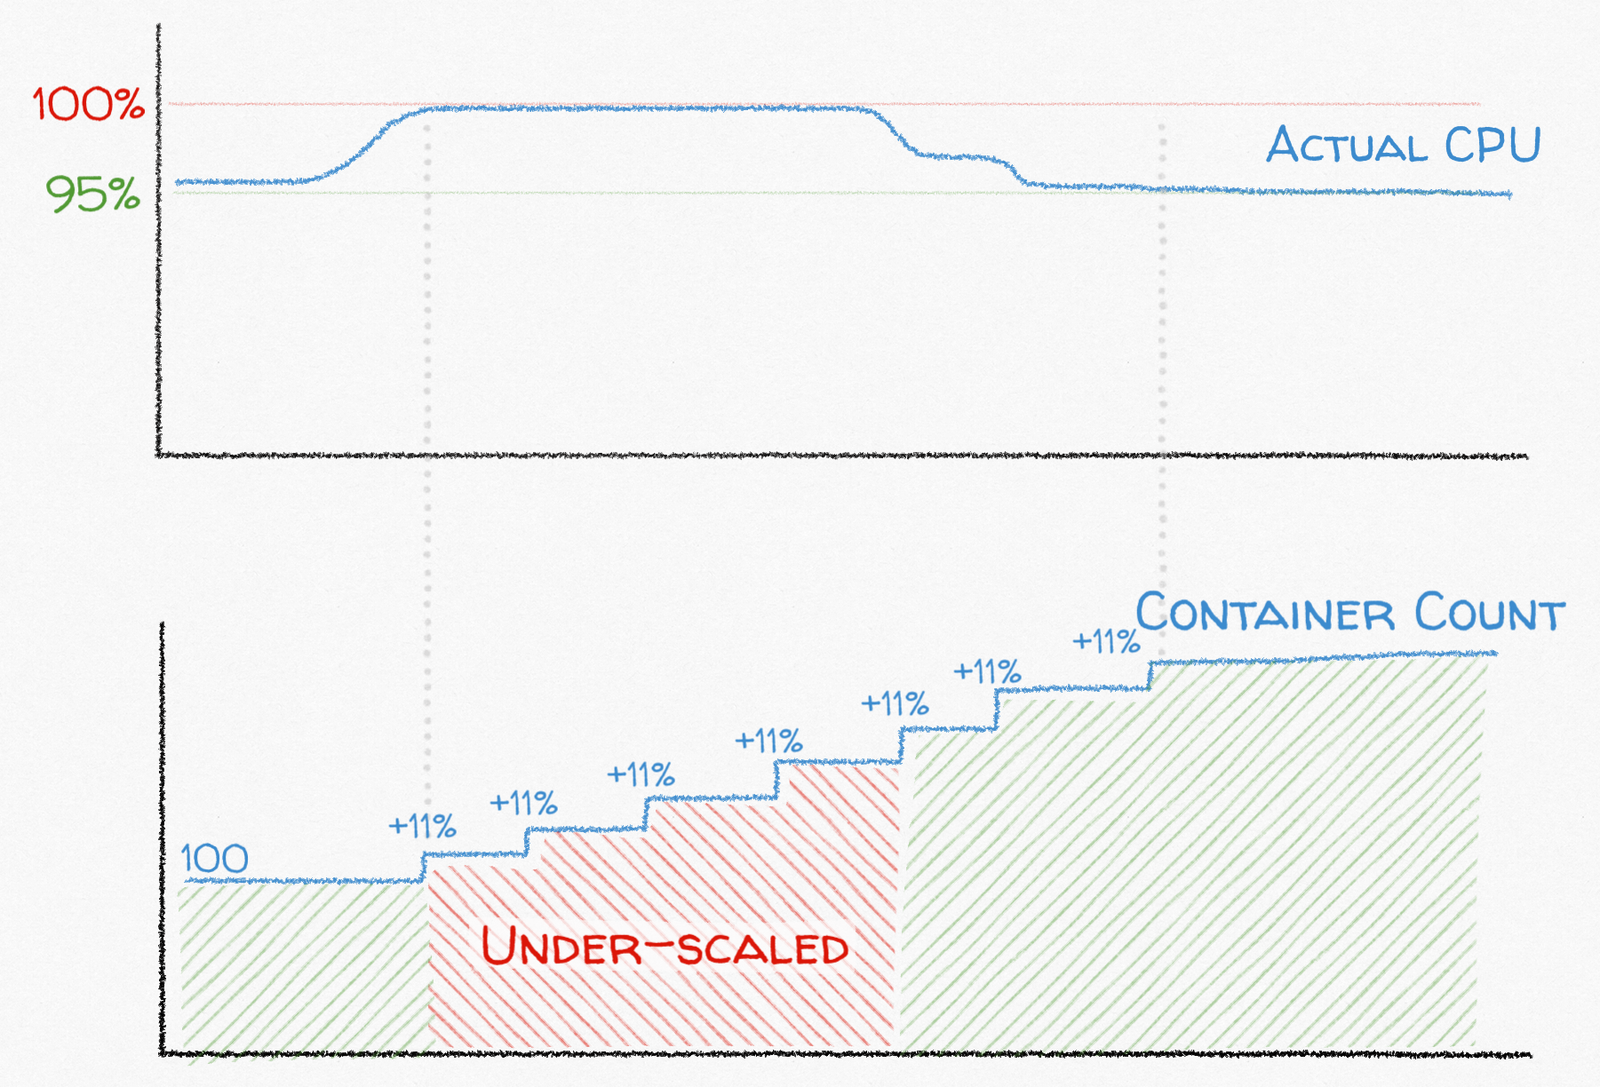
However, because target tracking scaling adjusts the service task count in proportion to the percentage that the actual metric value is above the target, a low ratio of maximum possible metric value to target metric value significantly limits the maximum “magnitude” of a scale out event. For example, the maximum value for CPU utilization that you can have regardless of load is 100%. Unlike a basketball player, EC2 servers can not give it 110%. So, if you’re targeting 95% CPU utilization in a web service, the maximum amount that the service scales out after each cooldown period is 11%: 100 / 90 = 1.1
In the above example, the problem is that if your traffic went up by 200%, you’d probably need to wait for seven separate scaling events to reach just under double the task count to handle the load:
If your scale out cooldown is one minute, seven scaling events will take seven minutes during which time your service is under-scaled.

If you need to be able to scale up faster, you have a few options:
-
Reduce your target value to allow for a larger scale out ratio, at the risk of being over-scaled all the time ($$$).
-
Add target tracking on a custom CloudWatch metric with no logical maximum value like inflight request count (for web services) or queue depth (for queue workers).
-
Use a short scale out cooldown period to allow for more frequent scale out events. But, short cooldowns introduce their own unpleasant side effects. Read on for more on that surprise!
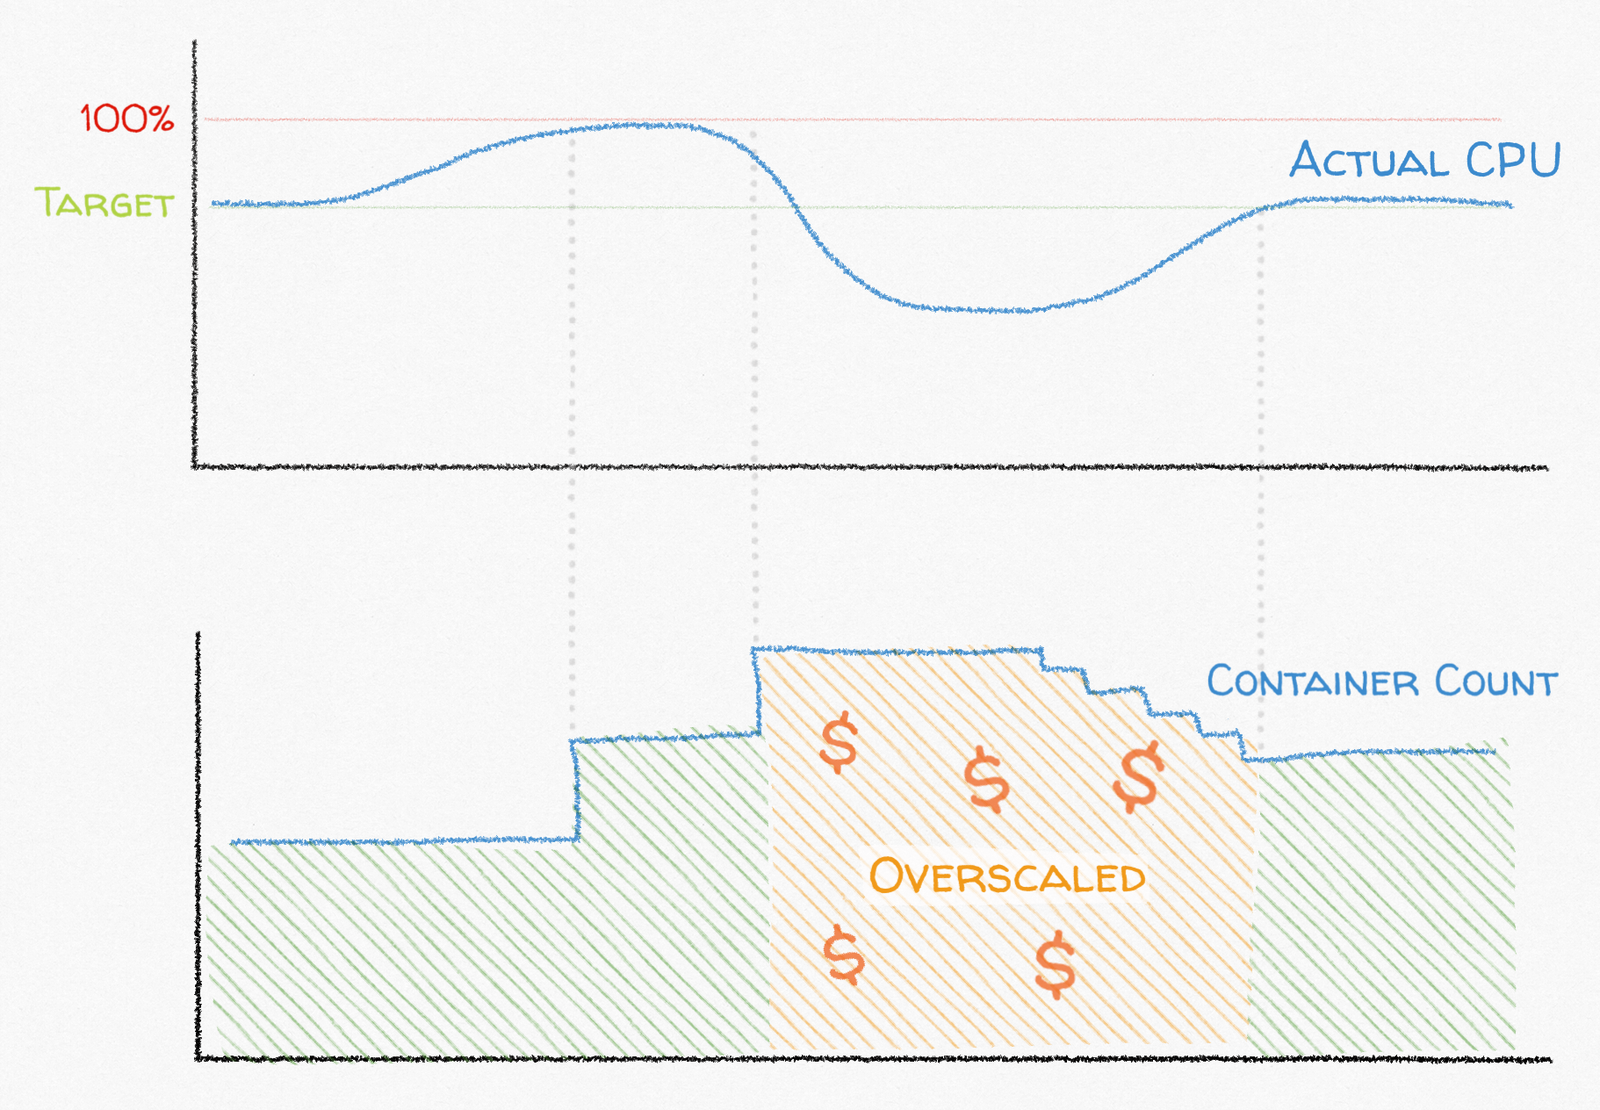
Surprise 2: Short Cooldowns Can Cause Over-Scaling / Under-Scaling
AWS Application Autoscaling uses two CloudWatch alarms for each target tracking metric:
-
A “high” alarm that fires when the metric value has been above the target value for the past 3 minutes. When the high alarm fires, ECS scales your service out in proportion to the amount that the actual value is above the target value. If more than one of the high alarms for your service fire, ECS takes the highest calculated task count and scales out to that value.
-
A “low” alarm that fires when the metric value has been more than 10% below the target value for the past 15 minutes. Only when all of your low alarms for a service fire does ECS slowly scale your service task count in by an undefined and undocumented amount.
In addition to the target metric value, AWS Application Autoscaling allows you to configure a “cooldown” period that defines the minimum amount of time that must pass between subsequent scaling events in the same direction. For example, if the scale out cooldown is five minutes, the service scales out, at most, every five minutes. However, a scale out event can immediately follow a scale in event to ensure that your service can quickly respond to load spikes even if it recently scaled in.
The catch is that these values cannot be arbitrarily short without causing over-scaling and under-scaling. Cooldown durations should instead be at least the amount of time it takes the target metric to reach its new “normal” after a scaling event. If it takes three minutes for your CPU utilization to drop by about 50% after scaling up 2x, a cooldown less than three minutes causes AWS to scale out again before the previous scale out has had time to take effect on your metrics, causing it to scale out more than necessary.

Additionally, CloudWatch usually stores your target metric in one- or five-minute intervals. The cooldown associated with those metrics cannot be shorter than that interval. Otherwise, after a scaling event, CloudWatch re-evaluates the alarms before the metrics have been updated, causing another, potentially incorrect, scaling event.
Surprise 3: Custom CloudWatch Metric Support is Undocumented
Update: AWS has significantly improved documentation around custom CloudWatch metric support! See:
-
API Reference: CustomizedMetricSpecification
-
API Reference: PutScalingPolicy
Target tracking scaling on ECS comes “batteries included” with CPU and memory utilization targets, and they can be configured directly via the ECS dashboard. For other metrics, target tracking autoscaling also supports tracking against your custom CloudWatch metrics, but that information is almost entirely undocumented. The only reference I was able to find was a brief mention of a CustomizedMetricSpecification in the API documentation.
Additionally, the ECS dashboard does not yet support displaying target tracking policies with custom CloudWatch metrics. You can’t create or edit target tracking autoscaling policies; you can only create them manually using the PutScalingPolicy API. Moreover, once you create them, they’ll cause your Auto Scaling tab to fail to load:

Thankfully, Terraform makes creating and updating target tracking autoscaling policies relatively easy, though it too is rather light on documentation. Here’s an example target tracking autoscaling policy using a CloudWatch metric with multiple dimensions (“Environment” and “Service”) for a service named “myservice”:
The above autoscaling policy tries to keep the number of inflight requests at 100 for our “myservice” ECS service in production. It scales out at most every 1 minute and scales in at most every 5 minutes.
Even More Surprises
Target tracking scaling can be tremendously useful in many situations by allowing you to quickly scale out ECS services by large magnitudes to handle unpredictable load patterns. However, like all AWS conveniences, target tracking autoscaling also brings with it a hidden layer of additional complexity that you should consider carefully before choosing it over the simple step scaling strategy, which scales in and out by a fixed number of tasks.
We’ve found that target tracking autoscaling works best in situations where your ECS service and CloudWatch metrics meet the following criteria:
-
Your service should have at least one metric that is directly affected by the running task count. For example, a web service likely uses twice the amount of CPU time when handling twice the volume of requests, so CPU utilization is a good target metric for target tracking scaling.
-
The metrics that you target should be bounded, or your service should have a maximum task count that is high enough to allow for headroom in scaling out but is low enough to prevent you from spending all your money. Target tracking autoscaling scales out proportionally so if the actual metric value exceeds the target by orders of magnitude, AWS scales your application (and your bill) out by corresponding orders of magnitude. In other words, if you are target tracking scaling on queue depth and your target depth is 100 but your actual queue depth is 100,000, AWS scales out to 1,000x more tasks for your service. You can protect yourself against this by setting a maximum task count for your queue worker service.
-
Your target metrics should be relatively stable and predictable given a stable amount of load. If your target metric oscillates wildly given a stable traffic volume or load, your service may not be a good fit for target tracking scaling because AWS is not able to correctly scale your task count to nudge the target metrics in the right direction.
One of the services that we use target tracking autoscaling for at Segment is the service that handles sending 200,000 outbound requests per second to the hundreds of external destination APIs that we support. Each API has unpredictable characteristics like latency (during which time the service is idle waiting for network I/O) or error rates. This unpredictability makes scaling on CPU utilization a poor scaling target, so we also scale on the count of open requests or “inflight count.” Each worker has a target inflight count of 50, a configured maximum of 200, a scale out cooldown of 30 seconds, and a scale in cooldown of 45 seconds. For this particular service, that config is a sweet spot that allows us to scale out quickly (but not so quick as to burn money needlessly) while also scaling in less aggressively.
In the end, the best way to find the right autoscaling strategy is to test it in your specific environment and against your specific load patterns. We hope that by knowing the above surprises ahead of time you can avoid a few more 3AM pager alerts and a few more shocking AWS bills.
See what Segment is all about
Since you've made it this far, perhaps you want to check out Segment? Sign up for a free workspace here or a get a demo here 👉

The State of Personalization 2023
Our annual look at how attitudes, preferences, and experiences with personalization have evolved over the past year.