A/B test your tech stack
Learn how to design, run, and analyze an A/B test to determine what marketing tools are generating the most ROI.
Learn how to design, run, and analyze an A/B test to determine what marketing tools are generating the most ROI.
Twilio Segment Personas is now part of Segment’s Twilio Engage product offering.
Over the past few years, growing evidence suggests that a hands-on sales process will outperform a no-touch, self-serve sales process.
This has been helped in no small part by companies like Intercom, who make chatting with your customers live on your website easier than ever before. More conversations mean more engagement, which translates to more revenue.
In fact, according to Intercom’s reporting, website visitors are “82% more likely to convert to customers if they’ve chatted with you first.”
So, it’s reasonable to conclude that adding a live chat widget to your website can only help conversion, right?
Wrong.
In reality, while live chat can help increase conversions, not every company should add it to their website.
There are two critical questions to ask to determine if live chat is a fit for you:
Can you maintain a fast response time?
Reports have shown that the average live chat response time is between 1 and 3 minutes. These are the kind of response rates that users expect and are responsible for producing the 82% boost in conversion seen by Intercom's users.
But there’s a catch.
While fast times can work for you, slow response times can work against you. A Forrester report shows that “1 in 5 customers are willing to stop using a product or service for slow response times via online chat.”
Will your unit economics still work?
Maintaining a sub-3-minute response time comes with a cost. You could need at least one full-time rep to operate it. This might be fine if you sell a high-LTV product/service. But if your business falls in the high-volume/low-LTV category – meaning you’ll need to hire multiple full-time reps – your margins might not make this financially sound.
To find out if live chat is right for your business, we suggest you run an A/B test using Segment, Optimizely, and the live chat tool of your choice (we’ll use Intercom in this recipe).
That way, we can let the data dictate what marketing tools we adopt and whether something is truly generating a positive return on investment.
Let’s jump in.
The first step is to define your hypothesis. In this case, ours is something like: If we add live chat to our website, our free trial conversion rate will be higher than a version of our site without chat.
The second step is outlining key information about our experiment:
Where on your web site will the chat widget be? Do you want to show it on all pages, just the homepage, or a specific landing page?
Who is eligible to be in your experiment? In addition to identifying which page(s) the test will run on, we also need to specify audience targeting. Do we only want to show the chat widget to first-time visitors? Or only to returning visitors?
Tip: You can use Segment Personas to quickly identify specific audiences such as these.
What is the primary metric you’ll use to measure whether this was a success? If you’re an e-commerce company, a “conversion” might be when something is purchased from your online store. If you’re a B2B SaaS company, a conversion might be defined as someone signing up for a free trial.
Is our experiment designed to reflect reality? Pay attention to blind spots that could impact your test, such as the quality of the live chat provided. If your CEO is handling live chat during your A/B test, their response rates will be of a higher quality than a junior support rep hired last week.
Remember, never jump into an A/B test without understanding questions such as those above, and what success/failure looks like. Otherwise, our experiment is not very scientific.
Before you begin an A/B test, you need to calculate the necessary sample size. By doing so, we’re able to determine exactly how much traffic each variation needs to receive, how long we need to run the experiment, and whether it even makes any sense to run this experiment.
For example, you may find out that it will take half a year to get enough data to run this experiment, in which case you should focus attention elsewhere.
Fortunately, calculating your sample size is easy. Any online calculator will suffice, but we’ll use Optimizely’s calculator in this recipe.
You provide it with three inputs:
What baseline rate are you already converting at?
For example, if you plan to test live chat on your homepage and your current homepage conversion rate is 5%, your baseline is 5%.
Minimum detectable effect
Another way of wording this is, “What’s the minimum conversion rate change you’d deem a success?” For example, if you need at least a 10% lift in conversion rate to justify implementing live chat, 10% is your minimum detectable effect.
This step is often overlooked, but it is incredibly important. Sample size requirements differ drastically between a test designed to detect a minimum effect of, say, 20% versus 5%. Try it out for yourself in the Optimizely tool.
For an A/B test with a baseline conversion of 5%, the statistical significance of 95%, and the minimum detectable effect of 20%, the sample size needed is 6,900. But change the minimum detectable effect to 5%, and the sample size jumps up to a whopping 140,000. In other words, it would take 20x longer to detect a 5% change than a 20% change.
For startups with low traffic volume, it could take months — even years — to gather enough data. If you don’t have a ton of traffic, you need to be realistic about whether it makes sense to spend the energy on an A/B test.
Statistical significance
We recommend sticking with the industry standard of 95%.
At this point, you have everything you need to design an effective A/B test. Time to get it set up.
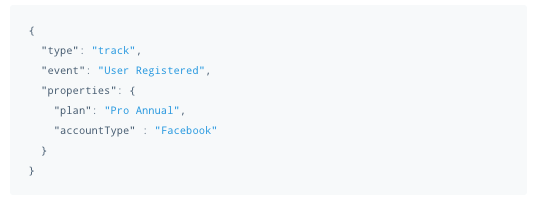
Firstly, set up event tracking with Segment to capture visitor behavior. You can do this via a .track() call, which captures the event, and subsequent properties about that event, that you want to track.
Here’s what the .track() call for a new user signup looks like.

Next, you’ll want to sync that data over to Optimizely. This is incredibly easy with Segment and can be done in under 5 minutes. From your Segment Destinations page click, Add Destination, search for “Optimizely” in the Destinations Catalog, and confirm the Source you’d like to connect.
Finally, you’ll also want to sync user data and events to Intercom via Segment. Once again, from your Segment Destinations page click “Add Destination”, search for “Intercom”, and select it in the results that appear.
Once you’ve set up your tools and confirmed data is flowing, it’s time to build your A/B test.
Most likely, you’ll want to use an Optimizely redirect test. In a nutshell, this means you’ll have two different versions of your page: one with live chat and one without. Users will be split into those two cohorts.
To do this, your engineers should build a duplicate version of the page(s) you want to run your experiment on. Then, you’ll use Optimizely to split, or “redirect,” a portion of your traffic between your control page and the new version containing the chat widget. Your final implementation step uses Optimizely’s settings to select the metric you’re using to measure the experiment’s success, e.g. signups or purchases.
Once your test settings are in place, you’re ready to go live! Optimizely takes care of all the math and will notify you when your test has a statistically significant result — or if it's inconclusive.
If you followed the best practices and kept your test running until your sample size was met, and you’re showing a statistically significant result, you can be confident your test results are valid.
If your test produced a statistically significant increase in conversion and your live chat response times and quality were representative of what you can maintain indefinitely – congratulations! Go ahead and pause your test, implement live chat by default, and enjoy your new conversion wins!
In the screenshot below, you can see the outcome of an experiment run using Optimizely.

Source: https://help.optimizely.com/@api/deki/files/7813/results-clear-winner.png?revision=1
Variation 1 outperformed the original by 26% on the add-to-cart metric. And it led a 2% gain in actual purchases.
To dive deeper into analyzing your results, including assessing their statistical significance, check out Optimizely’s documentation.
Targeted surveys
The value of surveys is twofold: you can better serve your customers, and your customers get clarity on what they really need. You can A/B test surveys for new visitors to determine which people fill out at the highest rate, and which get them to convert later.
Lead scoring
Not every prospect is worth your limited sales bandwidth. You can A/B test your lead scoring to filter the visitors on your website who best match your ideal customer persona. To do this, you can use tools like Clearbit and MadKudu.
And you can go a step further by pairing them with Intercom to proactively ping visitors with a chat request if they’re identified as a high-value prospect.
Get help implementing this use case by talking with a Segment Team member or by signing up for a free Segment workspace here.

Our annual look at how attitudes, preferences, and experiences with personalization have evolved over the past year.