Analyzing Segment’s commute time
At Segment we pride ourselves on being data-driven. Wherever we can use data to solve or surface problems, we do. Among other things, we use surveys to measure our engagement, motivation, happiness and ability to focus.
Last year, one of our surveys showed that we were having a tough time focusing in the office, mostly due to noise. So we launched a full-scale investigation using an acoustic measurement app called Decibel. By measuring both the levels and location of noise, we were able to pin-point the loudest areas of our office—later leading to a restructuring of our office layout and some recognition from Wall Street Journal for our quirky dedication to the scientific method.
More recently, our burgeoning team needed to make the jump to a new, larger office in downtown San Francisco. As we began digging into this project, one area of concern was the effect this move would have on the team’s commute since studies show that there is a direct connection between commute time and health: shorter commutes reduce stress, create a stronger sense of connection with family and friends, and increase your ability to focus.
We feel very strongly about improving on all these dimensions for our team, so when it came time to begin our new office search, our data-driven approach to problem solving kicked into high gear once again.
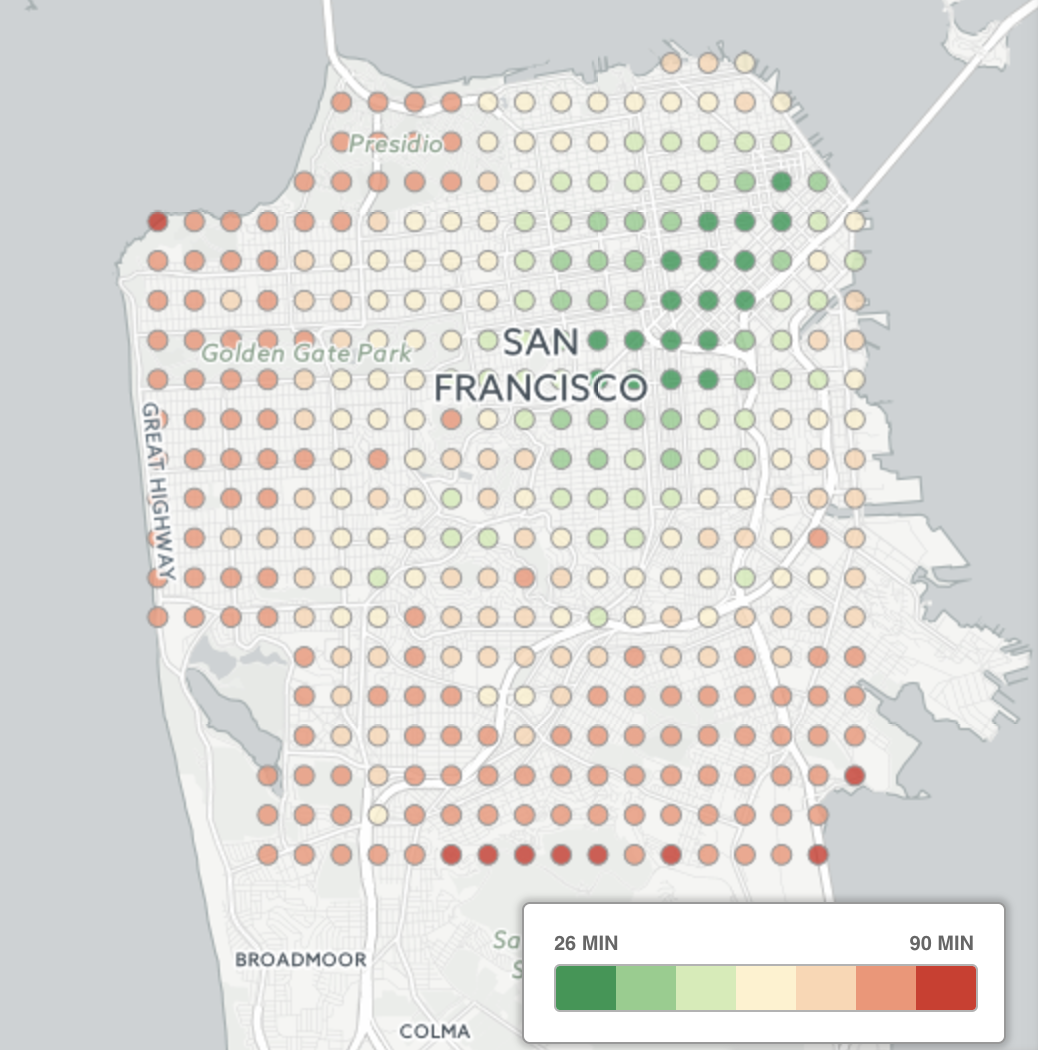
First, we needed to determine what area of the city to focus our office search efforts. By doing a quick scan of our teammates addresses, we found that the majority lived within the city, with a small percentage in adjacent counties. So we knew we wanted to stay within San Francisco. But a quick scan didn’t exactly help us pin-point what neighborhood of SF; so we took it a step further.
By doing a quick export of all our team’s home addresses we used the Google Maps API to determine the areas with minimal average commute time. The shortest average commute times are shown in dark green here:

With this handy map, our office search team hit the ground running, zero-ing in on available offices in the dark green zone. Going further, we knew that this was our “target area”, but it didn’t tell us exactly how this change would impact our team’s distribution of commutes. So, after we narrowed the search to a couple final possibilities, we did a detailed analysis.
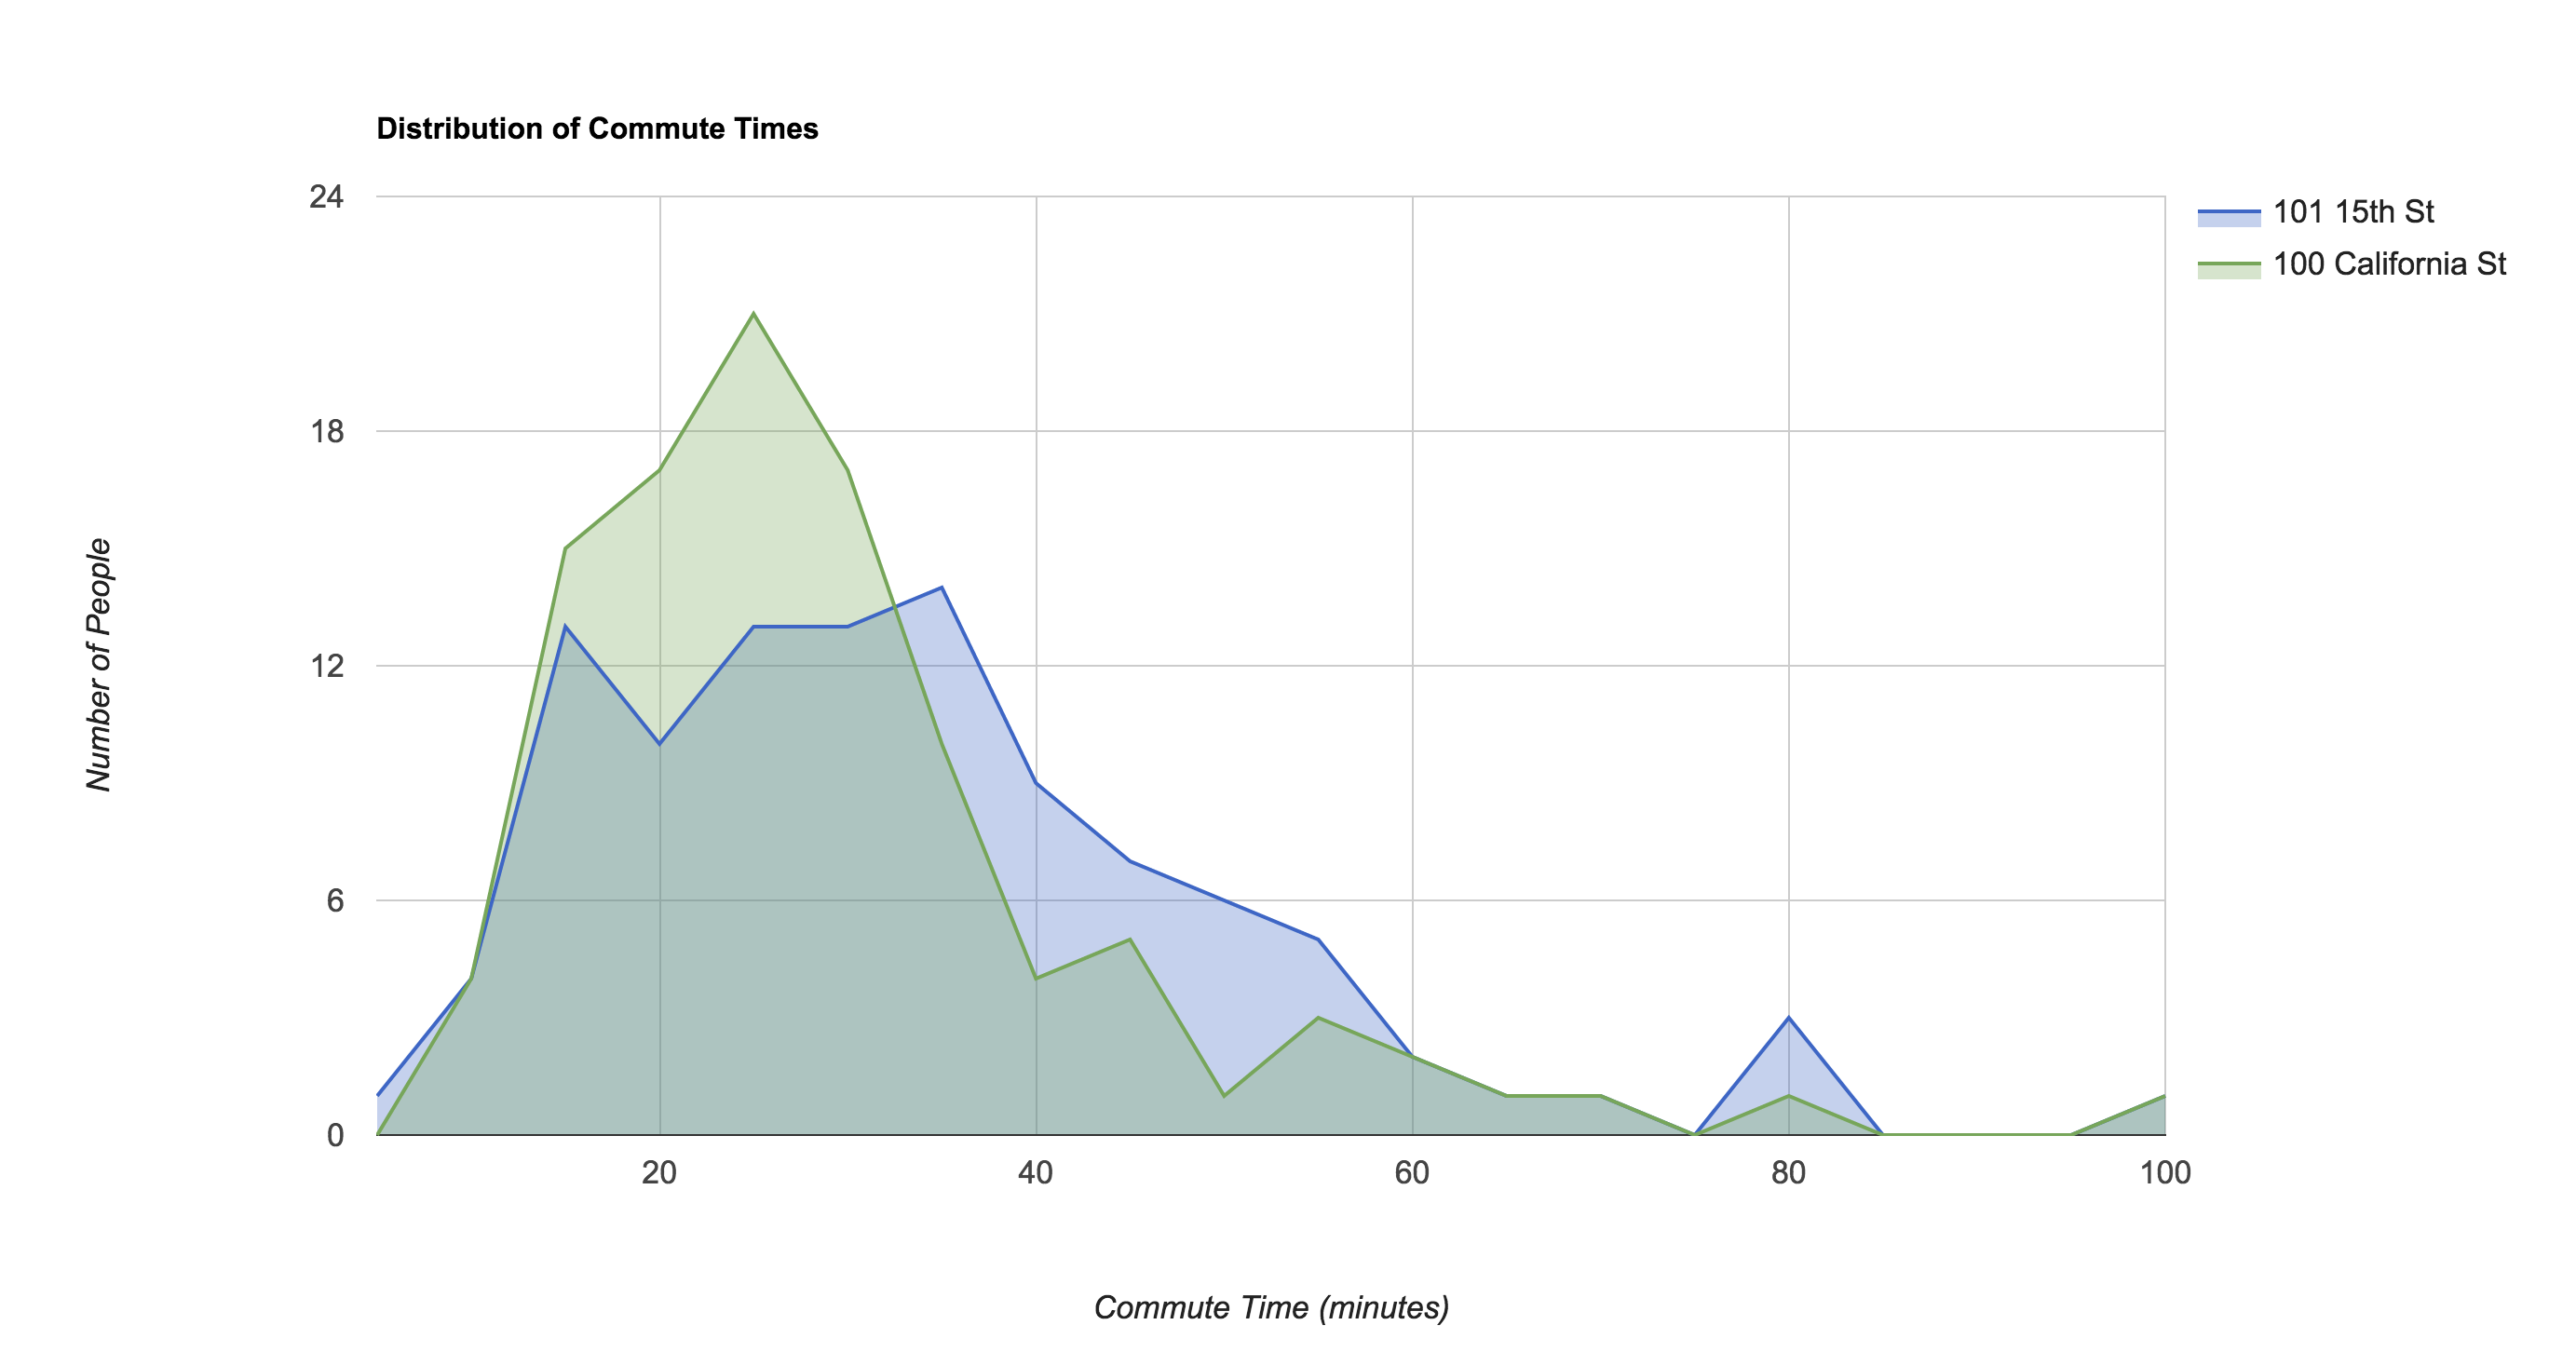
We ran everyone’s addresses through the Google Maps API once more to generate the distribution of commute times, comparing new and old offices:

Based on our analysis, we determined that the move from 101 15th St to 100 California St would decrease the median commute time from 29 minutes to 24 minutes, with an average drop from 32 minutes to 27 minutes and that overall the new office would save the existing team, in aggregate, about 16 hours per day (at 140 people, more as we double this coming year!)
As a final measure, before announcing the new office location to the company, we asked all the team leads to sit down with teammates whose commutes were negatively affected, walk them through the new office decision and address any concerns. And while it was hard to say goodbye to our much beloved home in Potrero Hill, the proximity to the Caltrain, Bart, Ferry Building, and even the iconic SF Cable cars that our new home provides assured everyone that long term, it was the best move for our company.
If you’re looking to move your team soon, we’ve open-sourced the analysis code so you can run it for your team and city too. You can find the code here.

Our annual look at how attitudes, preferences, and experiences with personalization have evolved over the past year.