As a growth hacker, MarTech founder and implementation consultant, I often get the following questions:
-
Which user events are worth tracking?
-
Which metrics should I use for decision making?
-
How should I build and use my stack to scale?
The answer is different for every business. But for B2C subscription-based business, they need a responsive stack that draws high volumes of prospects and reliably pulls them through their conversion funnels with as little drop-off as possible.
That's why we’re collaborating with Segment’s Startup Program to give you this take on the tools, metrics, and user events crucial for success.
The Added Value of a Solid B2C Subscription Stack
Getting B2C marketing right means aligning your team members with their responsibility for the purchase cycle, helping them identify and fast-track high-value leads, and ensuring smooth transitions between funnel stages and business functions.
I have a hard time imagining a B2C subscription company thriving without the responsive infrastructure, digestible user feedback, event-based data, and added functionality a well-implemented stack brings.
Top B2C Events Your Stack Should Track
Your stack’s toolset is only as good as its implementation. Also, a good stack gives you new tools and expanded capabilities to improve the customer experience. That’s how you use a stack to improve revenue. Let’s walk through a few examples of the user events that help you get there.
-
Lead Created: Unknown users trigger the Lead Created event by submitting their contact information (and usually other traits).
-
User Created: After leads or visitors create their first login, the User Created event occurs. This means the user has started using your application properly, and is closer to spending money in case that hasn’t happened yet.
-
[Feature Used]: This custom, product-based event can help you determine the relationship between key feature usage and long-term customer value, in addition to retention. Find ways to encourage repeat usage to optimize. Examples include Song Played, Lesson Completed, or Note Created.
-
Order Completed: Users have completed the customer journey by the time they reach Order Completed. This event is often used to track retention, revenue, and conversion rates from free to paid users.
Top B2C Metrics: How a Stack Helps Measure What Matters
Marketers in B2C subscription businesses need a broad view of the customer purchase cycle, with the ability to get granular and tinker with each conversion step. Use metrics to evaluate audiences and identify the best channels for high-volume conversion.
Visitor-to-Signup Conversion Rate
This metric combines page views with the User Created event and helps users compare marketing channels to identify key audiences. Find a way to move this one a little, and you can see substantial gains in revenue.
Trial Subscription Conversion Rate
Understand how frequently your visitors become users after sampling your services. By cross-referencing page views and the User Created event, you open up further examination of marketing channels and their varying ability to convert visitors.
New and Total Monthly Recurring Revenue (MRR)
Once users trigger Order Completed, they'll find themselves in this camp, where new and total revenue are tracked. Identify best-contributing channels and product features. Switch between MRR and ARR as you need.
Monthly Churn
Retention is no different from revenue in the subscription model. With the help of a product analytics platform such as Amplitude and the Order Completed event, users can slice monthly revenue by overall retention, engagement, and feature usage to shed light on the levers that make your customer experience stickier. For early-stage startups, the retention may be even more important than revenue.
Use Cases of Integrations for B2C Growth
When you integrate numerous MarTech tools, you not only pool resources, you expand each tool’s functional capacity. Making good use of the ecosystem can help you scale B2C revenue. Below are examples for your inspiration.
Fuel and Automate Personalized Messaging
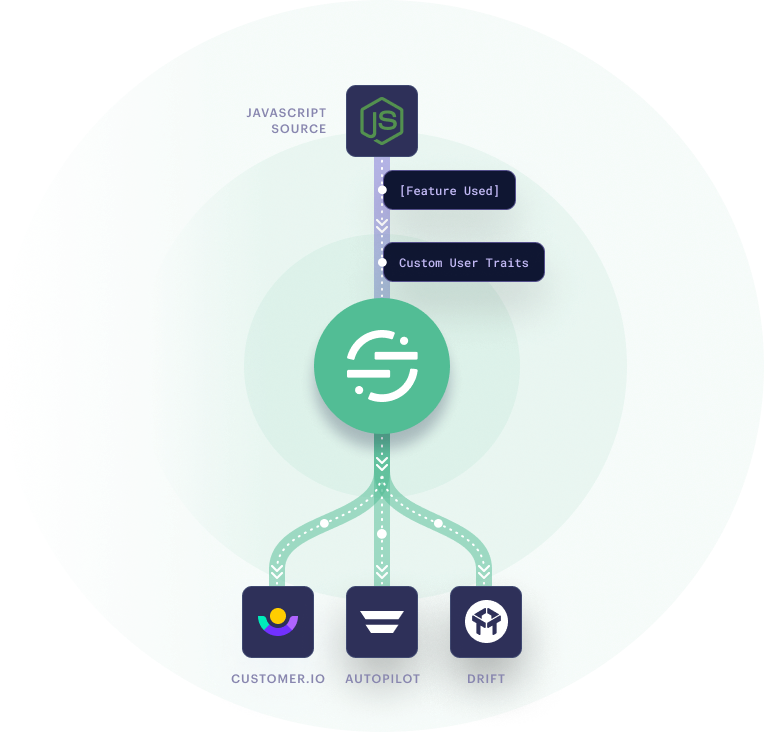
One of the best features Segment brings to stacks: allowing the same tool to send and receive data. Where other use cases such as the next one in this article see Customer.io sending event signals upstream to Segment, in this instance, we have a custom JavaScript (JS) data source pushing event and user traits to Customer.io.
And since Segment can send JS data to multiple communication platforms at once, we're delivering the same user data to Autopilot and Drift. With Drift, event data can trigger automated and personalized chat and text experiences (designed to qualify and convert users). Once it gets to Autopilot, it's combined with other customer data sources for personalized lead nurturing email campaigns (which are also automated).
Add Customer.io Email Events
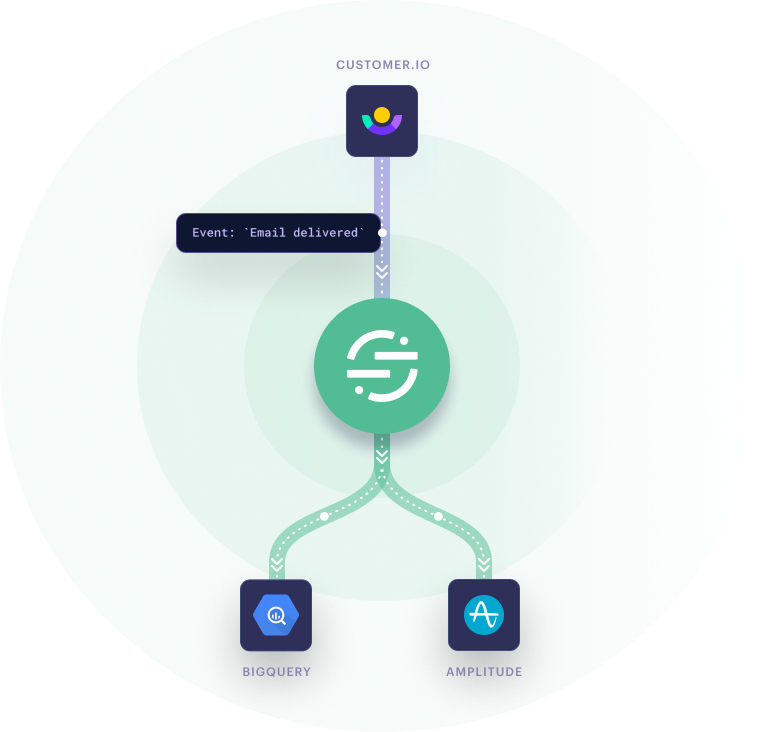
By intervening in crucial (context-specific) moments in the customer journey, marketers can improve the customer experience—increasing engagement and avoiding churn. However, event-based data from communications platforms like Customer.io are frequently disconnected from analytics platforms and marketing automations.
Segment connects event-based triggers from Customer.io with our product analytics platform Amplitude and our data warehouse BigQuery. Now events like Email Clicked can trigger any number of actions, like personalized purchase incentives or assigning users to various cohorts based on their demonstrated level of interest.
Report on JavaScript Data Sources
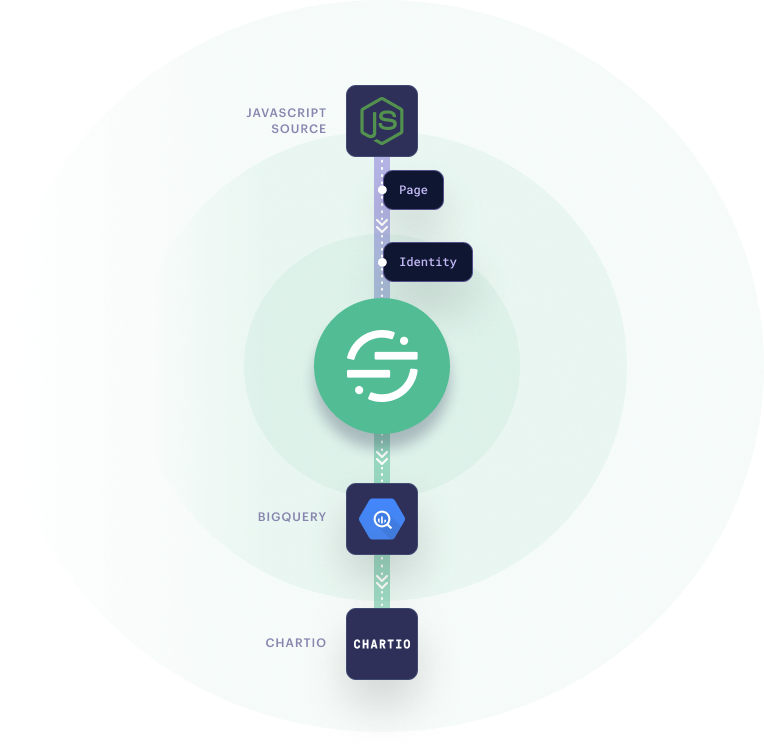
Custom attribution models use JS to send the data such as Page and Identity tables. But such custom data sources can be hard to sync with your reporting and data exploration tools such as Chartio.
With Segment, you can translate data and consolidate taxonomy, so they live alongside data from other sources in your warehouse and reporting tools. As a result, you can build accurate attribution and calculate your ROAS.
Load Ad Spend & Compare Ad Inventory Performance
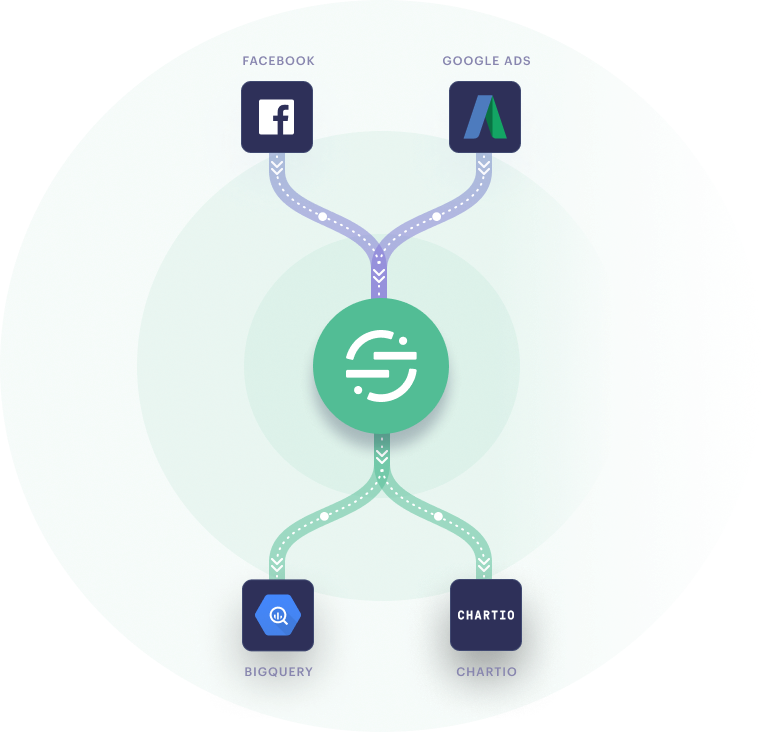
Facebook Ads and Google Ads don't play well together, which means you have to be creative in your reporting if you want to show the full picture. Segment comes to the rescue once again. Both ad inventory sources can be loaded into BigQuery. There, you’ll combine the ad spend data with web activity data that’s also piped through Segment.
The infrastructure will unlock new analytics possibilities. You’ll be able to push the combined data into visualization and modeling platforms like Chartio or POPSQL, and build models on key metrics such as Customer Acquisition Cost (CAC).
Your Visual Reference of B2C Subscription Tool Integrations
The diagrams you see above come from our infographic with examples and explanations of B2C subscription stacks integrated through Segment. Get your own pdf below for future use, so you can quickly scan it and remind yourself of ideas for your own stack.
Download your copy of the ecommerce stack infographic.
Join the Segment Startup Program, Build a Strong Stack, Grow Your B2C Subscription Business
Segment's Startup Program is here to give early-stage startups the tools necessary to build stacks like this and thrive. Eligible startups get $25k in Segment credits for up to two years, which can be used for Segment’s Team Plan.
Additionally, Segment is throwing in over $1 million in free marketing and analytics platforms like Amplitude and Amazon Web Services, on top of a number of heavy software discounts. You’ll even get access to level-up resources such as Segment’s Analytics Academy or Analytics office hours.
Eligible startups must have been incorporated less than two years ago and have raised no greater than $5 million in total funding.
Don’t wait any longer. Learn more about Segment’s one-of-a-kind Startup Program. And if you’d like a hand picking your tools along the way, feel free to use our WYSIWYG MarTech stack builder.
About the Author
Dan McGaw is the founder of McGaw.io, MarTech speaker, and co-founder of analytics tools such as UTM.io. He’s worked extensively with Segment implementations and led the creation of tools such as the Segment CSV importer.
The State of Personalization 2023
Our annual look at how attitudes, preferences, and experiences with personalization have evolved over the past year.