Choosing the right performance monitoring tool
By Prateek Srivastava
Over the next few weeks on the blog, we will profile a series of integration categories, starting today with Performance Monitoring tools. Our goal is to provide an initial overview of the range of tools available on the market and to suggest a few key criteria that might be useful to your organization as you set out to select a new tool. These are complex ecosystems and we did not attempt to exhaustively cover every player in the space, but rather share an initial overview. The tools themselves are continually evolving, and we’ve done our best to reflect the facts and latest features. Stay tuned for more posts like this in the coming days.
Having visibility into your apps is critical both for a positive customer experience and for protecting your business. Without the right visibility, your customers could be, unbeknownst to you, running into issues that cost you revenue. This problem compounds on mobile where the cost of customer acquisition is very high, and a negative customer experience not only risks churn but also creates the risk of negative reviews which can deter new customers. Ultimately, you can only fix what you can see, and you need the right tools to get visibility at scale.
Traditionally, developers have relied on analytics data as a proxy for realtime visibility, but as the app landscape becomes more complex, developers are recognizing the need for specialized tools for monitoring.
There are a number of performance monitoring solutions, so it can be easy to get overwhelmed by choosing the right one. This piece will cover an introduction to performance monitoring tools with a focus on the ones best suited for mobile. We’ll also explore the following:
Which types of monitoring are better for various team sizes and required level of reporting customization.
Why some monitoring tools with built-in integrations are popular (out-of-the-box). Cost is a big factor, so we will weigh in on pricing.
Whether the monitoring solution is open source.
Level of functionality: such as if it wraps into a larger dashboard that gives a big picture view of any SDKs.
Whether certain tools are better for certain types of code bases?
We'll help you understand the two broad categories of these tools and how to decide which tools are best suited for your requirements. But before you embark on your journey to find an application monitoring tool using the above detailed criteria, you first have to ask yourself two simple questions.
An error tracking tool allows you to both automatically capture any user-facing errors (and sometimes internal errors) that make your app unusable and report these errors for later inspection. This should be your first line of defense; a rule of thumb in customer success is that for every single user that writes in about an error, there are typically twenty-six more users who don't write in. Error tracking tools will help you see which errors are happening and how often specific errors are happening by aggregating them. This makes it easier to understand why these errors are happening by de-obfuscating stack traces and surfacing trends so you can fix that bug that only affects iOS 7 users on cellular networks on T-Mobile in the USA.
However, not all issues escalate to the level of an error. For instance, you may ship some code that slows down page load times on cellular networks. It doesn't make your app unusable but makes it annoyingly slow enough that users might be silently frustrated and stop using your app. Performance monitoring allows you keep an eye on more fine-grained information so that your developers continue to improve your user's experience.
For instance, for our purposes, we prefer Bugsnag and Sentry for error reporting because that's the primary focus of these tools, and by fully investing in one area, they deliver a great experience.
However, using multiple tools comes with the SDK bloat problem. All in one tools may make more sense for your business when you are truly using all of their various features. They will not only make your app smaller, but the integration between their various offerings will deliver even more value.
Typically, we recommend choosing the best tool for the job. However, some tools may offer both, which can be great for reducing SDK bloat. However, you should understand that this comes with the tradeoff that you may be selecting a tool that is not best in class.
To make sense of where various tools on the market stack up against these dimension, here’s a comparison chart:
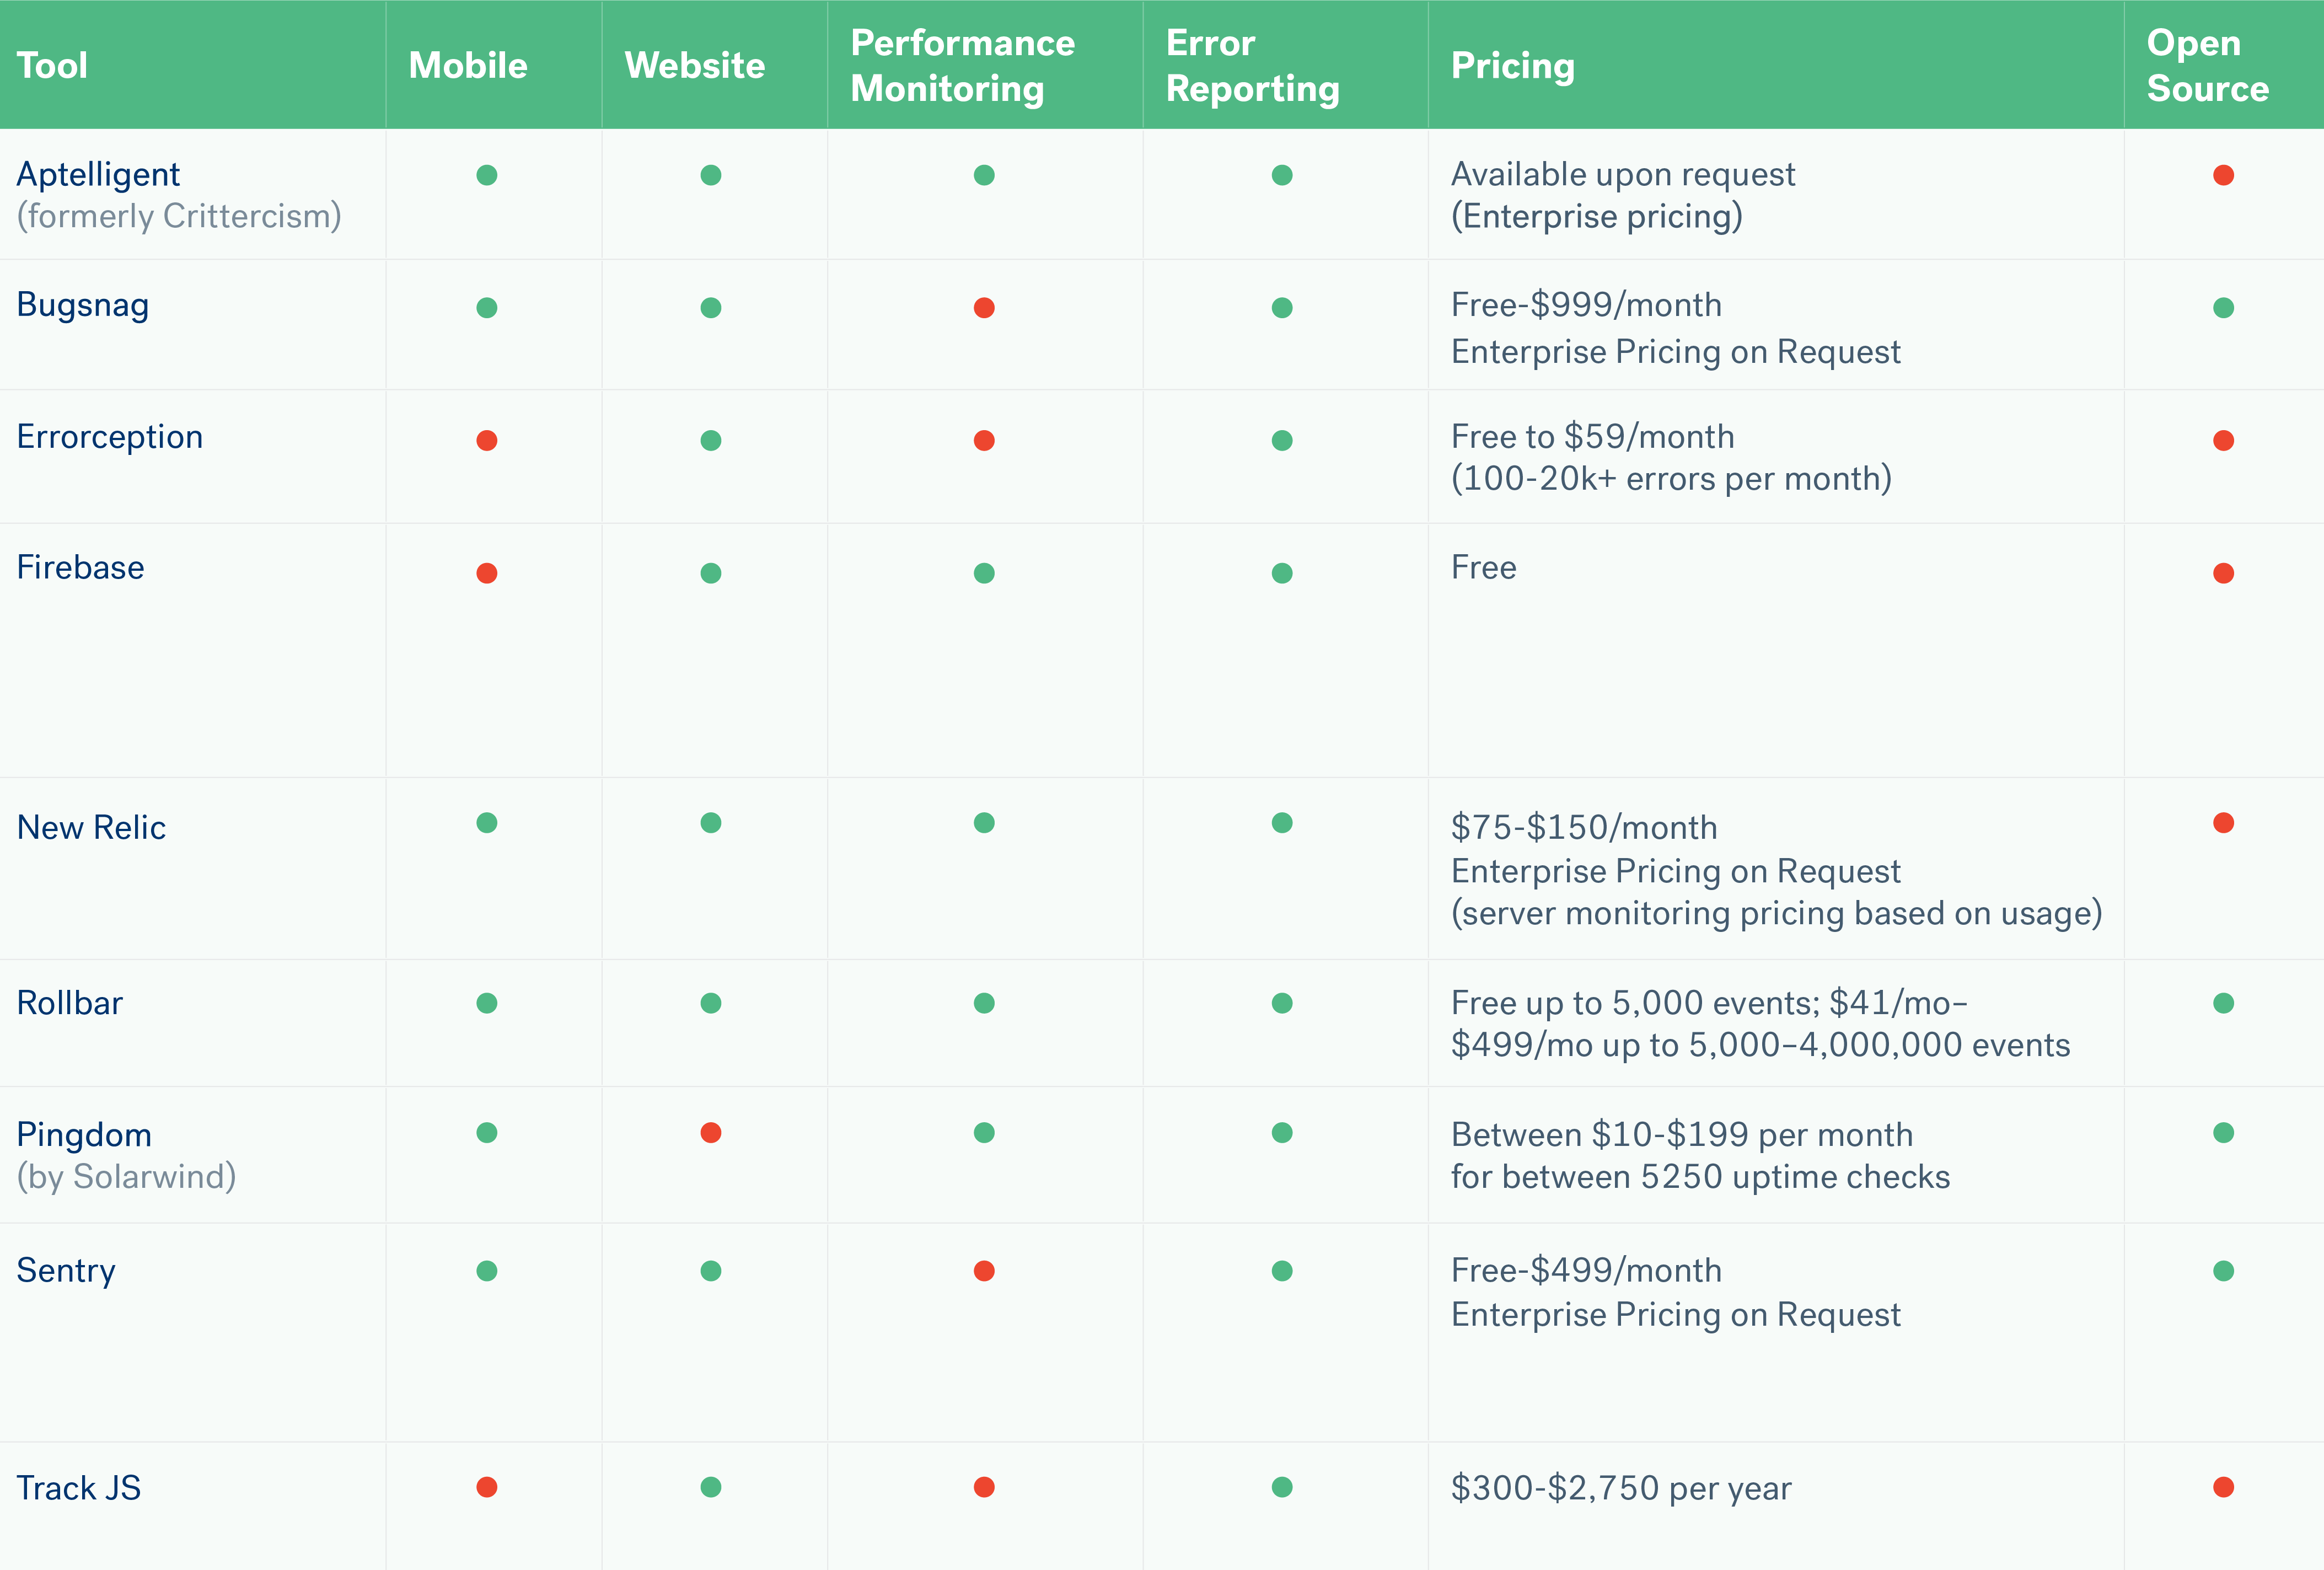
As you can see from our chart, many of the performance monitoring tools are being acquired by larger software solutions and are being integrated with other functionality into a single solution. This consolidation trend may very well continue.
At the customer level, the biggest trend we see is that more and customers are wanting to treat this data just like any other source of data in Segment. They want to join their application monitoring data with their other sources of customer data to derive additional insights on how errors impact the customer experience.
Some common use cases we see with Segment customers:
Join performance reports with Stripe data to measure revenue impact
Join crash reports with Zendesk data to understand support cost of different bugs
Use crash data to create an audience to target with an email campaign
We hope this deep dive gives you a better idea which performance monitoring tool might be best for your needs! If you’re interested in exploring these performance monitoring tools, you might want to look into Segment. We make it easier for you to try performance monitoring, analytics, and optimization services in unison. Instead of integrating each SDK one by one, you can collect customer interaction data with our API, integrate one SDK, and then flip a switch to integrate new tools. (No submitting to the app store!)
At Segment, we use our own platform to track the Segment customer experience (CX) and to flag if the application experiences latency. We use analytics.js to match Sentry data with other integrations, like FullStory and Warehouses, giving us a much richer context on our customers. Understanding how, when, and for whom our app crashes has enabled Segment to iterate quicker and fix bugs that would be very difficult to reproduce otherwise. In this way, tasks that would be typically engineering-driven can be accomplished easily by CX and product teams.
We currently offer native integrations for each of these monitoring tools on our platform. You can create a free account here or sign up for a premium, business account demo here.

Our annual look at how attitudes, preferences, and experiences with personalization have evolved over the past year.