What are Data Reports? + 3 Keys to High-Quality Reports
Data reporting is the process of organizing and curating information into a format that makes it easier to digest than if you looked at the raw data.
By Segment
Data reporting is the process of organizing and curating information into a format that makes it easier to digest than if you looked at the raw data.
Data doesn’t automatically translate to a “Eureka!” moment. The insights that give companies a competitive edge come from the ability to quickly synthesize and interpret complex data sets. So how does one get from point A (collecting data) to point B (organizing it into a comprehensive report)? We’ll show you how.
A data report takes an otherwise large or complex data set and is able to present this information in a way that’s succinct and broadly accessible. A data report distills key themes and trends that are represented in the data, and can take the form of a table, graph, or chart (certain business intelligence dashboards are able to update these graphs in real time).
Usually, a data report aims to answer a specific question(s). There can be quarterly data reports on key performance indicators for a business – like website traffic, closed-won deals, the conversion rate for ad campaigns – as just a few examples.
Data reporting, when done well, distills the essential information about a complicated situation or topic, making it easy for everyone to grasp. This characteristic makes data reports indispensable for modern organizations that often have to adapt with fast-changing macro- and micro-trends. Data-driven insights are the best way to “steer the ship,” helping businesses become more strategic, cost-effective, and innovative.
However, data literacy can be difficult to attain across an organization, with data reports offering a great solution: simplifying the process of gleaning insight. Here are the top three benefits of data reports.
A good data report takes an otherwise intimidating data set and makes it simpler to understand. It helps different stakeholders cut through the noise and see the overarching points. (E.g., is performance better quarter to quarter? Are there any areas where spending has gotten egregious?).
Data reports help simplify complex information in two important ways:
Curation. They present relevant data to the reader that answers the specific question being asked.
Visualization. They turn endless rows of numbers in a database into tables, charts, and graphs, making the information more accessible for the reader.
As we mentioned above, data reports are a quick way to get to the point, summarizing essential points and metrics. This mission-control-like overview allows managers to monitor business performance and even spot potential problems before they have a chance to unfold.
Even better, with real-time business intelligence dashboards teams can apply specific filters to quickly spin up reports for different stakeholders.
Data reports are also an effective way to illustrate patterns and trends – helping to drive deeper insight (e.g., attributing a dip or spike in web traffic to seasonality, which a business can then prepare for or anticipate moving forward).
Data reports play a crucial role in getting to the heart of the matter (and cutting out all the white noise). But being able to discern these overarching trends and patterns comes from understanding which metrics matter to the business (here’s a hint: focus on rates, not just totals that offer little context on their own, and know which teams are responsible for driving each metric).
Data reports can come in many different forms: real-time dashboards, shareholder reports, annual research studies. Here are some common types of data reports you may come across.
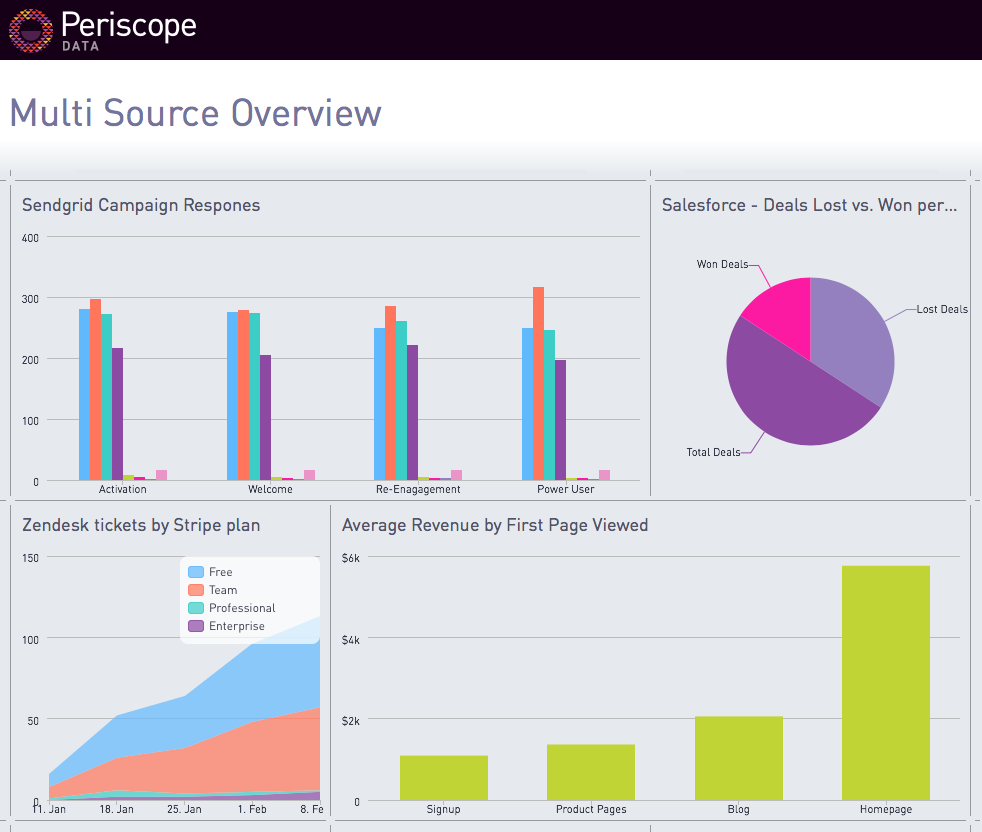
A customer analytics report helps companies understand—and, ideally, anticipate— a customer’s needs. These reports can show stats like product usage, the likelihood of churn, or purchase preferences (to give a few examples). They’re essential for product, marketing, and customer support teams to understand the ease of use of their product or interface, how well they’re retaining customers, opportunities for cross-sells or upsells, and so on.
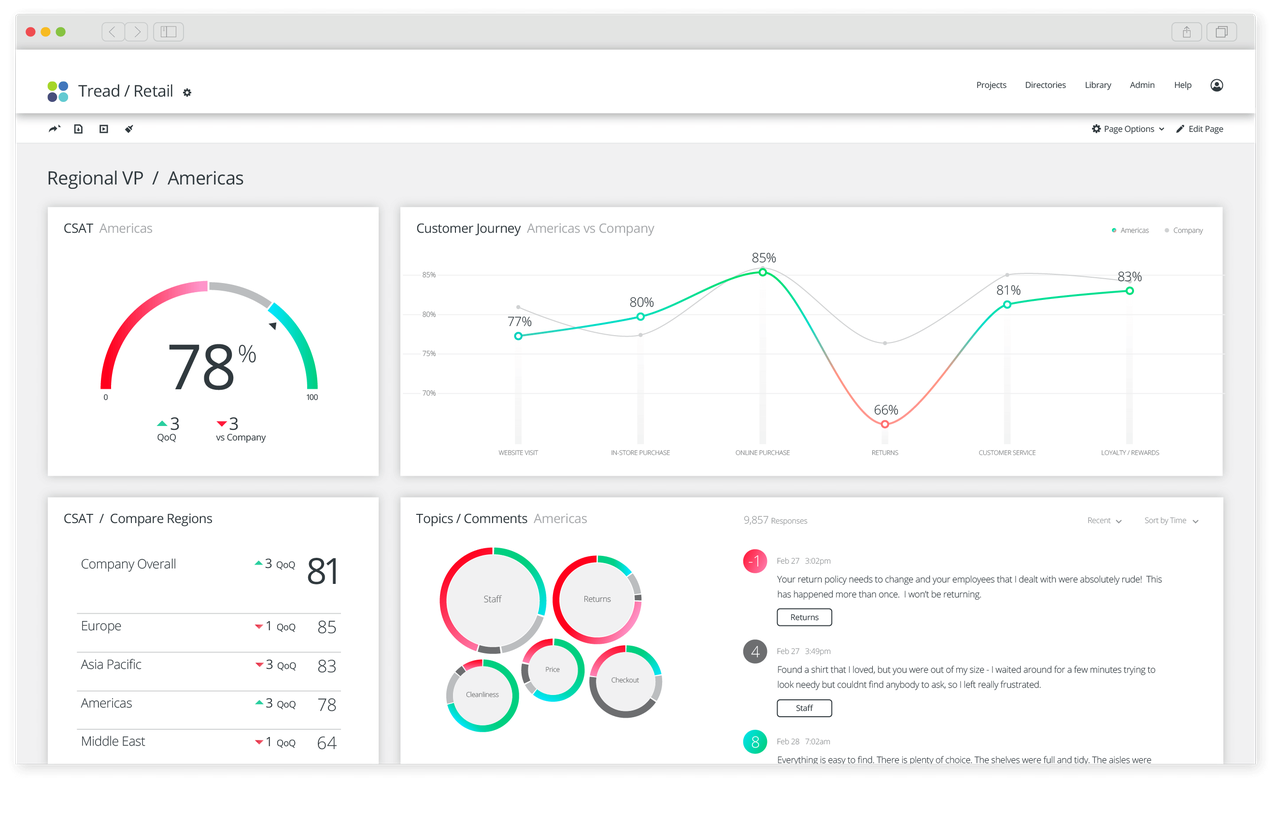
Source: Qualtrics
Gaining a holistic view of your customers, and how they interact with your business, can become considerably more challenging for companies that support multiple business units or geographies. While a company would of course want an understanding of business health as a whole, they’ll also want to drill down to understand how each region is performing, respectively. Using Segment’s Multi-Instance Destinations, companies can send different data to different analytics destinations. In this step-by-step guide, we show how to build a customized customer engagement report with Google Analytics.
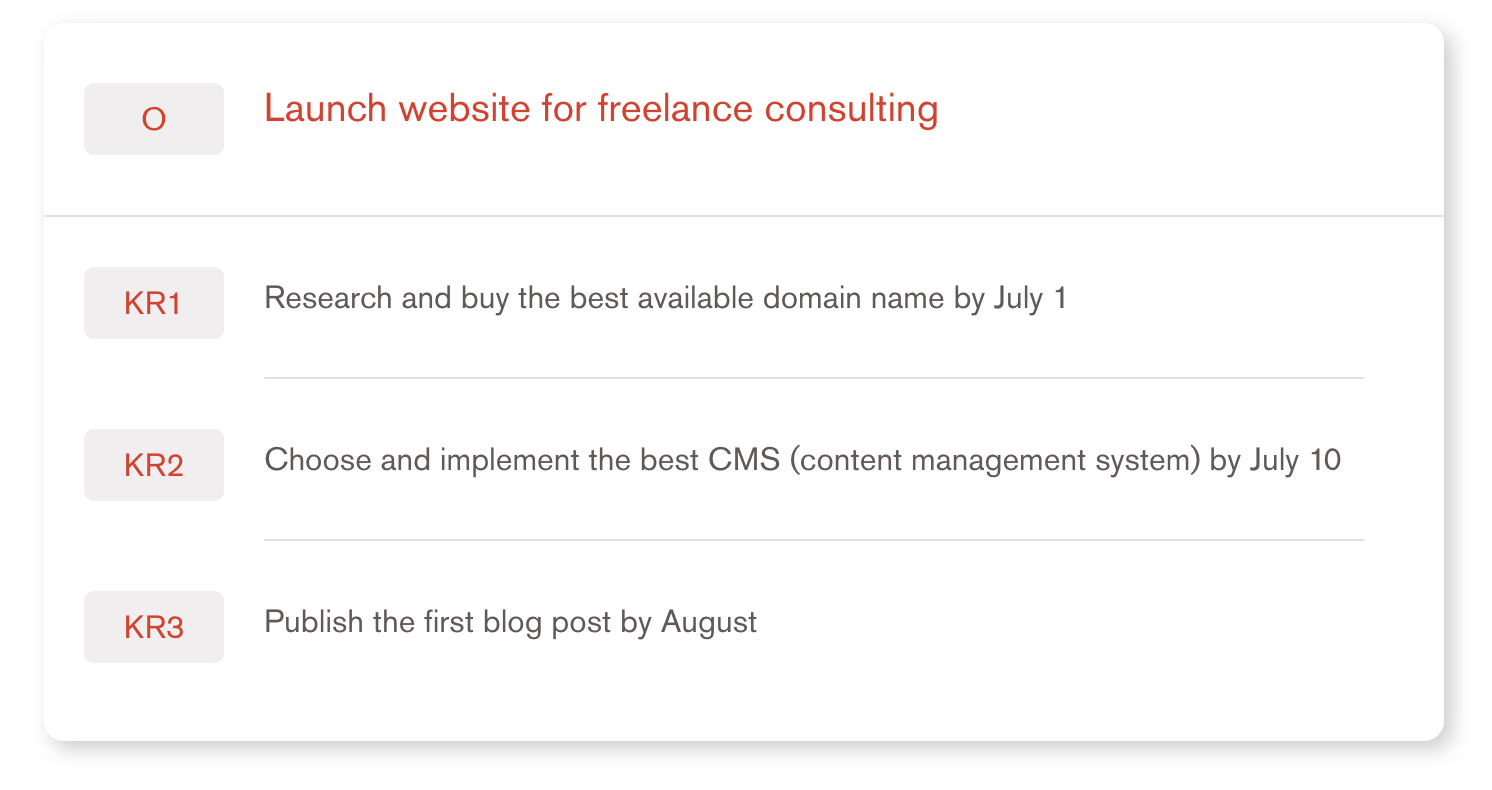
Key Performance Indicators (KPIs) and Objectives and Key Results (OKRs) help teams set goals and measure their progress based on a set of predefined metrics. While both KPIs and OKRs are used to measure business performance and success, a key distinction between the two is that OKRs – as their name suggests – are tied to an objective. Here's an example of how one might write an OKR:
Here’s how you can build real-time, company-wide KPI dashboards using Segment.
Financial reports provide an overview of the companies’ financial situation (e.g., revenue, profits, etc.). They can include historical data, like a quarterly breakdown of revenue and expenses or forecast ahead, like anticipated growth and earnings.
Most financial reports are critical for operating any business because they give you an understanding of how much money is coming in and where you’re spending it, allowing you to make corrections where necessary.
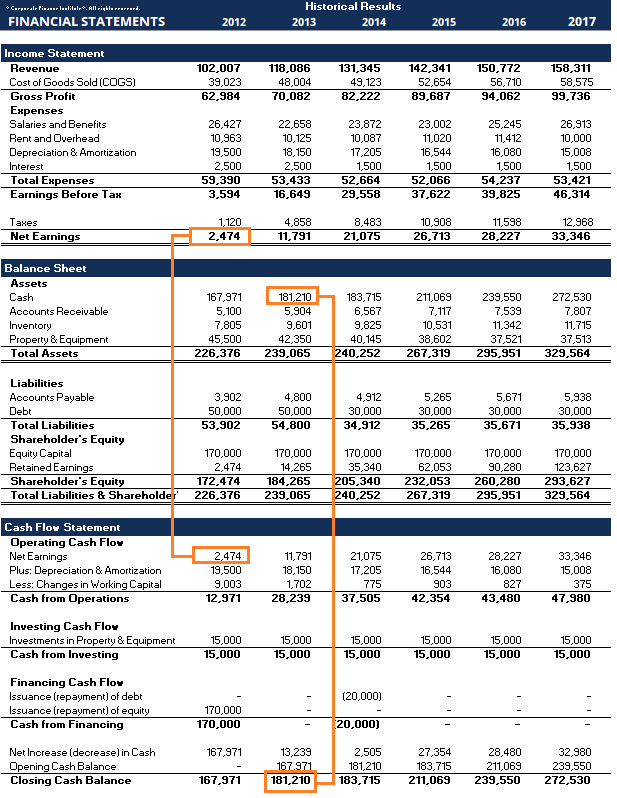
Source: Corporate Finance Institute
Research reports often set out to find extensive answers to a predefined question, like “Is there a market for our product in this region?” or “How are consumer buying patterns changing year over year?” These reports can be more informal (e.g., user research conducted internally) or huge undertakings that involve external agencies and months of work.
At Segment, we have launched several annual research reports that look at everything from trends among fast-growing companies to patterns regarding consumer engagement – like our most recent Personalization Report.
There is a framework for creating high-quality data reports: having a clear goal or question in mind, understanding where the data is coming from (and how it was analyzed), and structuring the information in a clear, cohesive way.
A data report sets out to answer a central question. Are we on track to hit our OKRs for the quarter? How does our earned revenue stack up against our forecasted revenue for the past year? There are countless questions that could be the driving force behind a data report, but the main point is: data reports aren’t aimless, random metrics pasted together. They’re an investigation into – and answer for – a larger question.
When putting together a data report it’s important to also consider who the intended audience is. Let’s say a company wants to put out an annual report about consumer behavior. That’s a pretty broad topic on its own, and someone who works in SaaS would likely be interested in much different trends than someone who works in e-commerce. On top of that, people within the same organization may have very different ideas of what relevant data entails (e.g., someone in the C-suite may want more of a top-level summary, while a team lead would be trying to discern the impact of their specific campaigns or initiatives).
Understanding where this data is coming from is also a crucial aspect of putting together an accurate report. As we say at Segment: what good is bad data?
Knowing with certainty that the data is reliable is a must, and this comes down to how you’re collecting data, the infrastructure in place for consolidating, storing, and sharing said data, and how integrated your tech stack is (among other qualities).
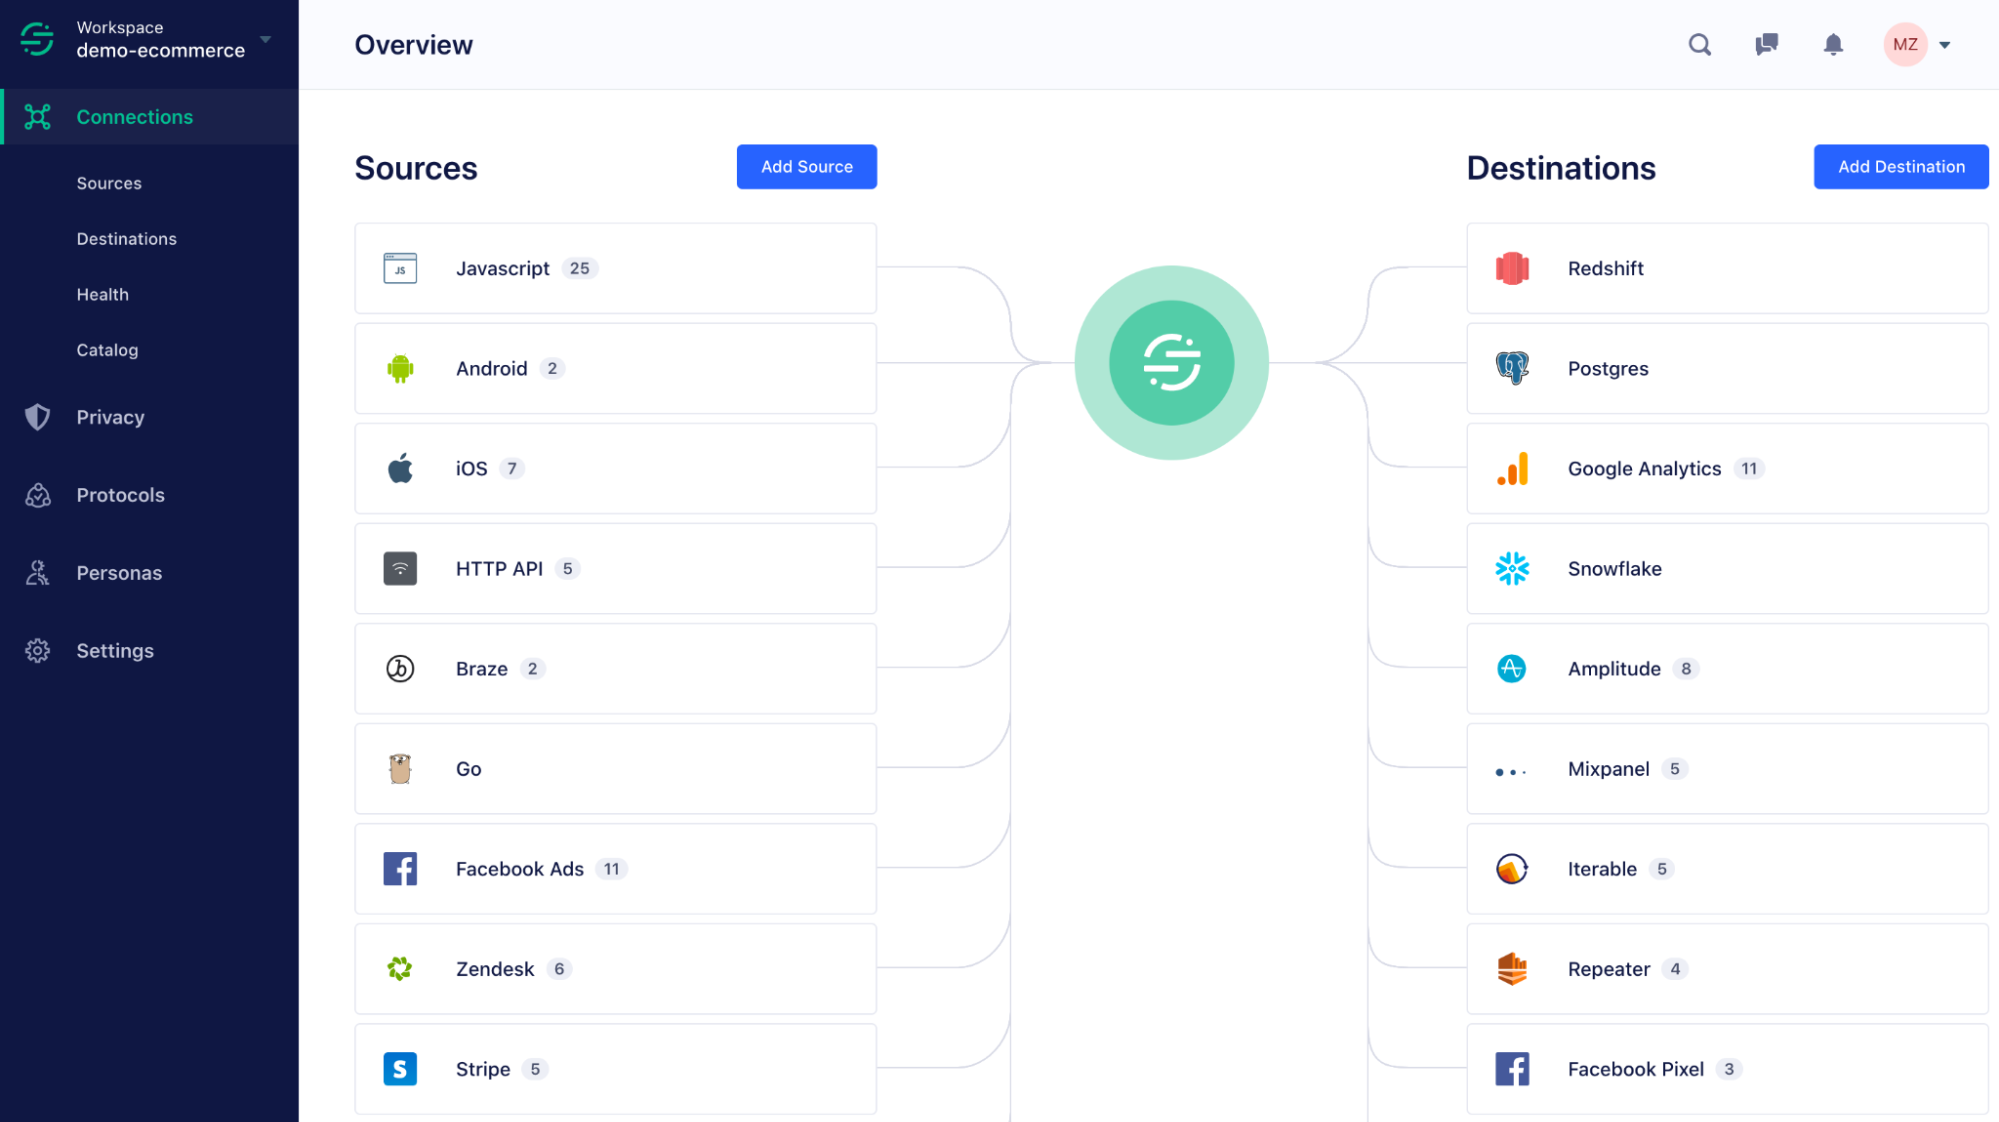
A Customer Data Platform (CDP) like Segment pays enormous dividends here. Segment Connections ensure your data is unified, centralized, and ready for company-wide use.
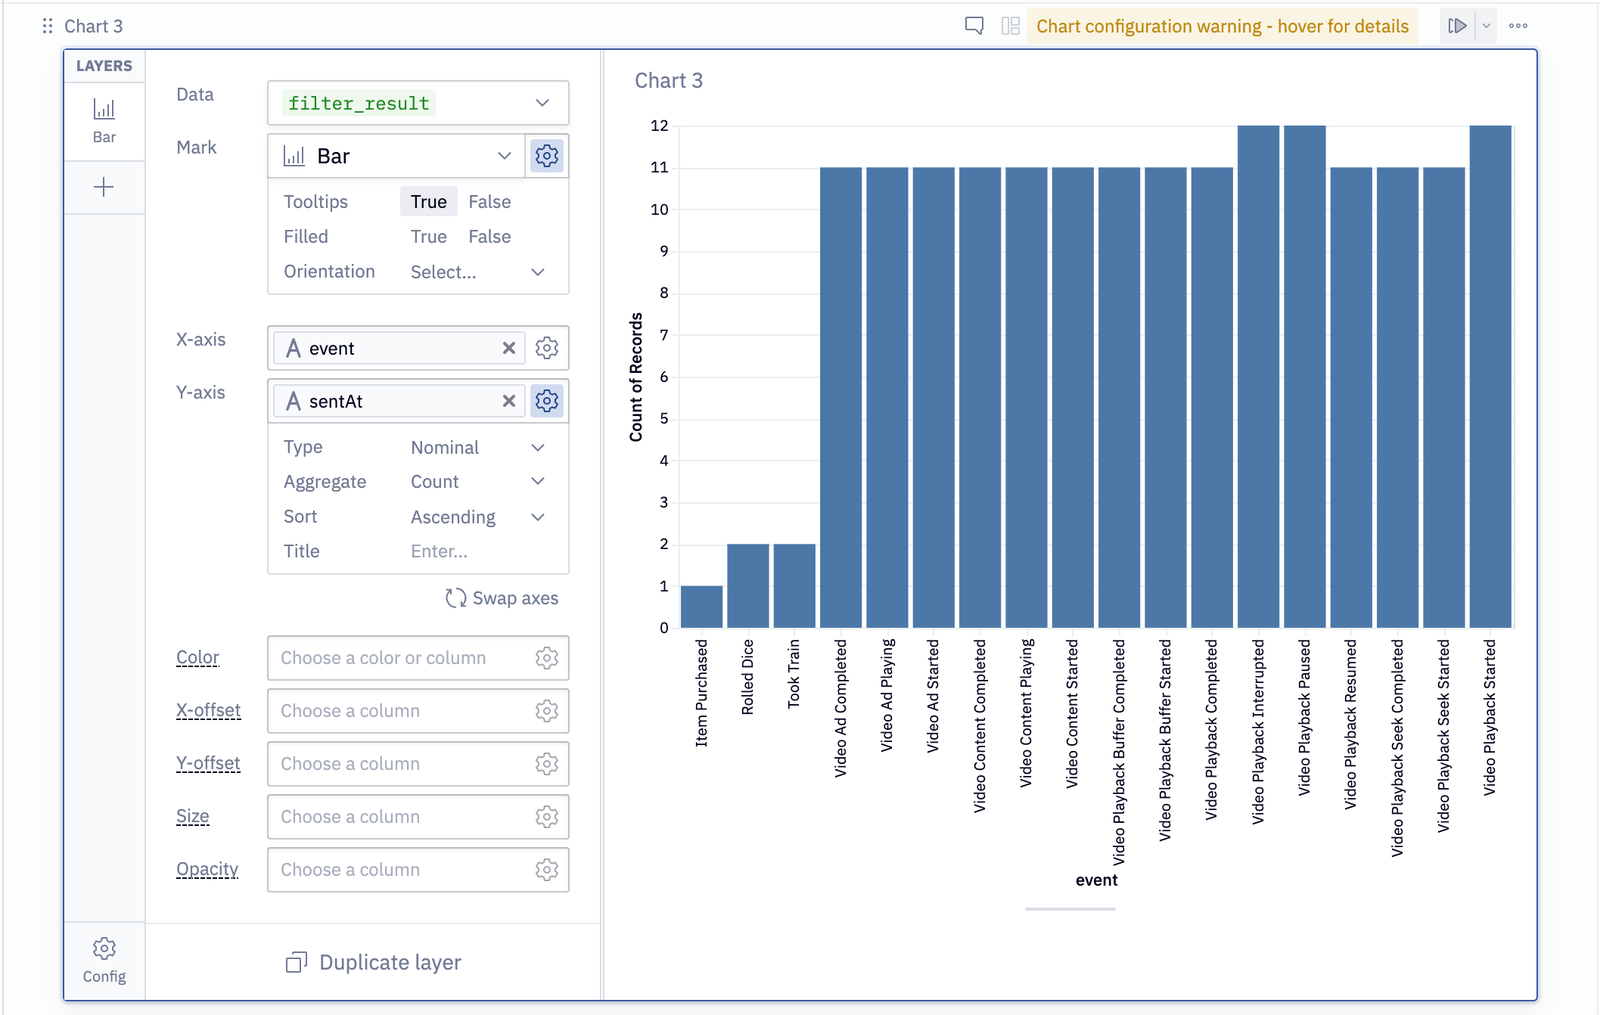
Presenting and structuring your data reports involves picking the most relevant information and then visualizing that data in a way that makes it as easy as possible for the reader to grasp. Such visualization goes beyond creating a chart or graph (table stakes in modern data reporting). You’ll need to build virtual dashboards, use data visualization tools, and connect them to a centralized data platform like Segment.
Learn how to use Hex, Python, Segment, and AWS S3 for data visualization here.
Throughout this report, we’ve referenced one of the most important attributes of data reporting: accuracy. If the data you collect and process is incomplete, inaccurate (e.g., duplicate entries, inconsistent), or outdated, you can bet that your data report will be too.
This is where a customer data platform can be essential, helping businesses to ensure data collection, quality, and activation at scale. Here are a few ways a CDP accomplishes this.
Internal alignment is the first step in ensuring data accuracy. When teams work in silos, data becomes divvied up between the different tools and systems owned by different departments. This results in blindspots (i.e., a lack of a complete customer view and incomplete data), and duplicates (e.g., the same event being counted twice, because it’s referred to by a different name between teams).
Standardizing naming conventions is a fundamental step in implementing a shared data dictionary across the organization – which brings clarity and structure as to what data is being collected, how it’s being processed, and where it’s stored.
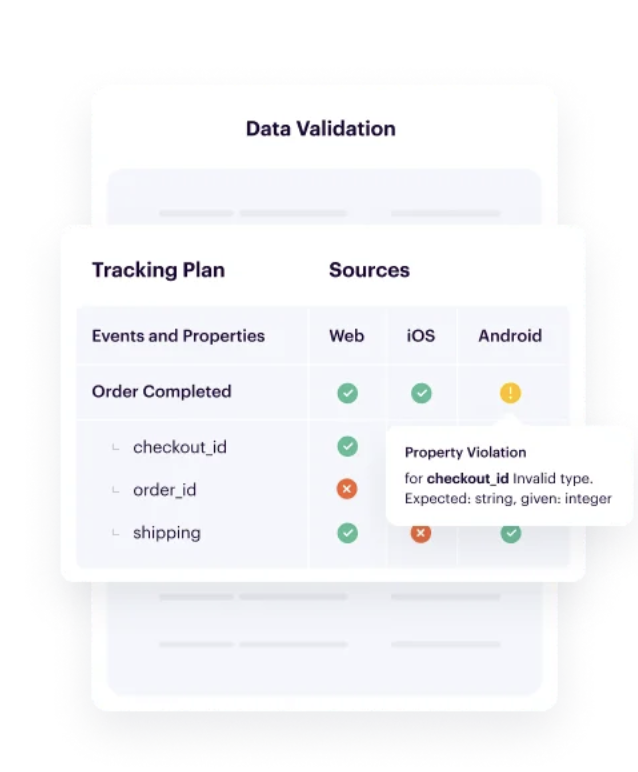
With Segment, you can enforce this data dictionary at scale using Protocols.
Along with helping businesses enforce a universal tracking plan, Protocols can also help automate data governance at scale. One way it’s able to do this is by automating QA checks, to proactively block bad data (that does not adhere to their predefined tracking plan) before it moves to a downstream destination.
A key component of data accuracy is whether or not your data is complete. With all the various channels and touchpoints companies have today, it’s easy for key data points to fall through the cracks. With Segment’s CDP, businesses are able to leverage hundreds of pre-built integrations to seamlessly connect every tool in their tech stack (along with building their own custom integrations, if needed).

Our annual look at how attitudes, preferences, and experiences with personalization have evolved over the past year.
A data analysis report is a summary of trends, outcomes, or patterns that came from analyzing a specific set of data.
Data reports are important because they help identify patterns and trends in otherwise large and complex data sets – helping to distill important information across an organization to improve decision making, hone strategies, and become more data-driven.
A few best practices to follow when putting together a data report is to: 1. Ensure the data being used is accurate, complete, and up to date. 2. Have a clear question and goal in mind for the data report (e.g., what are we trying to answer here?) 3. Understand your audience (e.g., what takeaways are most relevant to the people we’re delivering this report to). 4. Make sure information is displayed in a clear, visually compelling way for fast analysis.
Data analysis is the process of getting insights from a data set (e.g., being able to understand year-over-year business growth by analyzing metrics like revenue, churn rate, retention rate, etc.). A data report is when these insights are aggregated and displayed in an easy-to-understand way like charts, tables, etc.
What’s included in a data report will depend on the type of report being created. For example, a report focused on customer engagement may focus on metrics like website traffic (and its growth quarter over quarter), retention rates, etc. A financial report may look at revenue, profit, ROI and efficiency of new technologies, etc.