Mixpanel and Google Analytics: Debugging Reporting Discrepancies in Four Steps
By Andy Jiang
It’s common for teams to use multiple tools to understand how users interact with their product. Two very popular analytics tools are Google Analytics and Mixpanel. These tools compliment each other nicely since both offer slightly different analysis capabilities. But the potential downside of using two different tools is data discrepancies. That is to say, when data is inconsistent, it’s hard to trust.
In this post, we’ll share a systematic approach towards identifying the underlying causes of inconsistent data and debugging on both the client and server (we’ll save mobile for another time).

This post is meant for folks who have instrumented Mixpanel and GA separately. If you use Segment, you won’t have to worry about discrepancies because the same data is being sent to each tool. That said, these debugging steps are helpful in nearly any data discrepancy situation.
Before mining through your logs and stack traces, you’d want to confirm that there is a legitimate discrepancy. Due to the nuanced reporting and time zone differences of Mixpanel and Google Analytics, it’s easy to assume something is wrong if the numbers don’t match, when in fact, things are working correctly.
We usually suggest that customers investigate discrepancies if there is more than a 5% difference than their production database. If it’s lower than that, it’s likely that the differences are immaterial enough to your business that it’s not worth a full tracking audit. This is because often, you’re using analytics to report trends rather than identify super exact numbers (e.g. Are we growing? How fast are we growing?) So a slight difference isn’t a big deal.
If the difference is greater than 5% across all events or there is one event that doesn’t match, then that warrants further investigation.
First, take a look if you are seeing a difference in page views or track events. If you’re working with page views, make sure to note that Google Analytics splits out numbers for URLs with random query strings appended. For example, page views will be distributed across the following URLs:
..whereas those would all be consolidated in other tools. This is a common reason for their to appear to be discrepancies, and why you might see more page views in Mixpanel. To note, Mixpanel does not track page views automatically, you have to send a mixpanel.track("Viewed X Page") call in the client-side when the page is loaded to mimic a “page view” event.
If you notice a difference in numbers for both pageviews and events, do some more digging.
To narrow down on where the inconsistency may occur, select one specific event that you are sending to both Mixpanel and Google Analytics. It’s important that this event is not something “unique” to one tool or the other.
For example, avoid comparing sessions in Google Analytics with an event in Mixpanel, since sessions is specifically defined for Google Analytics.
It may be obvious, but it’s equally important to view the report of this event across the same time period for both tools. We recommend using at least a week’s worth of data to minimize variance due to time zone differences.
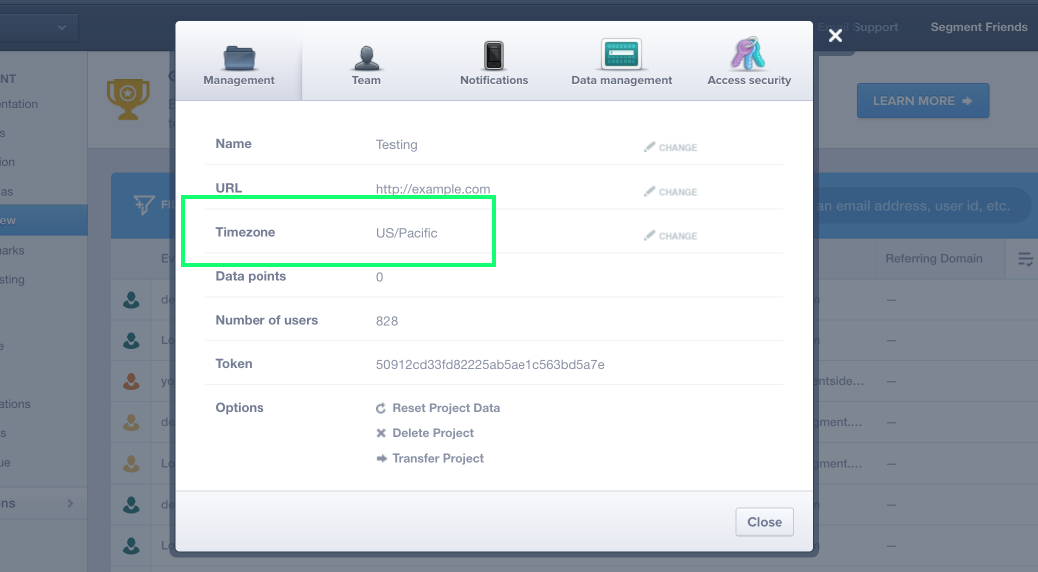
Mixpanel will default a new project to US/Pacific time (UTC-8) whereas Google Analytics defaults to your local timezone, so this could be another cause for “discrepancies.” Here’s how to check your timezones for your projects in each tool.
In Mixpanel, click on the tiny gear icon on the bottom left. Then you’ll see the below pop up that’ll have your project settings:
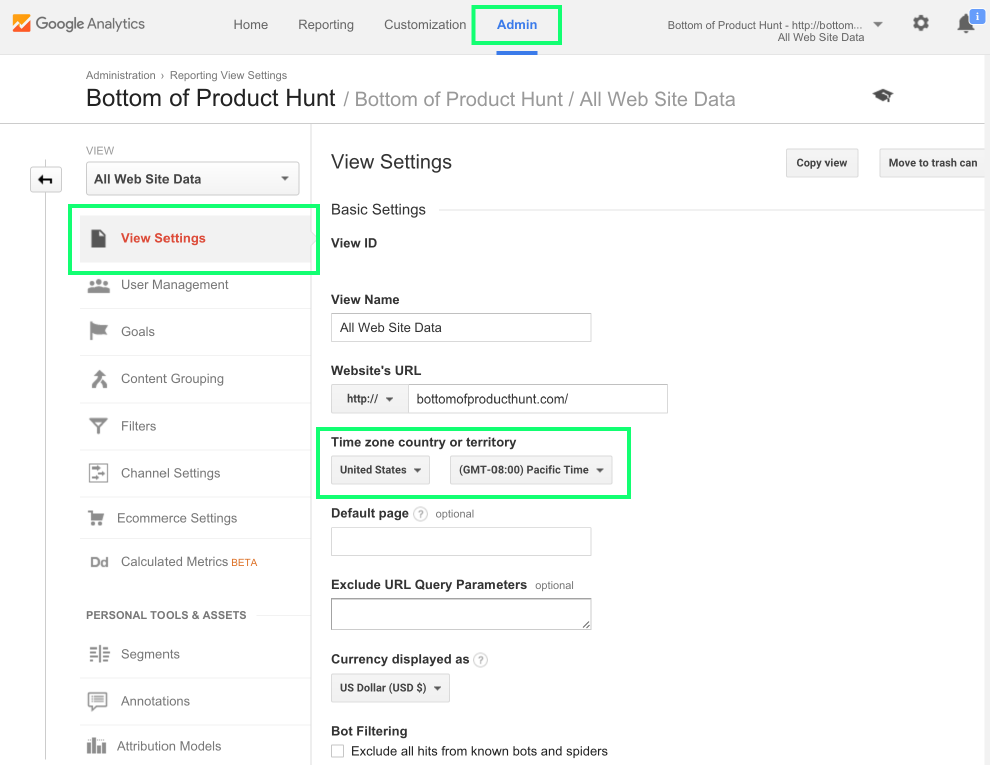
In Google Analytics, click on Admin, then View Settings:
Both Mixpanel and Google Analytics allow changing the default timezone, but note that those changes will not apply retroactively to existing event data.
Though you must send all events with timestamp as UTC, Mixpanel will convert the time to the project timestamp before storing it in its database. Once the events are stored, they cannot be altered later. Therefore is, the updated timezone only effects new events coming in.
Mixpanel’s documentation on time zones further expands on how this will effect reporting:
As such, a changed time zone can result in either going ‘backwards’ or ‘forwards’ in time, creating a temporary doubling effect on your data, or an ominous looking hole in time where no data is received. This is due to the fact that the existing data remains in the previous time zone, but the new data either jumps forward in time or goes back to an earlier time zone.
In most cases, if the timezone is set to the same for both Google Analytics and Mixpanel, then the data should be pretty consistent.
There will almost always be some discrepancy if Google Analytics “samples” data in your reports. Here’s more from their help page:
Sampling occurs automatically when more than 500,000 sessions (25M for Premium) are collected for a report, allowing Google Analytics to generate reports more quickly for those large data sets.
You can tell if the report is being sampled by the description on the top right corner:
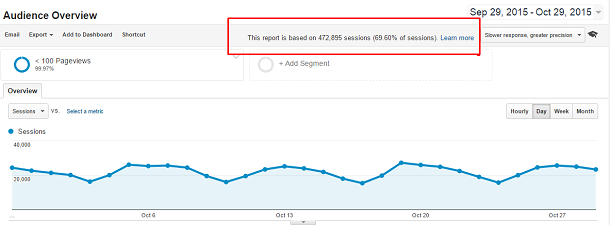
Above screenshot taken from www.morevisibility.com.
There are certainly ways around adjusting the sampling in your reporting. We won’t go into details of troubleshooting this aspect of Google Analytics, but there’s plenty of literature on the web.
Now, if you still see a discrepancy, it’s time to look at the code.
A common cause for seeing discrepancies is because the events are being sent differently to each tool. You need to ensure GA and Mixpanel fire events at the same time. If you send one client-side and another server-side, you’ll probably see some differences.
If you’re using Segment to send data to both Google Analytics and Mixpanel, then feel free to skip to STEP 3.
It’s important that tracking code to both tools is actually within proximity of each other for maintainability and debugging.
For example, if you’re making a call to Mixpanel from the server and the same call to Google Analytics from the client, then you’ll run into data consistency and code maintainability issues. Every time you change the call to Google Analytics, you’ll have to remember to do the same for the Mixpanel call that is located in another corner of your code base.
You can check whether or not the tracking code is next to each other in your code base by going through your code base (trusty ol’ ctrl-f in Sublime, searching through the repo via GitHub, etc.).
Note if the event being fired to both Mixpanel and Google Analytics in the same areas of your code base. If conditions are met to send a call to Mixpanel, then is it 100% that a call will be sent to Google Analytics?
If not, bring those calls back together.
If you’re seeing a difference in client-side fired events and your production database, you’ll also want to think through common problems with the client.
Sending calls from the client can be finicky. You’re at the mercy of ad blockers, intermittent network connections, and page unloads interrupting JavaScript on the page.
Ad blockers are browser extensions that prevent any third-party tracking libraries from loading onto the page. So, if you’re tracking some events from the client that differ slightly from the events sent from the server, it’s possible that ad blockers are the reason.
Depending on your audience, the impact of ad blockers could vary greatly. If your customers don’t use adblockers that much, you don’t have to worry about it. But if you’re targeting a millennial in the Bay Area who spends time reading tech blogs, you could see a huge variance.
Additionally, there are configurable ad blockers like Ghostery that allow users to choose to block specific services. Unfortunately, there is no way to know those settings.
Your best bet to get around ad blockers is to send the most important events, like Account Created and Order Completed on the server-side.
However, if you have a tracking pixel that can only live in the browser, then one suggestion is to (nicely) ask your users to disable ad blocking for more personalized experiences.
If you’re tracking a form submit or a button click that’ll take the user away from the page, it’s possible that this interrupts the track request from leaving the browser. Many browsers stop executing JavaScript when the page starts “unloading”, which means those JavaScript commands to send calls may never execute.
One prime example is if you’re tracking sign ups from the client based off a form submission. We’ve seen scenarios where sign ups were consistently ~10% fewer than the Account Created event that is triggered on the server side. Clicking the submit button will immediately start loading the next page and often the trackcall for recording the submission won’t run.
One solution to this is to intercept the event and stop the page from unloading. You can then send your track call as usual, insert a short timeout, and resubmit the form programmatically. (Our friend Rob Sobers actually has a great post on this.)
Here is an example for form submit:
Our open-source analytics.js library exposes .trackLink() and .trackForm()methods, which handles these use cases easily for you. You can see how we do the same thing in the code here.
If you’re tracking an event that may be affected by the page unloading, then it’s possible that these events are consistently fewer than server-side events. Also note that inserting the timeout is not a guaranteed workaround. Depending on the internet connection of the user, some requests still won’t make it. For business critical events, the best way is to migrate those to the server.
If you’ve checked each of these cases and considered all of these common problems, and still have discrepancies, it’s time to jump into code and inspect the requests.
Many analytics APIs accept everything and respond with 200 OK. This prevents their servers from crashing due to a sudden influx of bad requests, but also makes it harder for end users to debug their tracking.
For some semantic events, such as Google Analytics’ ecommerce events like Completed Order, certain properties are required for the event to be populated successfully, ex: revenue. Mixpanel is more lenient—there are no semantic event names that are treated differently.
Inspecting the requests can help you uncover these gotchas.
For this post, we’ll explore debugging on the client and on the server (we’ll save mobile for another time).
The developer console is your friend. (tips to find the developer console). It allows you to send manual requests via JavaScript with the functions made available to the DOM.
For instance, you can open up the developer console in your browser while on your site and send calls:
After manually firing the call, you can inspect the Network tab. For Google Analytics, you can filter for requests going to “www.google-analytics.com”, whereas for Mixpanel, you can filter for requests going to “api.mixpanel.com” (though just typing “google” or “mixpanel” in the input field will suffice).
The network tab in Chrome’s developer console filtering for “google”:
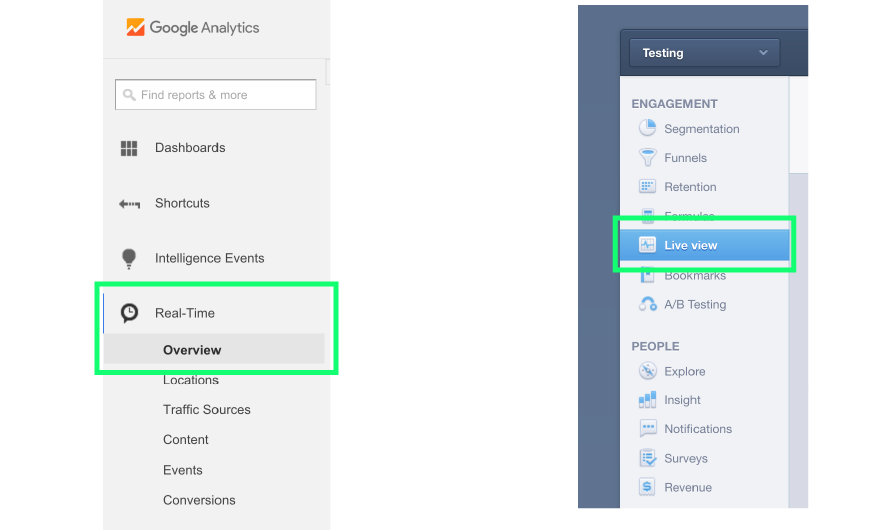
Lastly, confirm that the requests populate in the end tool. For Google Analytics, the only report that populates in real-time is the “real-time” view on the left side. Mixpanel events show up in real-time by default, but is easiest accessed in the “Live view” tab on the left.
If the data is not populating in the end tool as you’d expect, check their respective documentation to ensure you are forming the call correctly.
More tips on debugging GA on the client including their Chrome extension here.
There are many ways to unpack the request that you’re sending on the server side to see what exactly you’re doing. One way I like best is mimicking the web request with a cURL, so you can experiment granularly on the request level to see if something works or not.
cURL is super powerful, but if you want tools that are easier to use, check out httpie or POSTman._
Note that by design, these tracking APIs will return 200 OK. The key here is to use the real-time views of these tools to see whether or not the data is populated as you’d expect.
With Google Analytics, their measurement protocol defines how you can send a server-side event. They also have a special debug endpoint that you should use to validate the request. Here is a sample cURL command with hit type as “pageview” that you can try in your terminal (replace the UA ID and cid with yours):
Keep in mind that the request data body must be urlencoded!
Note that the special debug endpoint won’t populate your Google Analytics real-time view; instead, you’ll receive a response in your terminal as such (here I provided an invalid tid):
If you’re having some trouble putting together the request, check out Google’s hit builder. It’s a nifty standalone tool that helps populate the parameters in the hit request, as well as validates the request against its validation server.
Once you’ve validated the request, you can send the same cURL again, but this time to the real endpoint (remove “/debug” so you’re sending it to “https://ssl.google-analytics.com/collect“) and you can see it populate in your real-time report.
Mixpanel is similar, but uses a GET request and passes the data as base64-encoded querystring. Here, we take the following JSON object:
..encode it with base64, and append it to the Mixpanel endpoint, so the final cURL looks like this:
Mixpanel will return a 0 if the event is rejected and a 1 if it is accepted. Their documentation also states which properties are required and optional.
Hopefully, you can confirm that requests are being received properly in both Google Analytics and Mixpanel real-time reports. Going through this exercise helps identify whether the request itself is populating as expected; if either one is not populating, then you know where the discrepancy is coming from!
Debugging data discrepancies can be a drag, though hopefully these steps made it easier! If you’re interested in narrowing the scope of your tracking code for better maintenance, you can use Segment as a single API to route events to tools like Google Analytics, Mixpanel, and more.
Another way to keep your data discrepancies to a minimum is to document each event you’re tracking, what it’s capturing, and where it should be fired in a tracking plan. A tracking plan provides the necessary structure and discipline for learning about product usage, while keeping all team members on the same page about what events are tracked and why. You can learn more about the benefits of a tracking plan here and check out some downloadable tracking plan templates here.

Our annual look at how attitudes, preferences, and experiences with personalization have evolved over the past year.