The Ecommerce Startup Guide to MarTech: What to Track and Put in Your Stack
By Dan McGaw
I've watched thousands of startups build, grow, and optimize their tech stacks. Throughout the years, and while implementing Segment, teams have asked me the same questions time and time again.
Which events should we track?
What about metrics and customer data?
The answers are consequential; I've seen too many promising startups with great products fail due to fixable logistical issues and insufficient resources. That's why we’re collaborating with Segment’s Startup Program to give you this take on the tools, metrics, and user events crucial for success: this time for ecommerce companies.
The nature of ecommerce necessitates a speedy tech stack to seamlessly collect user data, transmit it to the relevant destination, and respond to customer activity in real-time. The complete customer journey and closed reporting loop that will provide a stable framework from which you can scale your business.
As your business grows, you'll use your tech stack to further refine and optimize your practices, now armed with historical data that covers the full customer journey. From here, you'll find and grow the lifetime value of your customers, allowing you to optimize your customer acquisition for actual ROI and ROAS. You’ll also have what it takes to improve drop-off rates, or automate communication throughout the touchpoints.
Ultimately, you’ll be able to snowball the revenue.
So, which events are most relevant to ecommerce startups?
You want to focus on the customer journey and cover its full range. Cover the various stages in the purchase flow. Pay attention to the following interactions:
Product Viewed: Occurs when a user visits a product page.
Product Added: Whenever a visitor adds a product to their shopping cart.
Checkout Started: Once a visitor adds a product and clicks the “checkout” button.
Checkout Step Completed: After a visitor adds a product, clicks the “checkout” button, enters their payment information, and moves onto the final stage of checkout..
Order Completed: Once a visitor completes entering all their information for purchase and reaches the thank you screen.
As a part of transactional sites, e-commerce pages are focused on converting visitors into customers and first-time customers into repeat customers. The metrics most valuable to you will be those that uncover subtle shopping behavior, connecting your customer's average purchase spend with their repurchase rate, lifetime value, and finally, to your sales totals.
The percentage of visits that convert into orders. The metric helps you answer “What makes the customers purchase the first time?”
The averaged total value of every order placed on a store over a specified period. The metric helps you answer “What makes the customers spend more?” or “Which campaign leads to the highest purchases?”
Shows the revenue you've earned across all channels and orders placed. This is often the KPI for ecommerce marketing. The metric helps you answer “Which products are our 80-20?” or “What are the main movers of our top-line revenue?”.
The total value in dollars the customer will contribute over a lifetime. Lifetime is usually calculated between 12 and 24 months. The metric helps you answer “What is the real value of the customer we acquired?”
CLV takes reporting from immediate to real value. Lifetime value is often a lot higher than immediate value. Also, when one channel, campaign or product stands out in immediate value, it doesn’t necessarily stand out in lifetime value.
Another valuable metric that measures repeat purchases. Repurchase rate and frequency are calculated by dividing the number of customers who made at least two purchases in a given timeframe by the total customer count.
One of your most actionable metrics in ecommerce is your repeat purchase rate. You can measure it with the help of your order completed event, and tying it to the customer whose journey you follow. Then you’ll build out a funnel to see what channels and products drive repeat purchases. So the metric will help answer “What makes our customers come back?”
By combining the power and utility of different MarTech tools, you expand the capabilities of each. That’s how you use a stack to improve or scale ecommerce revenue. Let’s walk through examples.
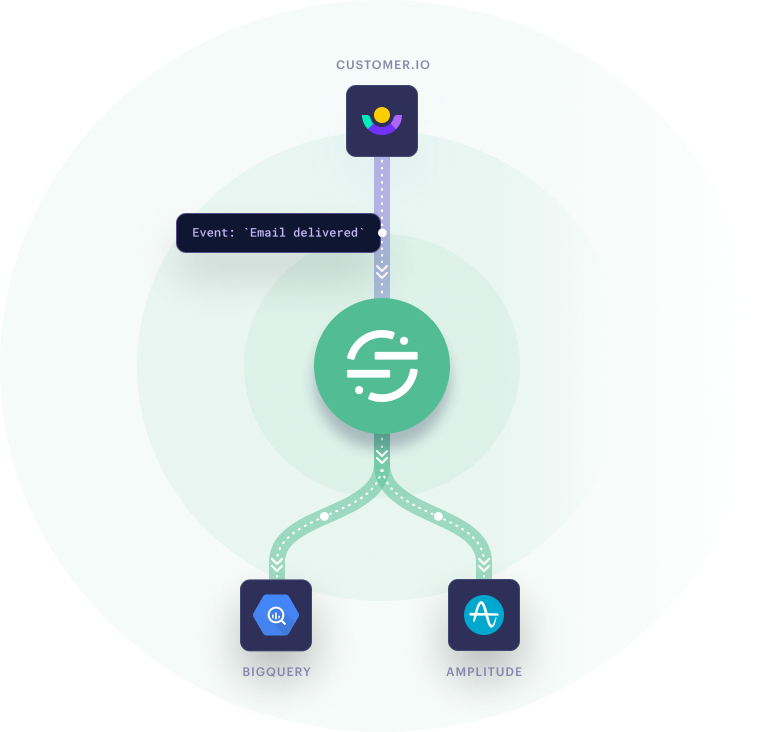
Email events from platforms such as Customer.io often do not make it to user analytics or data warehouses. That’s a huge missed opportunity for personalization or touchpoint automation. Segment translates event data from your email platform and passes it on to tools such as BigQuery and Amplitude.
You can then follow the full customer journey, optimize based on events such as Email Delivered / Opened / Clicked / Unsubscribe, or create complete reporting about your email flows.
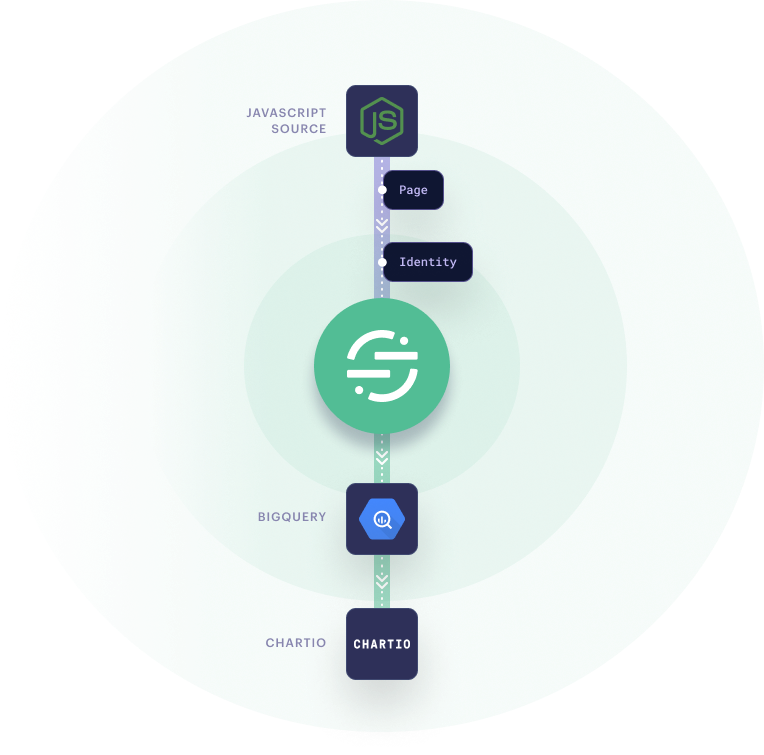
Javascript is the standard language for analytics. Along with the biggest tools such as Google Analytics or Tag Manager, and many others, you’ll see javascript in custom attribution models. The models often populate data that’s hard to integrate exactly because it is custom, and doesn’t always follow the formats required by your favorite reporting tools. This can make reporting much less insightful.
With Segment, you can translate your custom attribution data and taxonomy into a format that’s understood by a data warehouse such as BigQuery. From there, you can easily send it to a reporting tool such as Chartio or PopSQL. Think data such as page and identity tables, the common attribution data points. You’ll be on your way to a closed reporting loop, with accurate and complete ROAS insights.
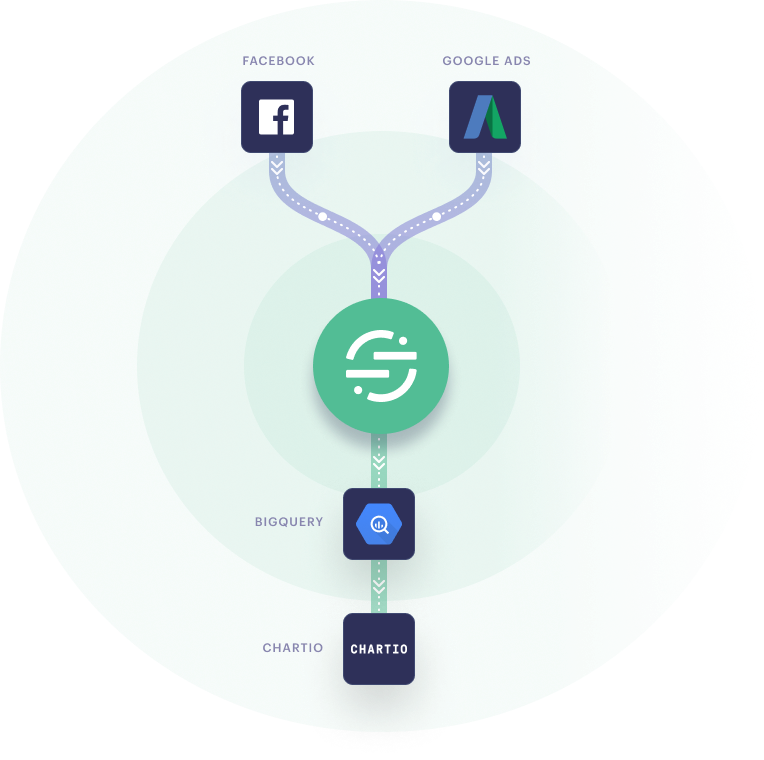
Just like with the above-mentioned ability to translate custom javascript to the rest of your MarTech stack, Segment plays the Rosettta Stone of APIs for your ad platforms. Segment will pull data from Facebook Ads, Google Ads, and other ad marketplaces, then push it into your BigQuery data warehouse. You’ll be able to get the full picture of how the different ads push the customers down the funnel, and you can also add data about interactions such as checkout events.
As a result, you’ll be able to send complete acquisition data into a reporting tool such as Chartio or PopSQL. There, you can, for example, build models for calculating key metrics such as CAC (Customer Acquisition Cost).
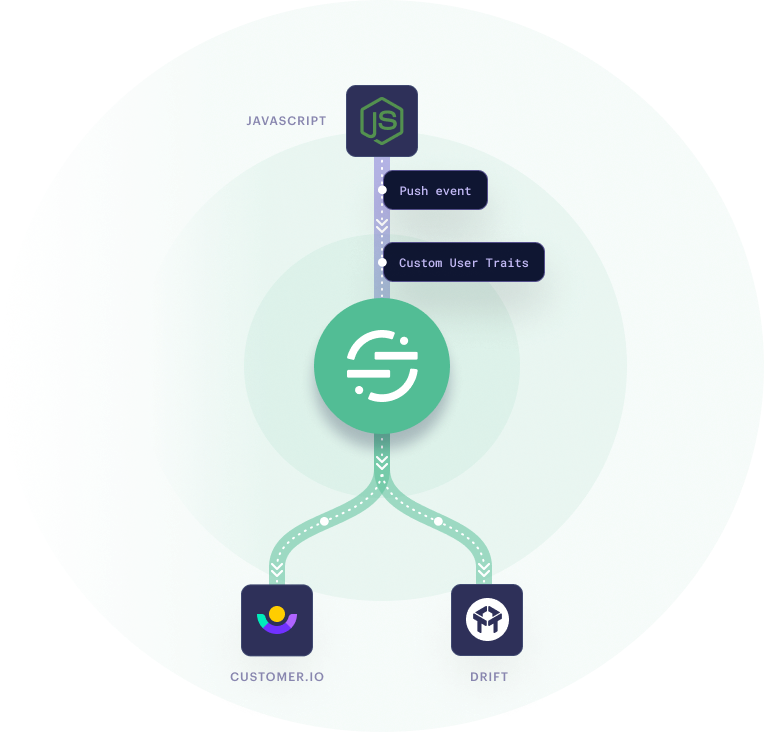
In MarTech stacks based on Segment, you can have the same tool receive or send data. Customer.io is an example. Above, we had an example of Customer.io sitting upstream, so it could send data for use in customer journey analytics. Here, Customer.io sits downstream, receiving data from a javascript source.
Segment can even send your JS data to multiple communication platforms at a time. So e.g. Customer.io for emails and Drift for chat and text messages. This way, all of your messaging can be both custom and automated based on events or custom user traits. User events like shopping cart abandonment, newsletters signups, and purchases can help segment the customers. You’ll be able to automatically trigger personalized email sends, push notifications, or SMS messages. Or you’ll be able to make your chat bot much more personal and useful.
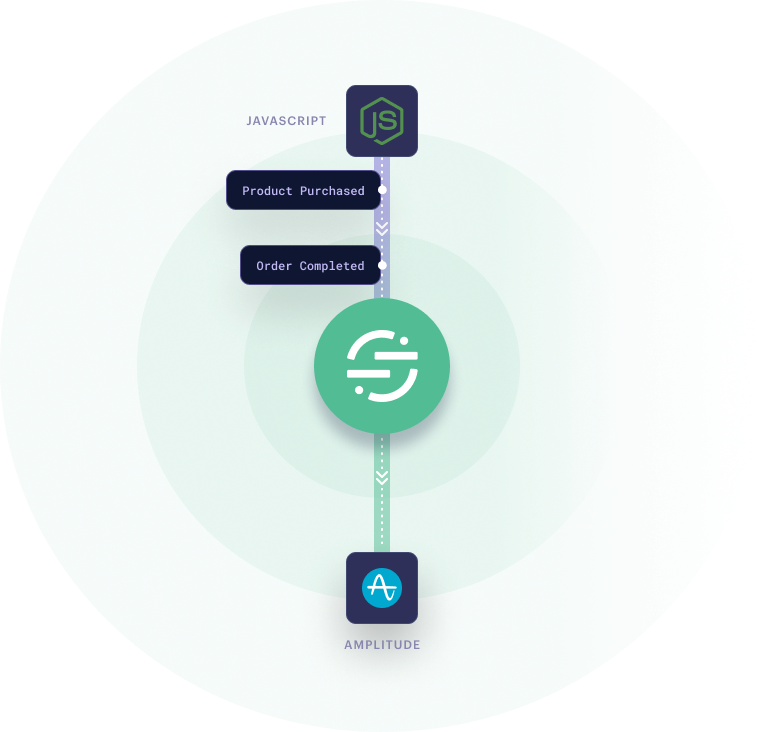
Amplitude is a popular analytics platform that's grown in popularity thanks to its depth, predictive and personalization capabilities, and automated optimization features. When enriched with clean, normalized data, users can optimize across the entire customer journey, improve user acquisition, uncover purchase behavior patterns, and connect product-level data with revenue.
However, imagine your user data is tied up in a JS source such as Google Analytics. So we’ll once again connect Segment and have it feed data into Amplitude. This links Order Completed, an event from Segment’s ecommerce spec, with the Product Purchased event in Amplitude. You could also do that for events such as Product Viewed, or Added to Cart. You’ll then be able to slice revenue data by product, product category, or SKU.
The diagrams you see above come from our infographic with examples and explanations of ecommerce stacks integrated through Segment. Get your own pdf below for future use, so you can quickly scan it and remind yourself of ideas for your own stack.
Download your copy of the ecommerce stack infographic.
Segment's Startup Program is here to give early-stage startups the tools necessary to build stacks like this and thrive. Eligible startups get $25k in Segment credits for up to two years, which can be used for Segment’s Team Plan. Additionally, Segment is throwing in over $1 million in free marketing and analytics platforms like Amplitude and Amazon Web Services, on top of a number of heavy software discounts. You’ll even get access to level-up resources such as Segment’s Analytics Academy or Analytics office hours.
Eligible startups must have been incorporated less than two years ago and have raised no greater than $5 million in total funding.
Don’t wait any longer, go learn more about Segment’s one-of-a-kind Startup Program. And if you’d like a hand picking your tools along the way, feel free to use our WYSIWYG MarTech stack builder.
Dan McGaw is the founder of McGaw.io, MarTech speaker, and co-founder of analytics tools such as UTM.io. He’s worked extensively with Segment implementations and led the creation of tools such as the Segment CSV importer.

Our annual look at how attitudes, preferences, and experiences with personalization have evolved over the past year.