How Norrøna built a recommendation engine that increased conversions by 50%
By Thomas Gariel
Recommendation engines are a key ingredient of e-commerce today. Pioneered by the likes of Amazon and Netflix (who went so far as to offer $1 million dollars to anyone who could improve their engine by 10%), the ability to predict a customer’s needs, and provide proactive recommendations based on this understanding, is reshaping how businesses interact with their customers.
Many of us use these recommendation engines every day, but how do you actually go about building one?
Recommendation engines have traditionally required running complex data infrastructure to collect and centralize data across sources, and large in-house data science teams to train and build these models.
This wasn’t the case for the team at Norrøna, who built a complete recommendation platform, from data collection to serving machine learning predictions, in just six months. In this article, Thomas Gariel, Product Manager at Norrøna, shows us how recommendation engines are very much in reach, both for digital-first companies and bricks and mortar businesses alike.
As the leading brand of outdoor clothing in Scandinavia for more than 90 years, Norrøna is worlds away from being your traditional data science company. For most of that time, we’ve primarily been a wholesale business. As such, we had very little relationship with our end users.
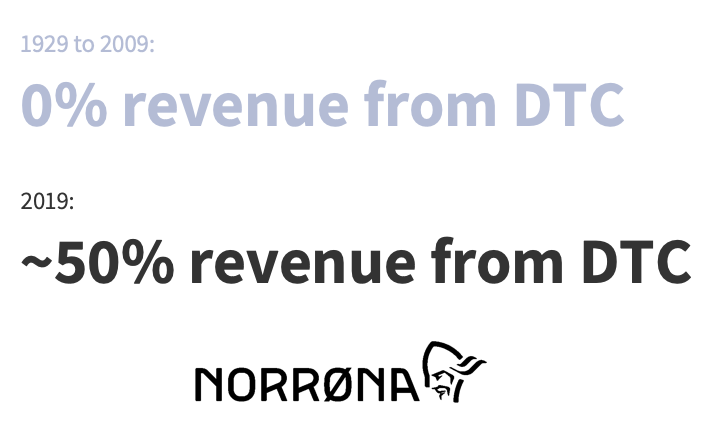
That all changed in 2009 when we opened our flagship retail store in Oslo and launched our e-commerce store. Since then, we’ve gone from no customer-facing stores or online shop in 2009 to 22+ physical stores generating approximately 50% revenue from direct-to-consumer in 2019.
In a short space of time, we had to transition our business entirely. After decades of selling to thousands of wholesalers, we had to learn how to connect with millions of customers.
Now, our company has started to tackle the most critical challenge we’ve had in the past ten years: transitioning from a wholesale business to a direct to consumer one.
The first challenge we had to make for our recommendation engine was the age-old “build vs. buy” question. Since the beginning, our mission has been to produce high-end, performance-driven products. To accomplish that mission, it’s critical we focus on the integrity, innovation and, above all, the technical function of our products.
We are also proudly self-sufficient. From concept to creation, our in-house team of designers and craftsmen build everything themselves. We are one of the few brands that have internal R&D and prototype and material testing in our HQ. We believe that if we internalize critical parts of the value chain, we will achieve the highest level of quality.
Our rationale was: If we’ve always done things ourselves for our physical products, why not try to do the same for our digital ones?
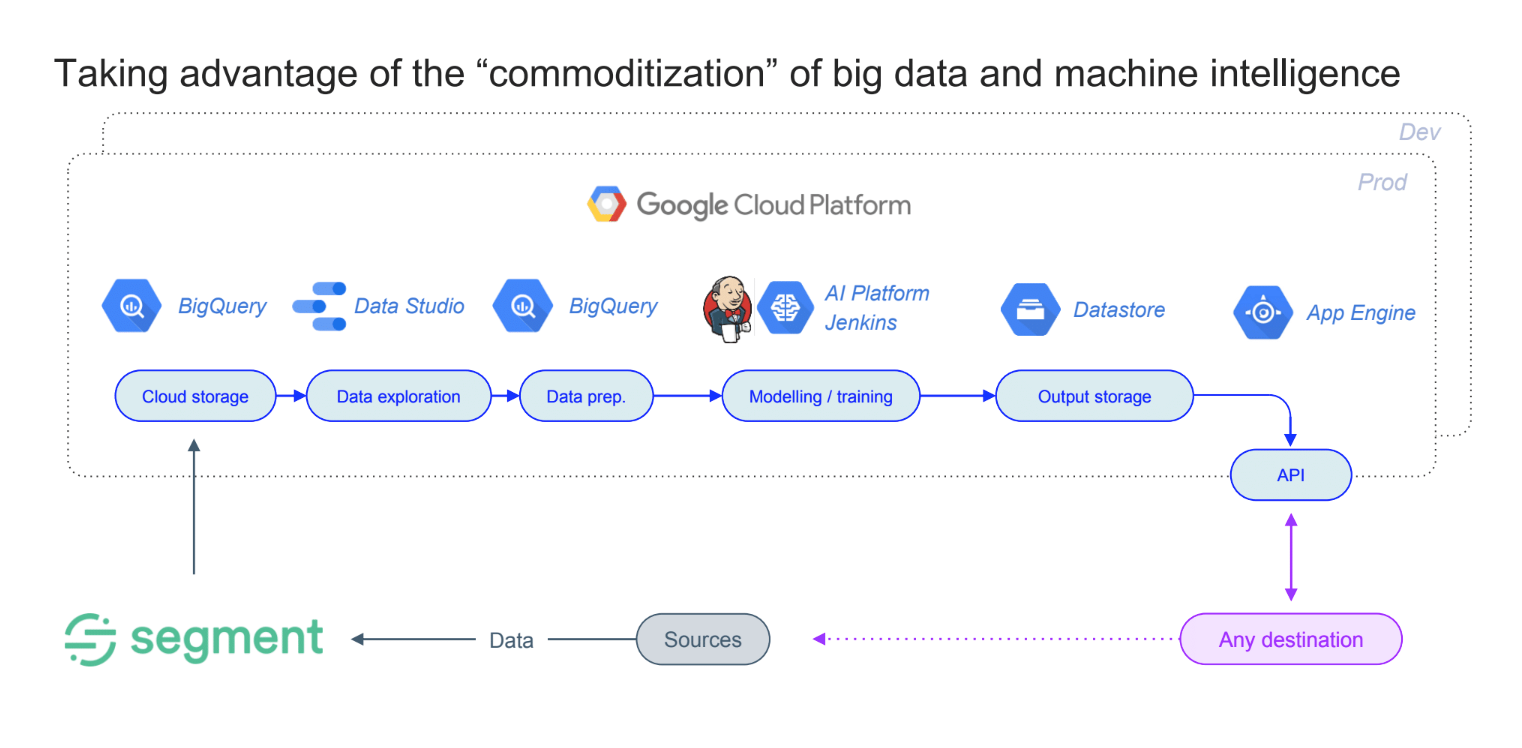
Thankfully, this has been made easier by the global commoditization of technology both on the customer data side and on the machine intelligence side.
In the same way that software like Squarespace has allowed millions of people to build, design, and host websites without needing a developer, tools like Segment have allowed us to solve common customer data infrastructure problems without the need for a large and expensive staff.
This led us to the decision to build our own recommendation engine using Segment as our customer data platform and then to utilize the machine intelligence tools available on the Google Cloud Platform.
We have a very small team working on data at Norrøna. Since our resources are limited, it’s important technology is easy to use and can be adopted without significant engineering resources
That’s where Segment came in.
Norrøna uses Segment for data collection and master data management. We use it for out-of-the-box and close-enough-to-real-time tracking of user interaction, both client-side and server-side. Segment then assigns an ID, either identifiable or anonymous depending on GDPR consent, to each customer.
Collecting all this customer data consistently using a standard schema couldn’t be easier with Segment. Sending super clean data and storing it in a cloud instance is accessible at the flip of a switch. Since a recommendation engine is only as good as the data behind it, this step was key.
With our clean datasets in place, we were ready to layer intelligence on top of it. We chose the Google Cloud Platform (GCP), which has all the essential building blocks for developing and deploying a scalable machine learning platform in the cloud.
GCP has a large ecosystem of clean, relatively intuitive tools that are easy to use, even for non-tech people. It’s all based around the concept of modularity, providing people with ready-made “bricks” that you can use to get up and running in no time.
To achieve a good compromise between speed, simplicity, cost control, and accuracy, we used Big Query for storage, Data Studio to separate that data and Jenkins and App Engine to power that data.
Additionally, we used BigQuery to store consumer data in the cloud. For simplicity’s sake, we used the pre-existing components that would deliver the most impact with the least effort possible.
Every season Norrøna has the challenge of helping users navigate 350 new products across 18 different collections. Since some of our products are quite specific, it can be hard for customers to find the perfect product for their needs.
For example, we have a ski touring collection. We have a backcountry skiing collection. We have an urban skiing collection. For a new user, it’s not always easy to understand the function of each product and each collection. To help fix this, we wanted to build a system that would be able, given one product in our inventory, to calculate the proximity to every other product in our inventory.
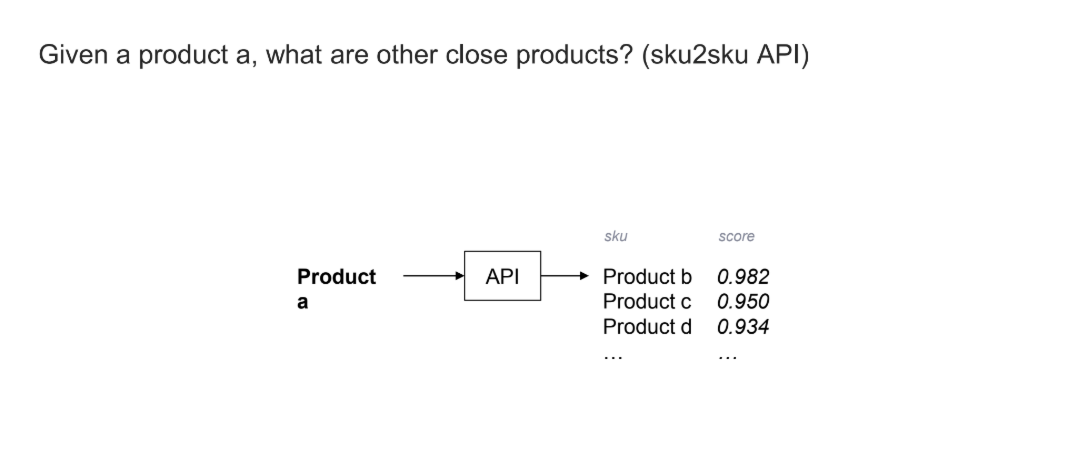
So, if I input the product "A" into an API, the system can retrieve every single product in our catalog and approximately score for each of those products.
Going back to our pipeline, we had the assumption that some events from the e-commerce library in Segment would be a good proxy for calculating product proximity – product, clicked, product added to cart, product added to wish list and other completed actions.
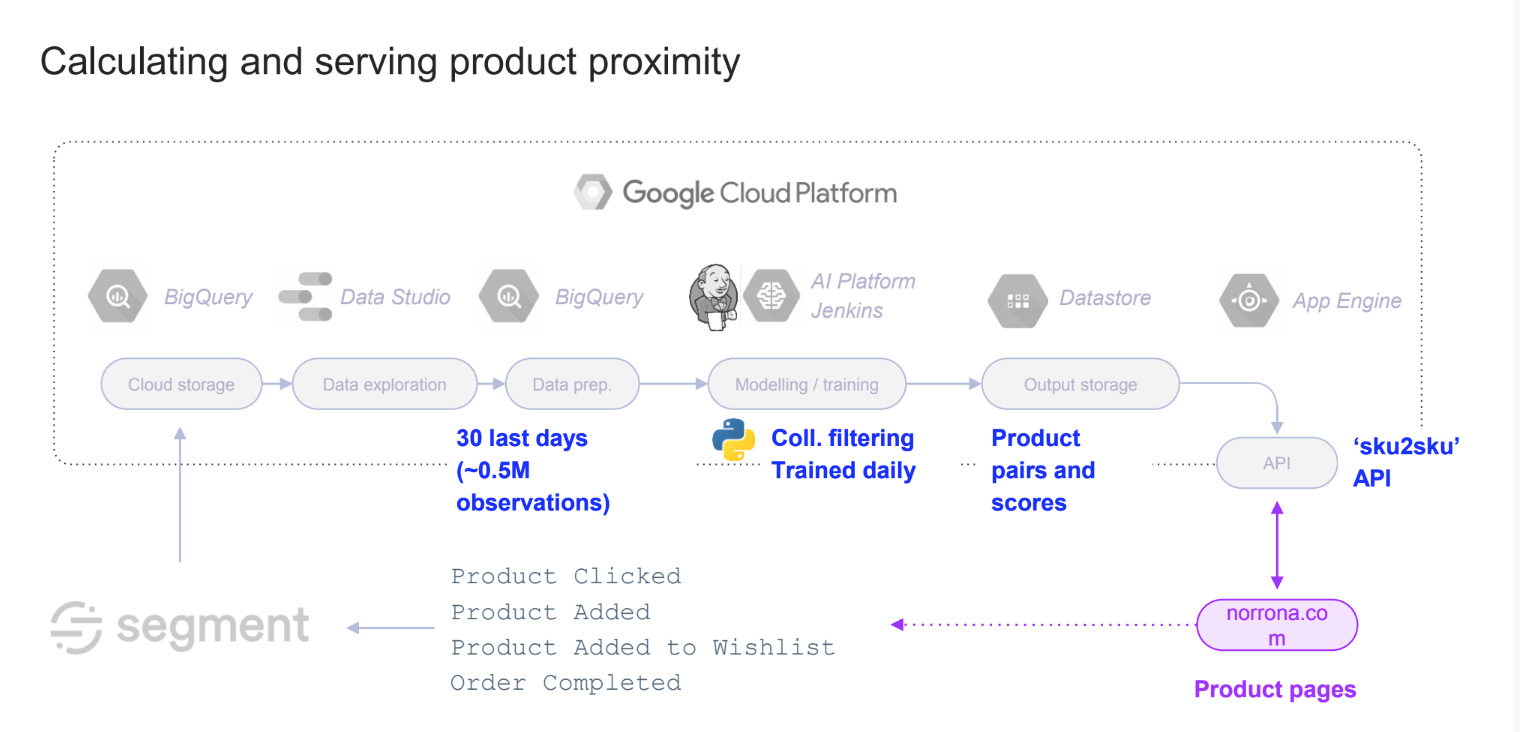
The idea we landed on was pretty simple – collaborative filtering.
Collaborative filtering works by making a series of automatic predictions for one user (filtering) by looking at the preferences of many users (collaborating) and combining them into a ranked list of suggestions. Basically, if someone is “like” you in his or her browsing pattern, we recommend the items he/she has viewed that you have not.
We take certain events from Segment (Product Clicked, Product Added, Product Added to Wishlist) and then load it into BigQuery with the past 30 days of data. (For us, that's approximately half a million observations.) Then every day, the algorithm outputs a list of every possible pair in our catalog with a proximity score associated with those pairs, which then we expose through an API on each product page on norrøna.com.
This led to a significant improvement in how people discovered new products at Norrøna.
Up until this point, we had assumed that to help people navigate our products and our collections, putting complimentary products close to the main product was the best strategy. So, if I have a jacket, putting trousers, a base layer or a mid-layer would maximize the ability of people to discover other products.
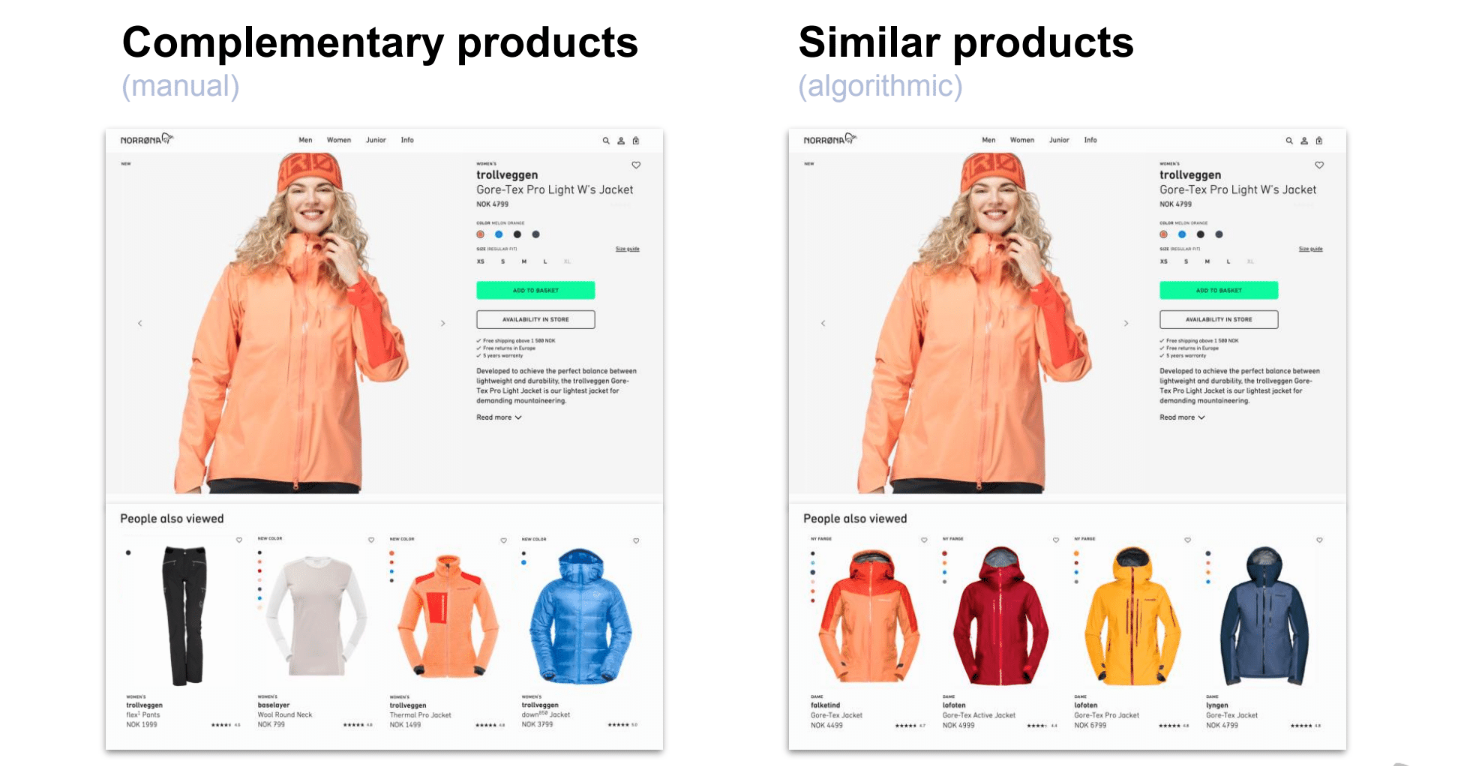
This was all done manually. Each season, our e-commerce manager manually added a series of complementary products for each new product on our website. It was a huge time sink.
By using Segment and BigQuery, we could replace this manual work by taking the output of the algorithm and filtering it on specific products. What we found was that the algorithm was systematically recommending similar products, not complementary products that we had been selling for a couple of years.
Saving us a lot of manual overhead was positive in its own right, but what was more important was uncovering which system of recommendations had the most revenue impact.
So, we A/B tested both product pages and directed 50% of the traffic to version "A", and 50% to version "B".
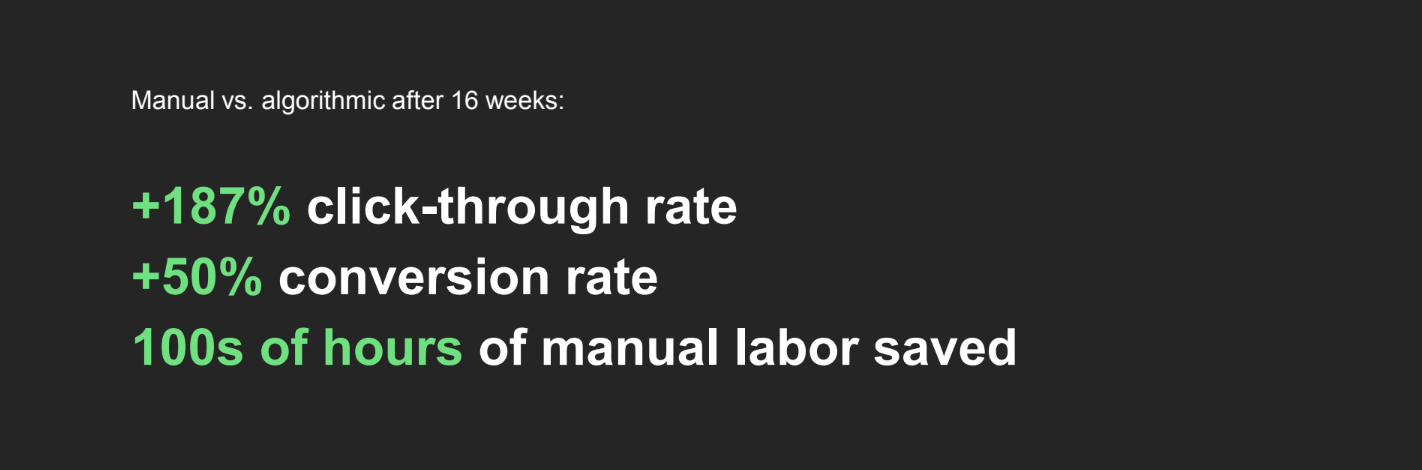
The results were incredible. The algorithm recommendations beat the manual recommendations across the board.
Our recommendation engine was designed to solve one specific business challenge. But the beauty of the pipeline is that it is generic enough to fit a large number of these business challenges. With the infrastructure“backbone” in place, we’re using the recommendation engine to uncover all sorts of interesting new insights.
For example, as we thought more about it, the algorithmic output of product pairs and associated scores and scores is basically like a graph. The products are the nodes of the graph, and the scores are the edges of the graph. So we thought it would be fun if we could visualize the different relationships within our entire catalog as a graphical visualization using Gephi.
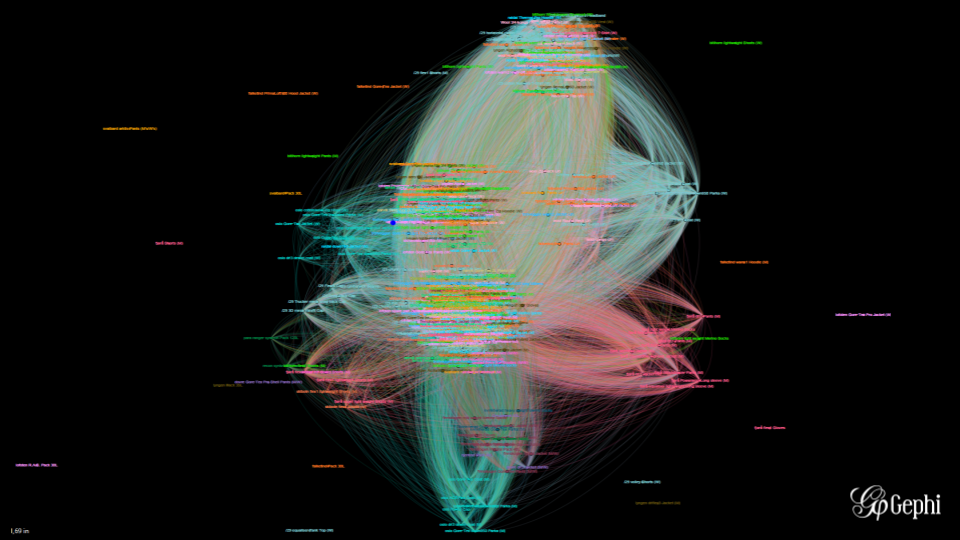
This helped us find some interesting insights in our product catalog that may otherwise have remained hidden. For example, we found three big red clusters in the middle – our skiing products. This showed us that when it comes to choosing your skiing products, people don’t care for the existing way we were recommending products. They browsed house collections (i.e matching trousers, jackets, etc.) and were looking for similar products within those collections.
On the other hand, when it comes to lifestyle products, we saw a blue cluster on the side. People who are interested in those products tend to stay within that cluster and browse only the lifestyle collection. So someone interested in a flannel shirt might also be interested in a hat or a jacket from the lifestyle range.
All these patterns and interdependencies became much more clear once we started visualizing the data, and it had the added upside of helping us communicate results to stakeholders in a simple to understand way.
The immediate, short-term, machine learning use cases have been strongly e-commerce focused, but we foresee that future use cases will be found in areas like product development, sustainability, demand prediction, and logistics. Now that we’ve seen just what’s possible with Segment and Google Cloud (and how easy it is) the ways in which we can use our recommendation system are only up to our imagination.

Our annual look at how attitudes, preferences, and experiences with personalization have evolved over the past year.