How Tray.io Built A Customer Retention Model That Scales With Twilio Segment
Tray.io uses Segment to calculate a user score that predicts retention. Here's how they built it.
By Geoffrey Keating
Tray.io uses Segment to calculate a user score that predicts retention. Here's how they built it.
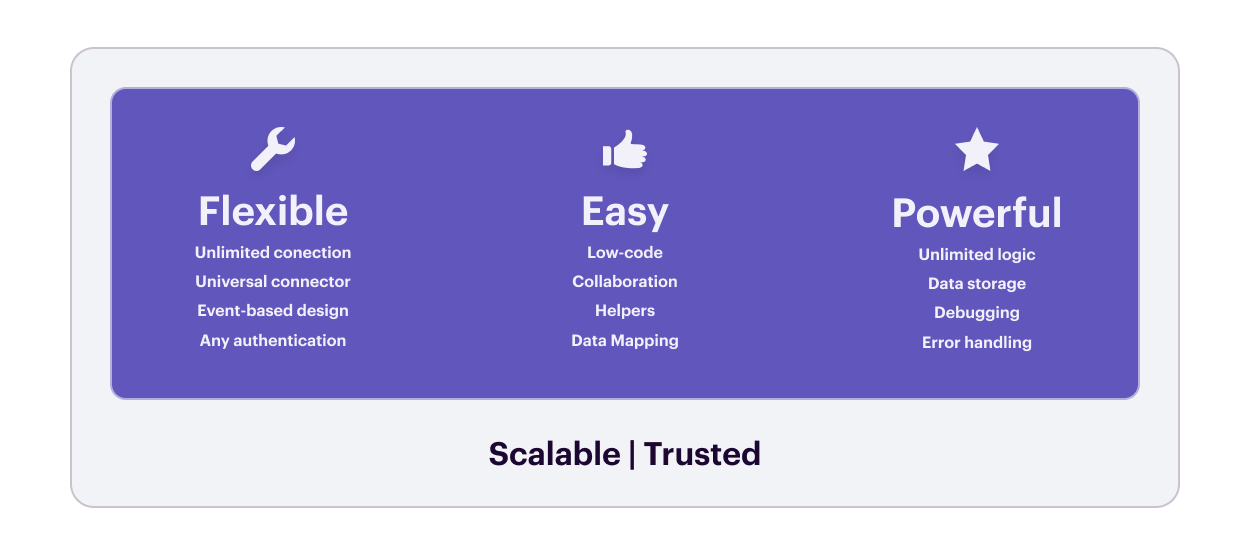
Tray.io is a general automation platform that lets you build and streamline automated processes for hundreds of popular applications using its visual workflow editor. The startup ranks 33rd in last year's list of the 1,000 fastest growing SaaS companies and caters to organizations including FICO, GitHub, Typeform, Eventbrite, and Udemy.
Tray.io needed a way to measure, predict, and expand user retention to keep up its impressive growth. Bella Renney, Head of Product at Tray.io, decided to address this issue by building a customer retention model using customer data they collected using Segment.
As Tray.io went into hyper-growth mode, they faced a three-dimensional challenge to scale their number of engaged—and ultimately retained—users. The team at Tray.io needed to identify the metrics that matter for retention, collect data from many touchpoints across the user journey, and do all that for multiple user personas.
Bella and her team pondered questions that’ll sound familiar to any startup that's scaling:
What makes for a retained, engaged, and happy user who’s getting value from our product and tells others about it?
How can we reverse-engineer the behavior of our most engaged users and apply it to new users?
How many user personas should we define and go after?
How do we encapsulate the answers to all these questions in a few key metrics?
How can we make data and reports available across the organization and tailored to each department?
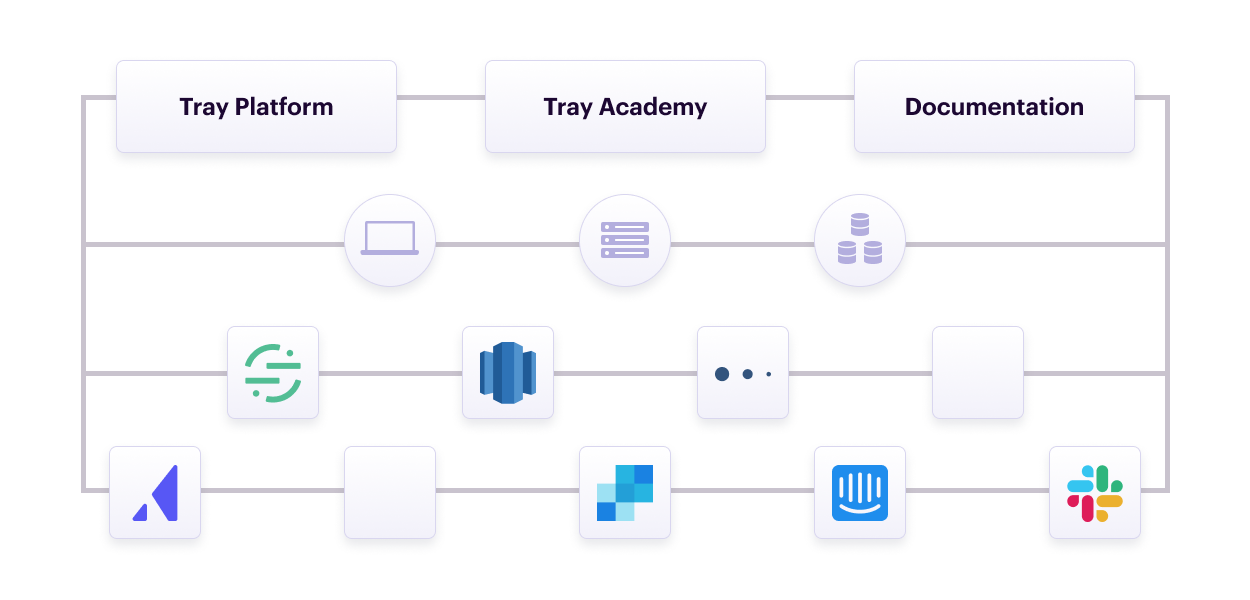
Tray.io turned to Segment to centralize customer data from many sources like its product, its online educational platform Tray Academy, and its documentation hub. Segment allowed them to standardize this data and create a single view of each customer, which could feed into downstream tools like Mixpanel to build reports.
With their data unified and available in Mixpanel, a product analytics tool, Bella and her team started looking for the metrics that define an engaged and valuable user. Finding these indicators was an iterative process spanning several months, which unearthed insightful data points unique to Tray.io's product and customers.
One of Bella's examples is what she calls "impersonation." Someone from Tray.io takes control of a user's session to help when they're stuck and builds a workflow for them.
While this sounds like (and is) excellent customer service, Bella's team found that less impersonation for an account meant a reduced risk of that user churning. "If a customer only builds 20% of the time that they're actually in the platform, and the other 80% is actually someone impersonating on their behalf, they're much more at risk."
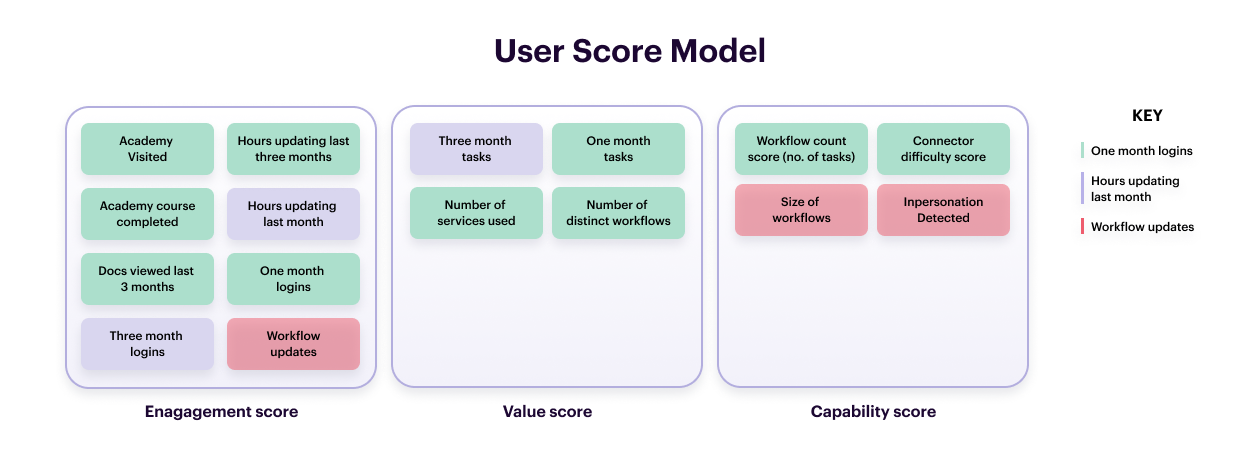
Using the data Segment makes available in Mixpanel, Bella and her team designed a user scoring model computed with the unique retention signals they uncovered. Each Tray.io customer is assigned a score that predicts their retention derived from three sub-scores:
Engagement looks at specific actions, like whether users visited the Academy and completed courses there and how often they log in and make updates.
Value primarily looks at the number of third-party services a customer connects and uses through the Tray.io platform and how many workflows they've built.
Capability includes impersonation and other data like the size of people's workflows that indicate how proficient a user is with the Tray.io platform.
A high score means a user is more likely to retain as a Tray.io customer. A low score means they're at risk of churning—which obviously requires countermeasures. But the team at Tray.io also uses the high score to identify ambassadors for their product, suitable subjects for success stories, and candidates for other marketing initiatives.
Tray.io can also share the user score and other underlying data across the organization. Mixpanel enables visual reports of the data that can be further segmented and customized depending on the recipient. Someone in Product, for example, will want a different view than an executive. For almost every dashboard and report that Segment data powers in Mixpanel, "you're able to slice and dice this information exactly how you want to."
Because all data is centralized through Segment and updated in real-time, it's straightforward to use the same information in other apps—without help from engineers. Say, if the marketing team wants to send a personalized campaign to customers with a high score from their email marketing tool.
Tray.io set a target to increase engagement by 20% for all its users. Not just new users or existing ones with low scores, but everyone, including power users.
"The more engaged users of an account are, and the data showed this in terms of predictability, the more likely they are to renew their use of Tray and the less likely they are to churn as a customer."
Tray.io is well on its way to achieving its ambitious goal through the user score and dashboards they've set up using Segment and Mixpanel. But it's an ongoing journey.
Bella advises to "not think of it as something that you're going to achieve in any kind of given time period, but actually that it's a different way of thinking about the way that you measure product analytics at your company... It's about sort of feeding that way of thinking through into everything that you do and collaborating with a lot more people in terms of bringing that thought process out into the wider world."
Segment enables this journey because it makes your customer data stack flexible and modular, so you can easily make changes as your insights and models evolve.

Our annual look at how attitudes, preferences, and experiences with personalization have evolved over the past year.