Measuring the ROI of Support
By Jake Peterson
As Head of Customer Success, I wonder whether we should continue to offer support on our free tier because it’s been hard to nail down the costs and benefits. Adding support as a feature is becoming more popular in the SaaS industury. For example, Optimizely recently switched to two plans, and you only get email support as an enterprise customer. My concern is: what if we’re spending too much time supporting very small customers, and it is prohibitively costly to the business?
Beyond free support, I also consider: How efficient is our team? Are we hiring quickly enough or maybe too fast? How can we make the support experience so magical that customers use Segment more and recommend us?
Answering these questions has been difficult, since the data sets required to do these analyses have been siloed within tools. Most of the data I needed to analyze is in Zendesk. Billing and plan data is in Stripe and product usage is in Segment. Now, with Segment Sources, I can tie all of those records into one data warehouse. Using data, instead of our collective intuition, to make better decisions faster feels good.
In this post, I’ll outline my major questions about our success team at Segment and the queries I used to investigate them. We used BIME Analytics since they have a number of out-of-the-box dashboards for Zendesk. I’ve included links to queries were appropriate!
Kindly note that, we replaced the number values in these charts with fake data, but the trends and percentages we saw are real. We hope you can take this as a starting point for your own analysis! Many thanks to analysts Will and Perry on our team for helping me with some of the queries!
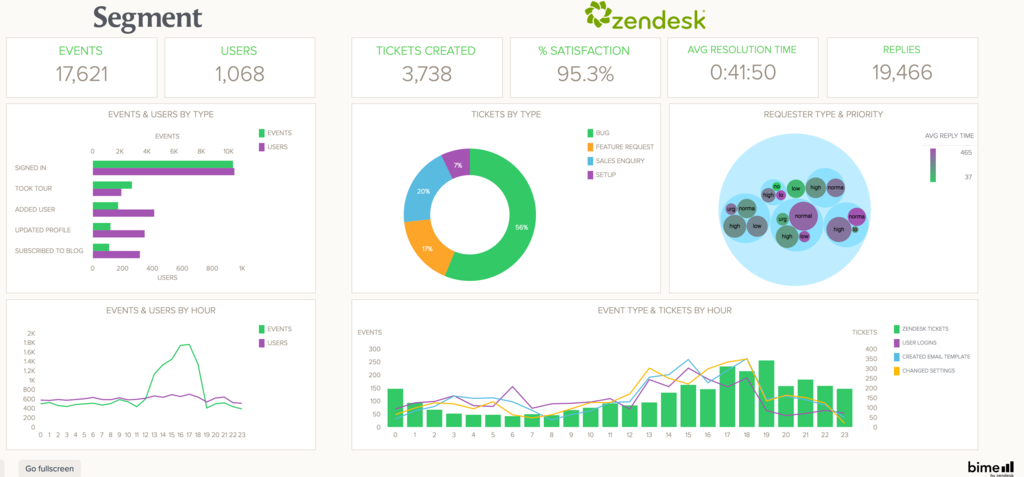
Here is a fictitious Zendesk dashboard created with BIME Analytics.
To begin my analysis I split our customer base in two cohorts: those who have created a ticket with our Success team and those who haven’t (related queries can be found here). I wanted to see what the differences were between these groups.
Since API usage, or how much data people send through Segment, is a good proxy for the value our customers get from our product, I took a look at the average monthly API calls are for both cohorts.
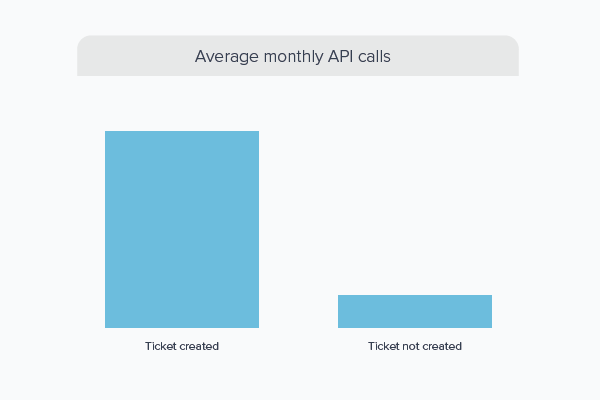
Customers who have talked to support on average send more than 10x more data to us than customers who don’t. Though in this initial analysis, there are many inactive accounts that are skewing the results.
To make this analysis more actionable, we looked at “active” customers (accounts sending more than 500 API calls per month). Here, the gap is smaller but still significant. This isn’t surprising, since we’ve removed a non-trivial sample of accounts that don’t send much data.
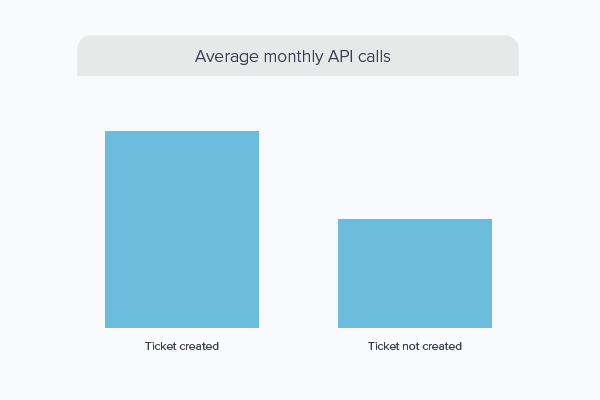
Though we should be mindful that this correlation does not imply causation, these queries show that active accounts use Segment twice as much when they also have engaged with our success team.
Activation in the form of API calls is certainly important, but we also want to know if working with customers to get set up correctly means that they will get enough value to upgrade to a paid service plan.
If users typically use Segment more after talking to support, do they also upgrade and pay more?
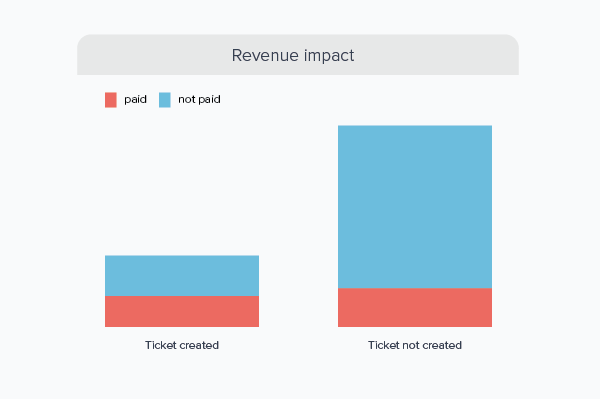
Forty-two percent of users who have talked to our success team converted to paying (starting a subscription at any billing plan). Conversely, users who have not talked to our success team converted at a lower rate of 22%.
It’s certainly encouraging to see that our success team has a positive revenue impact, as this result complements the increased API usage analysis of the previous section.
To further confirm success’s contribution to our bottom line, we’d need to do some more exploratory analysis. For example, looking at a handful of accounts in each of those cohorts, seeing what tickets they’ve written in, and learning when/why they upgrade to a paid account. Then, we can work to repeat that with other customers.
Since our product is highly technical, our amazing success team does not come cheap. Most of them are engineers! Understanding support costs helps us in two ways: 1. knowing how better to allocate our success resources and 2. building a hiring plan.
By combining the total cost of our success team (salaries + benefits + tools our team uses) and the data afforded by the zendesk.ticket_metrics table (tickets, replies, resolution times), we can calculate the:
cost per ticket
cost per reply, and
cost per “day when a ticket remains open”.
To keep things simple, our analysis is only going to focus on the cost per ticket and for January 2016.
The total cost of success for that month is $58,333 (the sum of all annualized salaries and tools expenses divided by 12) and we had a total of 1,380 tickets. The cost per ticket is $42.27.
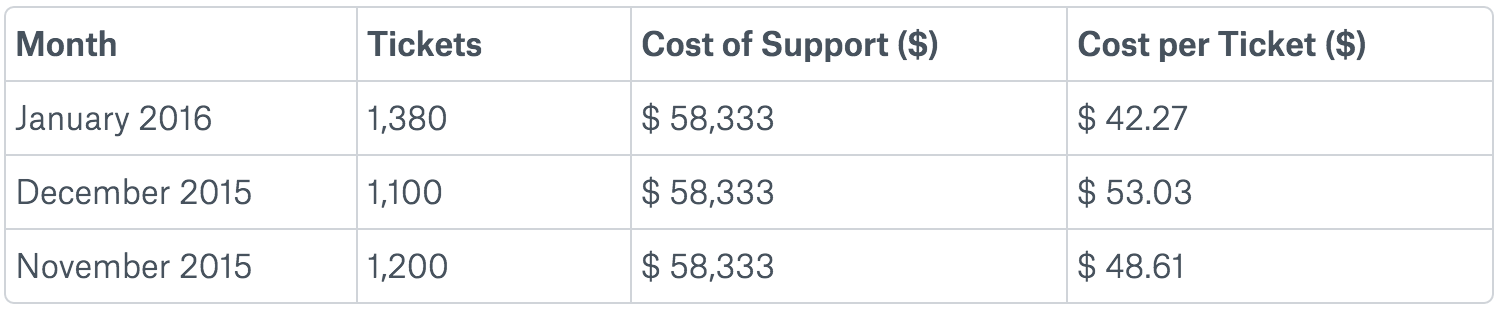
This means that if we theoretically charge our users more than $42.27 to create a ticket with our success team, then we would be covering all of our costs. But who really does that anyway? (Don’t worry, we won’t—karma is one of our values 😃.)
However, this cost does help us figure out how to best allocate our resources. If our customers and ticket volumes grow too quickly, then we would need to find ways to allocate our success resources to alleviate ticket strain. Some obvious methods would be creating help articles or a Stack Overflow-esque communitywhere users can answer other users’ questions (which we’re working on!). Other options would be to sell à la carte premium support, where there are contractual SLAs and maybe even direct phone support. A strong understanding of support costs can help guide the decision around approaching any of those options.
While the squeaky wheel gets the grease, we may be missing the larger picture when it comes to prioritizing our road map. For example, one customer might keep asking us for a specific feature, but that might align with our overall product strategy or other customers’ requests.
We found that layering on the LTV of customers who request features, in addition to the total number of requests for a particular fix or feature, helps us make sure we’re prioritizing the most impactful projects for the product team. While we ultimately don’t want to transform our company into a dedicated dev shop for our highest paying enterprise customers (or grant them full control over our product vision), incorporating LTV and number of requests can be a helpful proxy for demand of smaller features.
This analysis can be done by querying Zendesk tickets table, generating a cohort of customers who have asked for a specific feature, adding their billing plan, and then calculating the LTV. The LTV would then be value associated with the product request.
We frequently get integration requests via Zendesk that follow a pattern in the zendesk.ticket.subject: “Requesting integration for “ via our contact page.
We can count the number of discrete integration requests, as well as sum the LTV of all users who submitted requests in SQL using the Zendesk source:
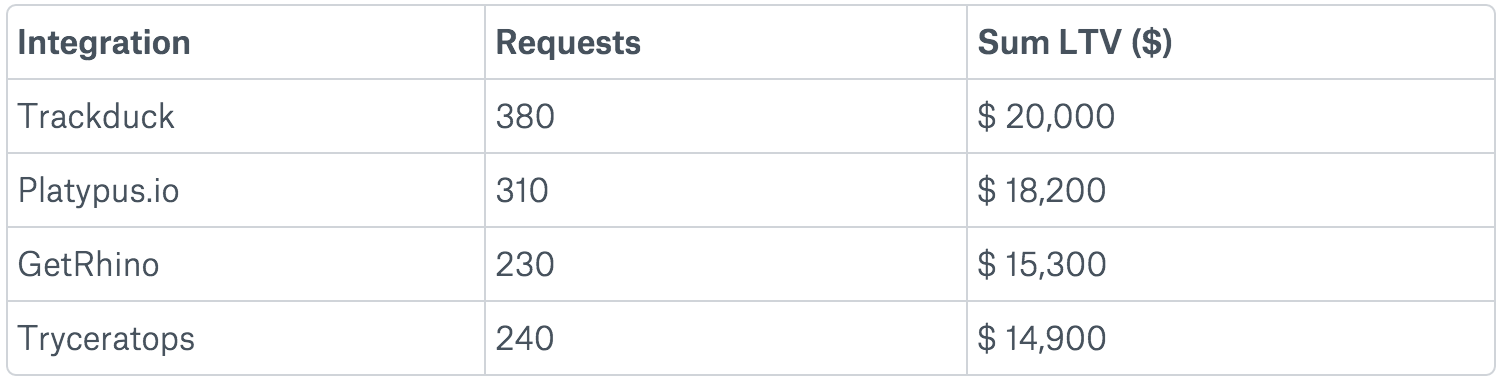
This gives us a strong idea of how much each new integration is worth. The cost of developer resources to onboard or build the integration and time can be weighed against the LTV of the cohort who has requested the integration.
Planning for hiring is part art and part science. The most important key to our hiring is making sure we have enough success engineers for “product coverage”.
The idea of “product coverage” is based on ensuring that our customers who write into our success team will get a response within a reasonable timeframe. Given historic data, we can assume that an individual success engineer can, on average, close 10 tickets per day or 200 tickets per month (given 20 business days).
If there are not enough success engineers to answer tickets, then the average ticket resolution time will creep up. The prevailing equation here is:
Then, we can monitor “Tickets Per Product Per Month” for different productsover time to see if the average number of tickets grows too much to become unmanageable by our success team. This would be an early indicator of needing to hire a new success engineer.
In this example, we look at January 2016 and include enterprise as its own “product”, since the SLA demands a higher threshold for coverage.
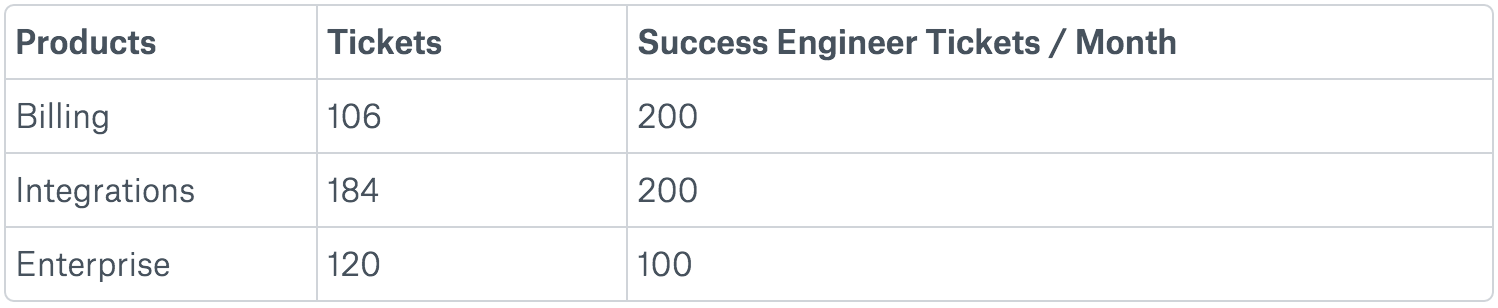
We see here that in January, the number of enterprise tickets surpassed the required “coverage” by the success engineers. We dug into this number to make sure the reason is genuinely increased support demand from that segment (other reasons tickets could surge include broken product, confused customers, etc.). After looking through the tickets, talking to our success engineers, and confirming with other metrics (new enterprise contracts closed), it turns out we need to hire more!
Another benefit of splitting ticket coverage by product is that we now have the option of hiring specialized success engineers, focused on supporting a specific product. Since our enterprise customers have grown faster than we anticipated, we’re now looking specifically for Implementation Engineers, who are similar to success engineers, but dedicated to working with our enterprise customers.
Nowadays, customer service teams can be the reason why you win an enterprise contract over your competitor or why your users buy clothes from your store. Having Zendesk, Stripe, and Segment data available to analyze in Redshift not only helps us make decisions faster and with more confidence, but also be more disciplined about launching experiments.
Hopefully, this post inspired you to ask similar questions about your support team. Keep in mind that the queries and results alone aren’t everything! Be sure to take the time to read through a sample of the tickets to confirm any hypotheses the results are suggesting. Many times there could be an unexpected lurking reason that may skew the data in unexpected ways.
Lastly, there are many intangible benefits a success team can provide that can’t really (yet) be quantified. These benefits can build defensible brand equity and leave lasting impressions on customers. Some of these include customer referrals, which can drive down customer acquisition costs, or the reputation of having a personalized, consultative success team, which can help close enterprise deals.
Unite your data today or learn more at our upcoming webinar.

Our annual look at how attitudes, preferences, and experiences with personalization have evolved over the past year.