PagerDuty's Stack for Optimizing Onboarding
At PagerDuty, reliability is our bread and butter, and that starts with the first time users interact with our platform: our trial onboarding.
(For a little background on us, PagerDuty is an operations performance platform that helps companies get visibility, reliable alerts, and faster incident resolution times.)
We’d heard from customers that our service was simple to set up and get started, but we also knew there was room for improvement. Users would sometimes finish their trials without seeing all of our features or wouldn’t finish setting up their accounts, which caused them to miss a few alerts. We wanted to help all of our customers reach success, and we knew if we did this well, we’d also boost our trial-to-paid conversion rate.
We talked to our customers, support team, and UX team before diving into the onboarding redesign, but we also wanted to complement their qualitative feedback with quantitative data. We wanted to use telemetry (automatic measurement and transmission of data) to understand exactly what users were doing in our product, and where they were getting blocked, so we could deliver an even better first experience.
Before we started making changes, we needed to establish a baseline: how were users moving through the app? Did their paths match our expectations? Did the paths match the onboarding flow we were trying to push them through?
After researching the user analytics space, we found Mixpanel and Kissmetricshad the best on-paper fit to answering these types of questions. However, the investment (in both money and implementation time) to adopt these kinds of tool was significant — so much that we wanted to test both to make sure we picked the right tool. But, the only way to comprehensively test tools like this is to run them against live data.
That’s where Segment came in. We were excited to find a tool that let us make a single tracking call and view the data, simultaneously, in multiple downstream tools. Segment made it easy to test both platforms at the same time, and with more departments looking at additional analytics tools, the prospect of fast integrations in the future also excited us.
We used our questions about user flow and conversion funnels to test if Kissmetrics and Mixpanel could help us understand the current state of affairs. Using Segment, we tracked every page in our web app and as many events as we could think of (excluding a few super-high-volume events such as incident triggering). Then our UX, Product, and Product Marketing teams dove into the tools to evaluate how well they could answer our usage questions.
After spending a few weeks with both tools, we went with Kissmetrics. To be honest, they’re both great, but we liked the funnel calculations in Kissmetrics a bit more. They also offered multiple methods for side-loading and backloading out-of-band data like sales touches, so Kiss was the winner.
Throughout this process, we also learned that we should have tracked far fewer events. If we were to do it again, we’d only collect events that signaled a very important user behavior and that contributed to our metrics for this project. It gets noisy when you track too many events.
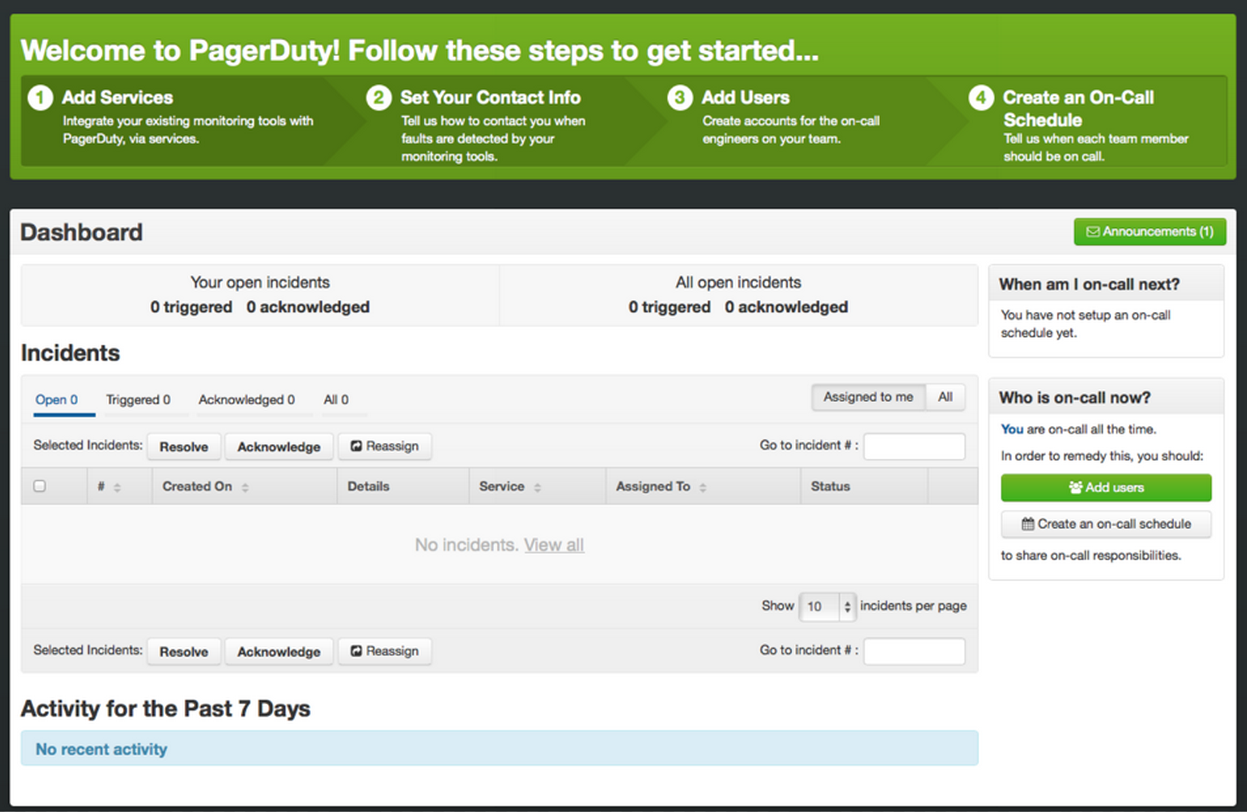
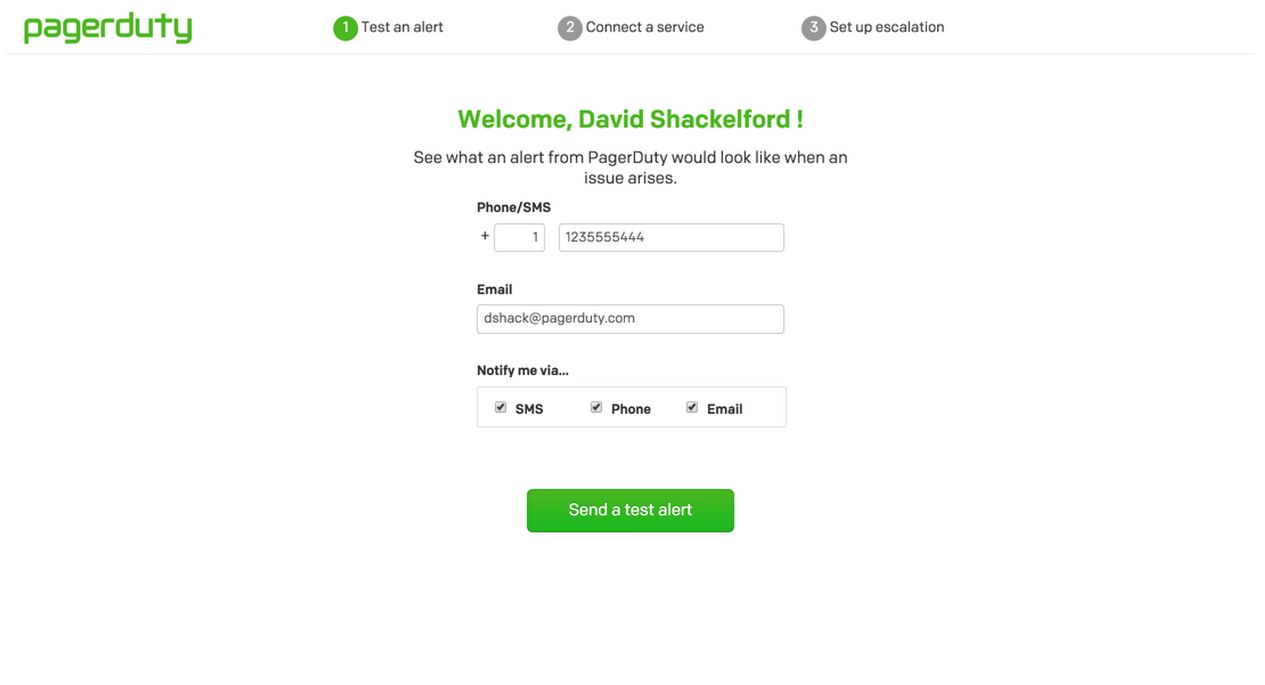
After combing through the data, our user experience team had a lot of ideas to develop a new onboarding flow. We mocked up several approaches and vetted them against both customers and people inside the company. Then, we tried out the design we thought would best communicate our value proposition and help customers get set up quickly. Our approach included both a full-page takeover right after signup, as well as a “nurture bar” afterwards that showed customers the next steps to complete their setup.
After implementation, we tracked customer fall-off at each stage of the takeover wizard to see how we were doing. We also measured “Trial Engagement,” an internal calculation for when an account is likely to convert from their trial (what others call “the aha moment”). Using Kissmetrics, it was very easy to measure how the new design was working against this metric.
Old:

New:

After shipping the new experience, we saw a 25% boost in the “engagement” metric mentioned earlier, measured using Kissmetrics’ weekly cohort reports. Kissmetrics showed us that with the new wizard, new users were actively using the product earlier in their trial and using more of the features in the product. In addition, far fewer new users were ending up in “fail states,” such as being on-call without notification rules set up.
Since then we’ve run various experiments on the trial funnel, and the weekly cohort report has really helpful for looking at the effects of those experiments and determining whether our changes are actually helping users.
Qualitative feedback has also important to get a full picture of how the changes to the product affect the user experience. We’re pretty low-tech in this regard — I dumped a list of users I pull from Kissmetrics into to CSV, then sent them a quick micro-survey to see if anything was unclear with the new onboarding. We also gathered internal feedback from our sales team and support teams to confirm that customers were finding our new experience easy to use and understand.
To get more context on how people are using PagerDuty, we also route Segment data to Google Analytics, which is a great way to look at meta behavior trends. Kiss can tell you who is doing something, but Google Analytics is a little better for asking questions like “Which features get used the most?” or “What Android versions are most of our users on?” Google also manages top-of-funnel analytics (the marketing website) a little better, while Kissmetrics is more powerful once the user is actually in trial.
Since our initial work on the wizard, we’ve expanded our use of analytics to look at behavior of both trial accounts and active customers. Whenever I’m about to start work in a particular area of the product, I’ll use Kissmetrics to pull a list of highly active users in that area, and then reach out to them to understand how they’re using our features and what their pain points and goals are. We also implemented mobile tracking with Segment because some of our customers mainly use our service through our mobile app, and installed the ruby gem for code-level tracking.
There are plenty of improvements we’d like to make to our onboarding, but since it’s doing pretty well right now, our next project is going to be investigating simultaneous A/B testing. We move fast, and if we’re running a sales or marketing initiative alongside product changes, sometimes it’s tough to sort out what impacted what. Split-testing trial experiences should let us get cleaner data about how our onboarding redesign is improving our trial users’ experience, and ultimately help us make better decisions about the ideal experience.
Like any new initiative, we learned a lot when implementing analytics for the first time. Here are some of our takeaways — hopefully they’re helpful to you as well.
Choosing what to track is an art — too few events and you may miss a key action; too many and it gets really noisy. Segment hadn’t yet shipped their “Tracking Plan” feature, so we had to manage our list of tracked events in Google Docs. It wasn’t pretty — in fact, had we done it again, I would have started a fresh new account after we finished our evaluation, tracking far fewer events.
Using separate production and development environments is absolutely key, in both Segment and the downstream analytics tools. We have it set up so events on all our local, staging, and load test environments go to “pagerduty-dev”, and only events in the production web stack go to the main account. In addition, we add filters to make sure that we’re not rolling activity on internal employees’ accounts into our metrics.
Nobody’s solved the problem of simultaneously looking at user-level and account-level funnel data. We’re currently looking at a Kissmetrics workaround using two different Kiss instances, but it was surprising to us that nobody natively handles pivoting on both levels.
User privacy and trust is incredibly important to us. PagerDuty takes its privacy policy seriously, and in choosing our analytics stack, we ensured that any vendor that dealt with user and customer data has a strong privacy policyincluding Safe Harbor compliance.
I hope you found our story helpful! If you have any questions or feedback, hit me up @dshack on Twitter.
A big thanks goes out to Dave from PagerDuty for this piece! If you’re interested in sharing your Segment story, we’d love to have you. Email friends@segment.com to get started!

Our annual look at how attitudes, preferences, and experiences with personalization have evolved over the past year.