Engineers & Developers

Highlighting Performance Improvements Across Our Most Popular SDKs

Analytics Swift and Analytics Kotlin are libraries that provide a simple, modern instrumentation experience for mobile apps. This blog post highlights key performance improvements for these next-generation SDKs.

Apr 25, 2022

By Wenxi Zeng


Summary of Improvements

Our new Analytics-Swift and Analytics-Kotlin SDKs outperform Analytics-iOS and Analytics-Android in the following aspects:

  • thread-safety

  • resource/battery efficiency

  • data integrity

  • extensibility

Background

At Twilio Segment, we take data integrity seriously. As the first step in getting customer data flowing into our Customer Data Platform (CDP), we believe SDKs should be light-weight to minimize the impact on the app. Even in extreme cases, an SDK should not exhaust all the resources, in turn making the app unresponsive. 

We take performance to heart when architecting our SDKs, and continuously strive to improve them. Although Analytics-iOS and Analytics-Android steadily contribute a big portion of analytics traffic (see chart below), we knew there was an opportunity to improve performance, offer a more extensible architecture, and provide higher data integrity. Besides that, as Swift and Kotlin become more and more popular in the community, we want to support them from native. That’s why we recently launched our Analytics-Swift and Analytics-Kotlin SDKs. These new SDKs carry on our principles of avoiding data loss, ensuring maximum performance– all while using minimal resources. In addition, these libraries introduce an entirely new Plugin architecture and are built using modern languages. 

web-vs-mobile-sdk-traffic
Traffic Contributed by Mobile SDKs vs Web SDK

Traffic Contributed by Mobile SDKs vs. Web SDK

While we believe these new libraries are vastly superior, the proof is often in the proverbial pudding. In this post, we’ll bring solid benchmark results that show how these new libraries outperform the previous ones in every aspect. 

Note: We’ll use the following terms interchangeably: iOS for Analytics-iOS, Swift for Analytics-Swift, Android for Analytics-Android, and Kotlin for Analytics-Kotlin.

Test Environment

In our performance tests, to ensure fairness, all of the experiments were run on the same device and same version of OS. An app has been built specifically for this benchmark to ensure memory and CPU usages are from the same baseline. Logging is turned off to avoid performance deterioration. Only crucial timestamps of test checkpoints are outputted. The number of such checkpoints is far less than the test dataset (1: 10,000), thus the impact is negligible.

Experiments:

  1. Analytics-iOS vs Analytics-Swift

  2. Analytics-Android vs Analytics-Kotlin

Device Info: 

sdk-performance-device-info
Device Info

Test Dataset: 

100,000 track events are generated by the following code:

analytics.track("Stress Test from <SDK>")

Each event payload is sized at 1.6KB, which also includes essential context info such as “app”, “device”, etc.

Methodology

Analytics Configuration

Across all of our experiments, we disabled all device mode destinations and configured the SDKs with the same parameters. 

The key configurations are:

  • flushAt: 20 (events)

  • flushInterval: 30 (seconds)

The considerations behind choosing these values are as follows: 

  1. We need a flushAt value that is small enough to produce large disk writes, so we can examine disk I/O usage; 

  2. The value should be big enough to accumulate enough files, so we can test under race conditions when flushAt and flushInterval are both met, files are being flushed to remote properly without losing data integrity.

Test Dataset Generation

In our experiments, we have tested datasets with the size of 10K, 20K, and 100K track events. They all yield the same result. Here we demonstrate the result for 100K events because it takes the longest time among the three for the SDKs to digest the events, thus easiest to exclude the pollution of outliners.

 The pseudo-code used for data generation are as follow:

loop (100K times) { analytics.track("benchmark") }

Note that for iOS/Swift tests, we use autoreleasepool to measure memory usage accurately in a tight loop.

Log Injection

Though we have turned off all the logs to prevent performance degradation caused by logging, some of the logs are essential to be able to measure the performance. For that purpose, we have injected the following logs:

  • test start time

  • test end time

  • total number of network calls when the test ends

  • total number of events buffered/queued in memory when dataset generation is completed

These logs are only output at the beginning and end of each test and only once, thus reducing the logging degradation to negligible (only 4 logs).

Metrics

To give a comprehensive performance review, we use three tools: injected logs, IDE built-in profilers, and segment.com portal to obtain data for different metrics.

With the injected logs, we can examine SDKs performance from the following perspectives:

  • duration to complete writing 100K events

  • write IO per second (IOPS)

  • events in buffer/memory but yet being written to disk when 100K generation is finished

  • number of network calls to flush 100K events

The following metrics can be observed from the built-in profiler of XCode/Android Studio

  • size of data written to disk (iOS/Swift only)

  • memory profiling

  • CPU usage

Lastly, we use the app.segment.com portal to determine the number of events that have arrived server-side.

Experimental Results

The table below lists the results of the tests at a glance. We will go through each of the metrics in detail. Keep in mind that we are only comparing Analytics-iOS to Analytics-Swift and Analytics-Android to Analytics-Kotlin.

sdk-performance-experimental-results
Experimental Results

Duration and Write IOPS

Duration is defined as the time span from the first event being generated to the last event being written to disk. It shows the speed of each SDK handling 100K events. Shorter is better.

ios-vs-swift-duration
iOS vs Swift: Duration

iOS vs. Swift: Duration

android-vs-kotlin-duration
Android vs Kotlin: Duration

Android vs. Kotlin: Duration

Write IOPS measures how many writes per second the SDKs produce. The higher Write IOPS is, the more intensive data flow the SDK can tolerate, thus using less time. Duration and Write IOPS are related, larger is better:

write IOPS = total number of events / duration in seconds
ios-vs-swift-write-iops
iOS vs Swift: Write IOPS

iOS vs. Swift: Write IOPS

android-vs-kotlin-write-iops
Android vs Kotlin: Write IOPS

Android vs. Kotlin: Write IOPS

The result shows that Analytics-Swift is 15x faster than Analytics-iOS, and Analytics-Kotlin is 2x faster than Analytics-Android.

Buffered Events

Buffered Events measures how many event entries are still in memory(but yet to be stored to disk) while 100K generation is done. We want to keep this metric as close as to zero as possible so that in the case where an app gets terminated, events are not lost. Lower is better.

ios-vs-swift-buffered-events
iOS vs Swift: Buffered Events

iOS vs. Swift: Buffered Events

android-vs-kotlin-buffered-events
Android vs Kotlin: Buffered Events

Android vs. Kotlin: Buffered Events

The result is obvious – iOS and Android are barely able to process events because of the low write IOPS. Almost all of the events are in the queue. If the app is terminated, all of these events are lost. In contrast, Swift and Kotlin achieve zero data loss.

Disk Write

Disk write measures the overhead that the SDK adds to the disk while processing the test dataset. It also shows how optimized an SDK is in terms of IO operations since good algorithms avoid writing unnecessary data to the disk. Smaller is better.

This metric is only available for iOS/Swift since the XCode profiler provides this info.

ios-vs-swift-disk-write
iOS vs Swift: Disk Write

iOS vs Swift: Disk Write

The result shows that Swift’s disk write is very close to the actual size of the test dataset, whereas iOS has a lot of redundant writes that cause the overall disk write is 40x higher than it is supposed to be. 

Memory Usage

Memory is a very scarce resource in a mobile device. We aim to reduce the memory footprints our SDK brings and bound the usage even if the events stream is intensive. Smaller is better.

ios-vs-swift-memory-usage
iOS vs Swift: Memory Usage

iOS vs. Swift: Memory Usage

android-vs-kotlin-memory-usage
Android vs Kotlin: Memory Usage

Android vs Kotlin: Memory Usage

We have built two benchmark apps, one for iOS and Swift, another for Android and Kotlin, to ensure the baseline of memory usage are the same (starting from 42MB for iOS/Swift, 100MB for Android/Kotlin). As the chart indicates, both Swift and Kotlin libraries use less memory and the usage is bounded, whereas the iOS and Android ones use 3x more memory at peak and 1x more on average. It’s worth mentioning that, the peak of old Android library is unbounded. Depending on if the OS actively reclaims the resources, it could go up to 600MB or even more.

CPU Usage

CPU is yet another scarce resource. High CPU usage consumes a significant amount of battery and makes the device unresponsive. In the new libraries, we optimized the threads usage and IO operations with more efficient algorithms. Lower is better.

ios-vs-swift-cpu-usage
iOS vs Swift: CPU Usage

iOS vs Swift: CPU Usage

android-vs-kotlin-cpu-usage
Android vs Kotlin: CPU Usage

Android vs Kotlin: CPU Usage

For iOS vs Swift, the benchmark result is clear that Swift uses less than half CPU compared to iOS. 

For Android vs Kotlin, we have to divide Android into two stages, because the performance degrades quite a bit while there is event generation going on. The CPU is almost used up during event generation and becomes better once all events are generated (but yet written to disk). However, Kotlin is still able to beat the best of Android’s results, and its performance is consistent over the entire experiment. 

Network Calls and Arrived Events

Network Calls shows the number of API calls made to the server for processing generated events. As bandwidth and energy are crucial to a mobile device, ideally, an SDK should avoid making excessive API calls and batch background calls to avoid consuming the device’s battery. 

android-vs-kotlin-network-calls
Android vs Kotlin: Network Calls

Android vs Kotlin: Network Calls

From the chart, Kotlin uses only 1/3 of calls compared to Android. 

As for iOS vs Swift, it is worth to noting that our test setup is the most extreme case a mobile device can get. It is very unlikely normal users would encounter this situation in their daily usage.

From the table below, it seems like Analytics-iOS invokes fewer API calls. However, it’s important to note that only a portion of the events are being delivered to the server, due to the maxQueueSize defaulting to 1000. This causes Analytics-iOS to start dropping events once the queue is full. The dataset generation is happening so fast, events are being lost in this high-volume scenario (please keep in mind that this is an extreme case designed to illustrate a point – there’s no cause for concern for those currently using Analytics-iOS).

sdk-performance-network-calls
Network Calls

Although changing the maxQueueSize to 200,000 (greater than the test dataset) addresses the event queue being overrun, it drastically degrades the performance. The SDK takes 11 hours to digest the test dataset and another 8 hours to flush all the events to the server. What’s worse, it produces 3.2TB disk writes. The memory peak goes up to 306.7MB and CPU usage 793%. 

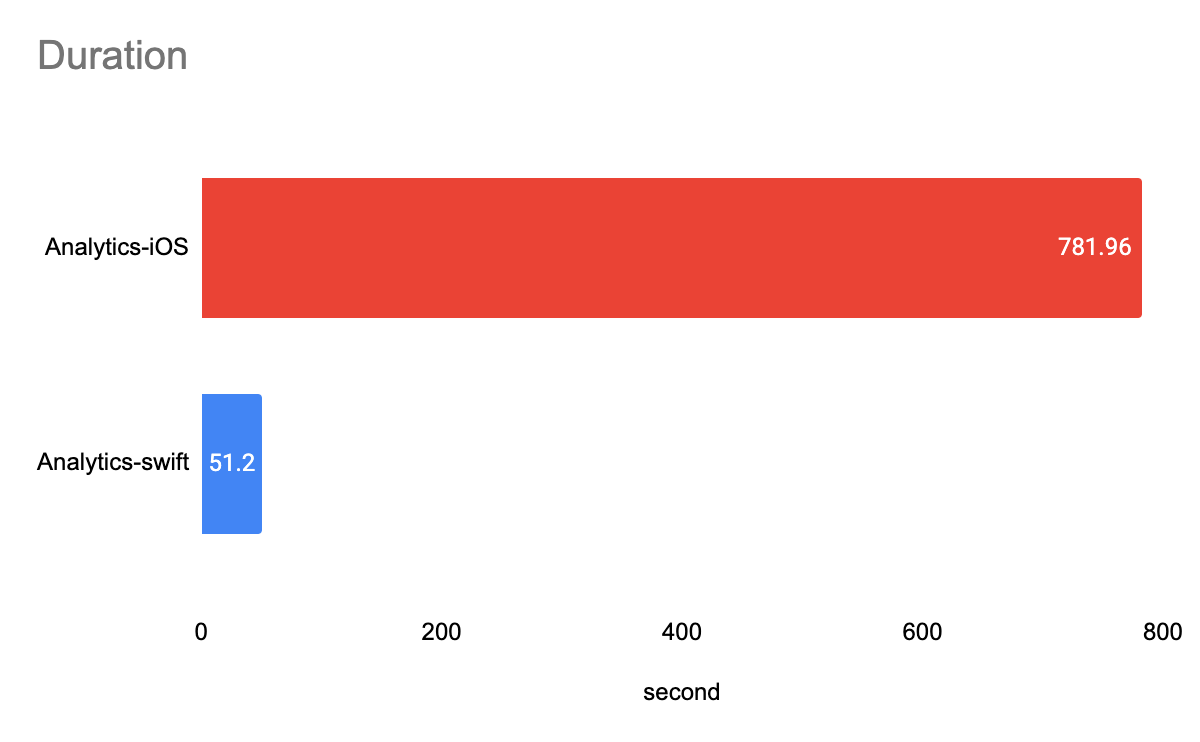
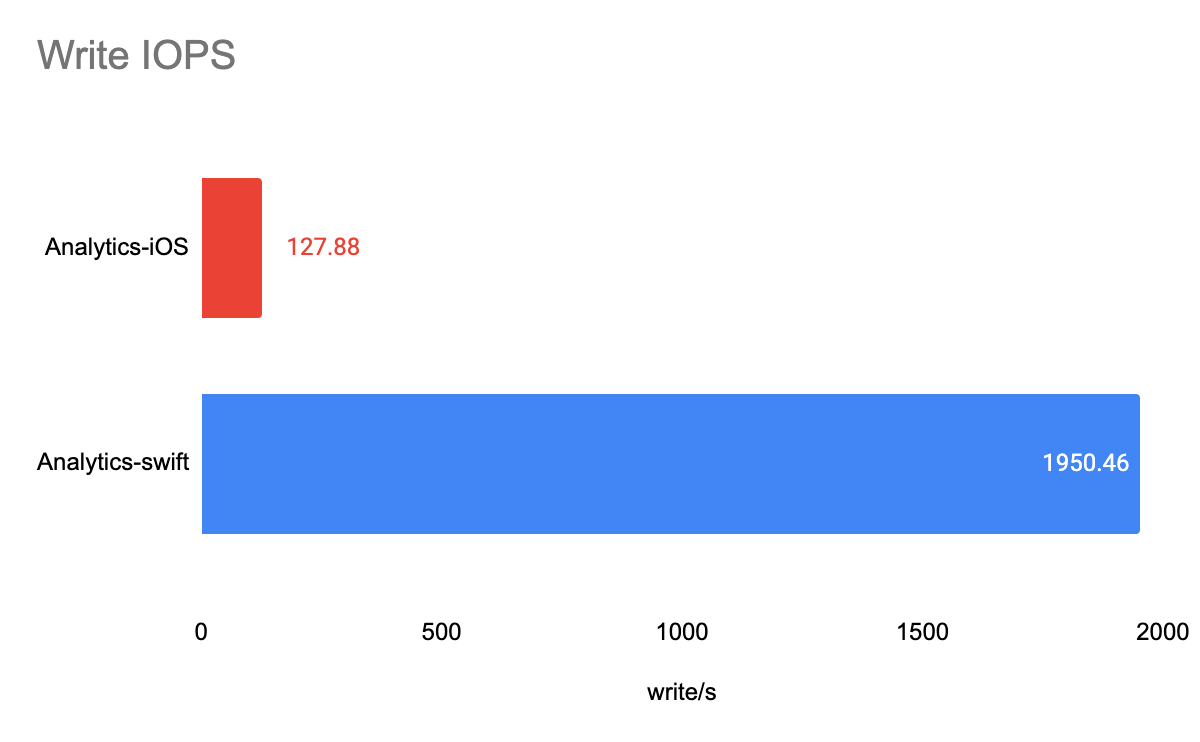
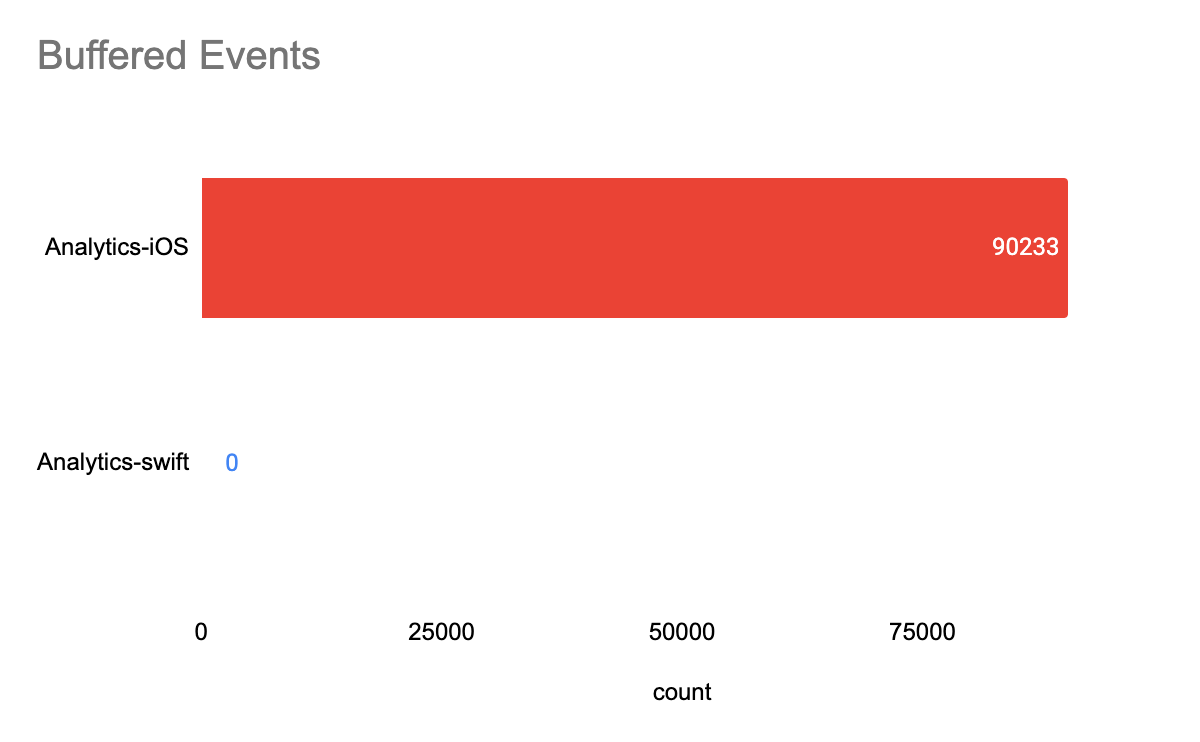
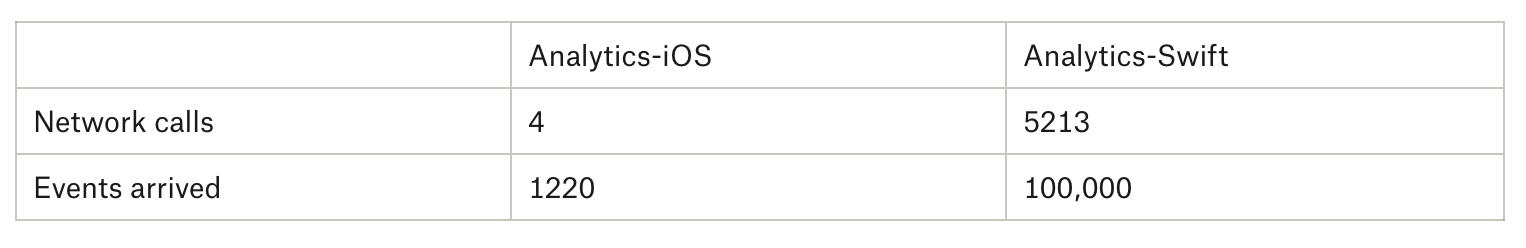
Thus, when comes to an intensive and high volume data flow, data integrity and delivery latency are trade-offs in Analytics-iOS. In contrast, Analytics-Swift delivers all the data as expected with very low latency. In other words, the new library scales exceptionally better than the old one. 

Recap

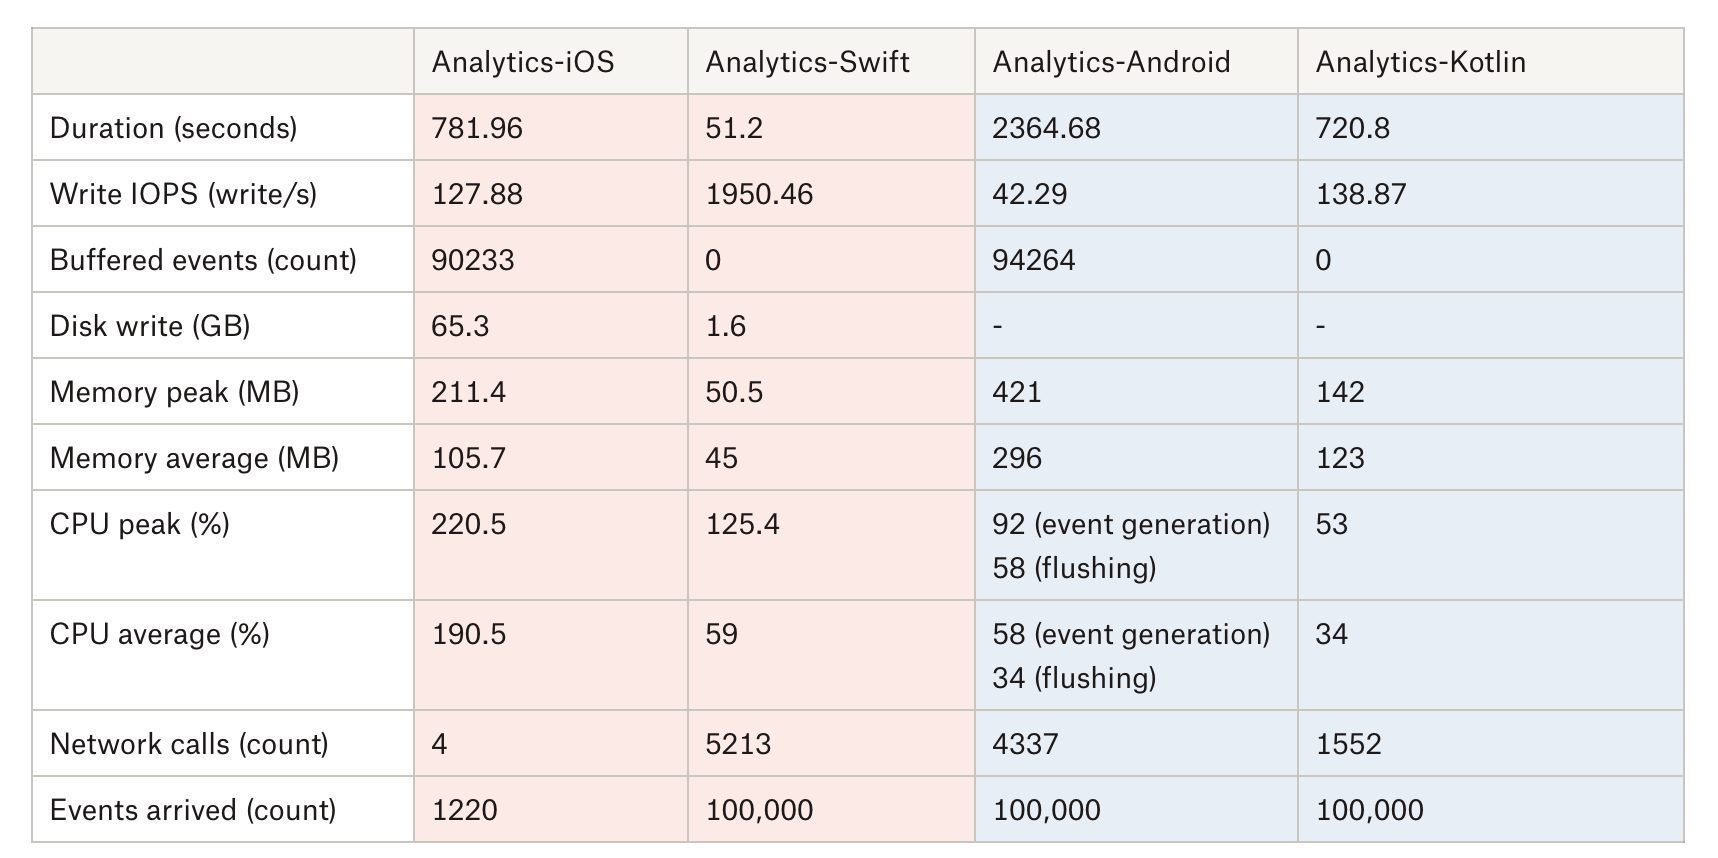
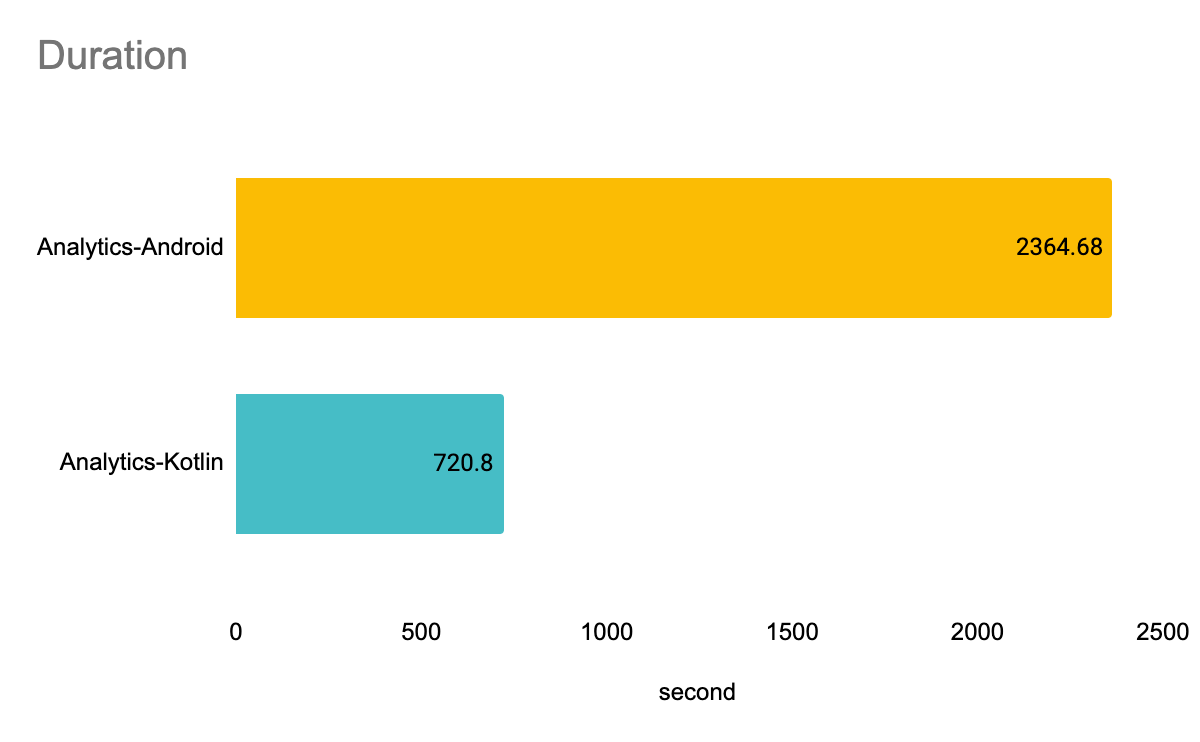
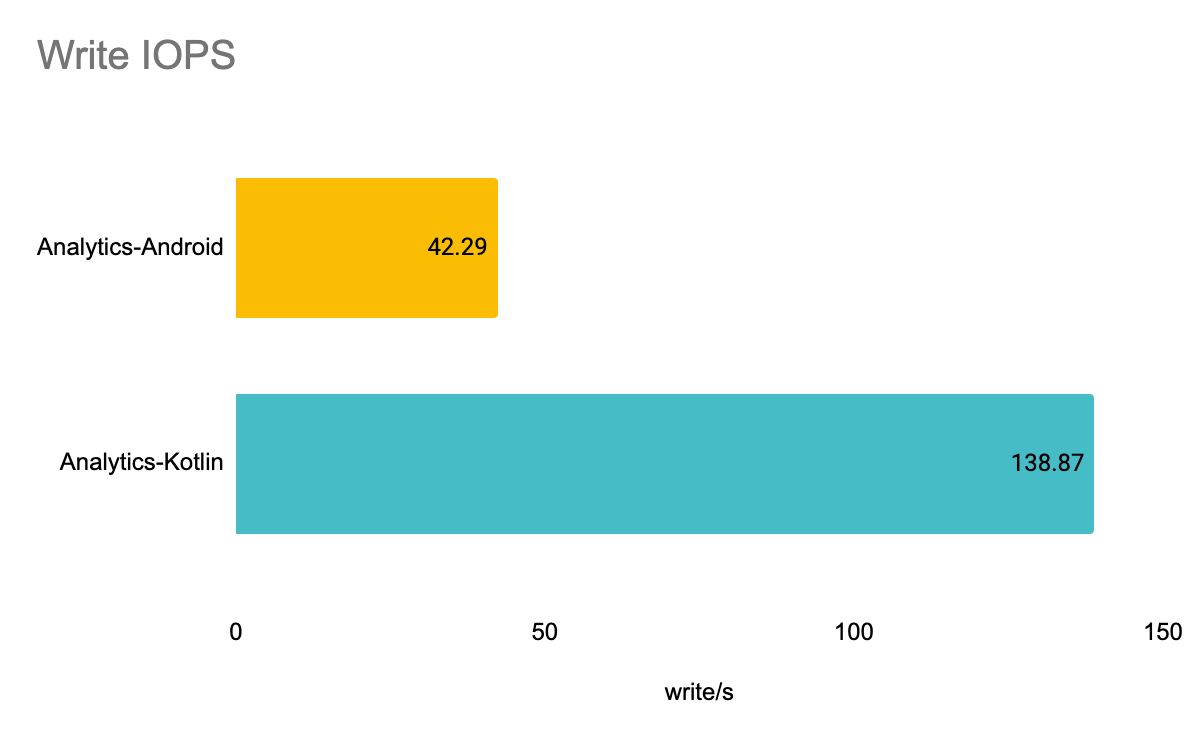
After examining the performance data from 8 different dimensions, we can conclude that the all-new Swift/Kotlin libraries outperform the old iOS/Android libraries in every aspects: 

  • They are stable. The performance does not fluctuate because of thread configuration changes.

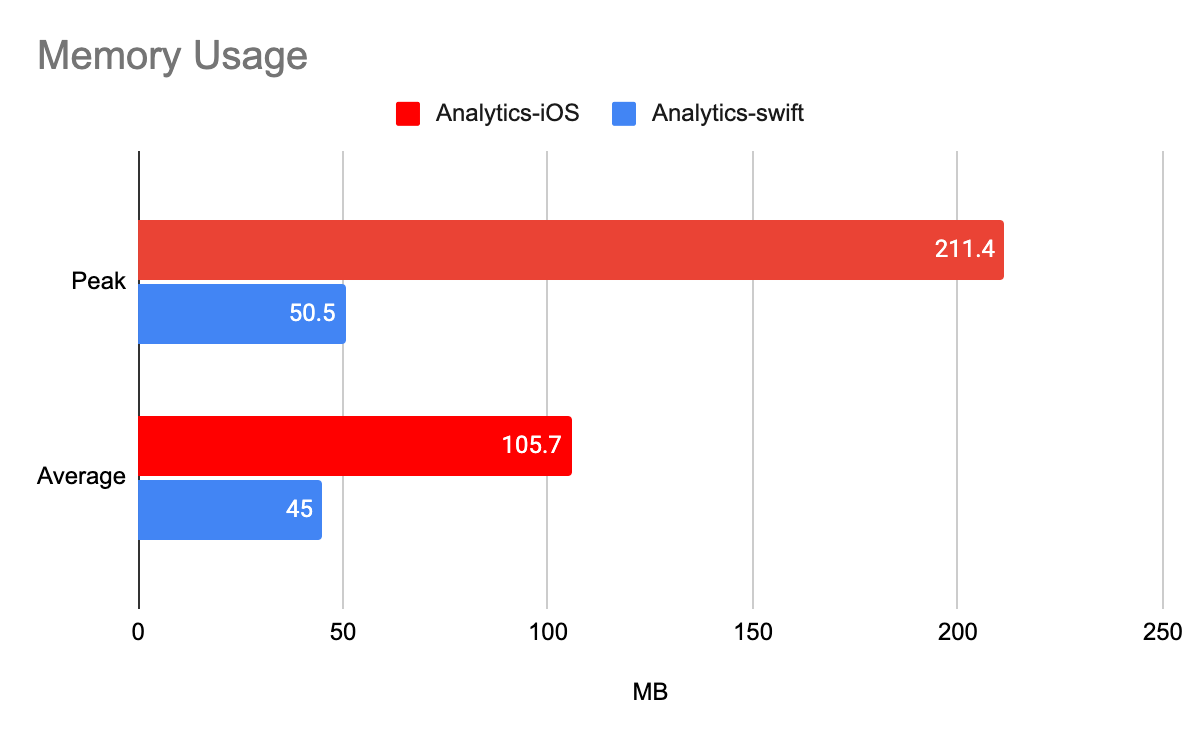
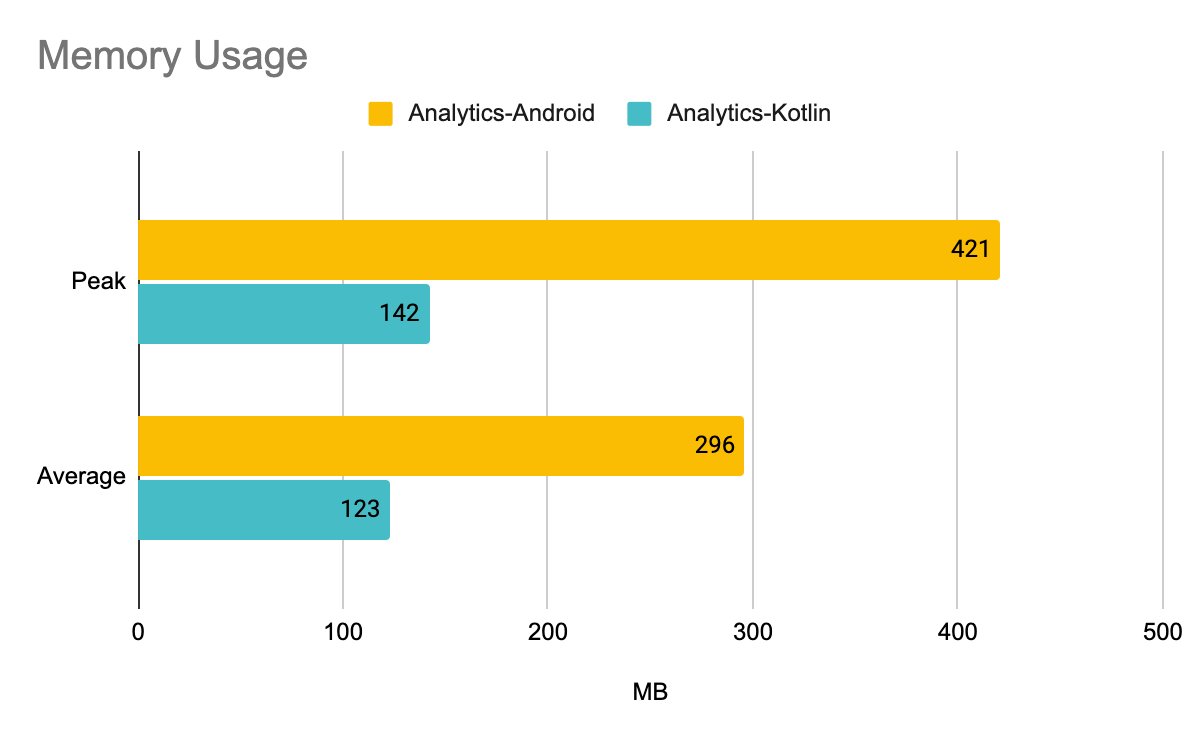
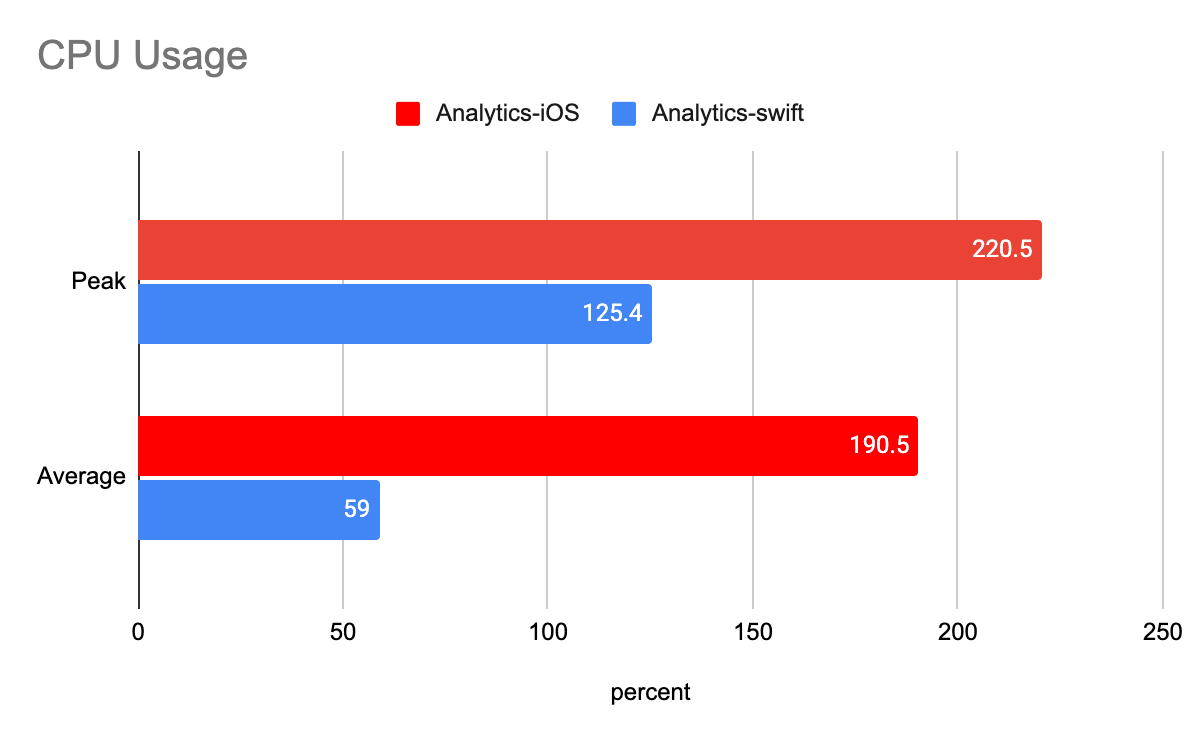
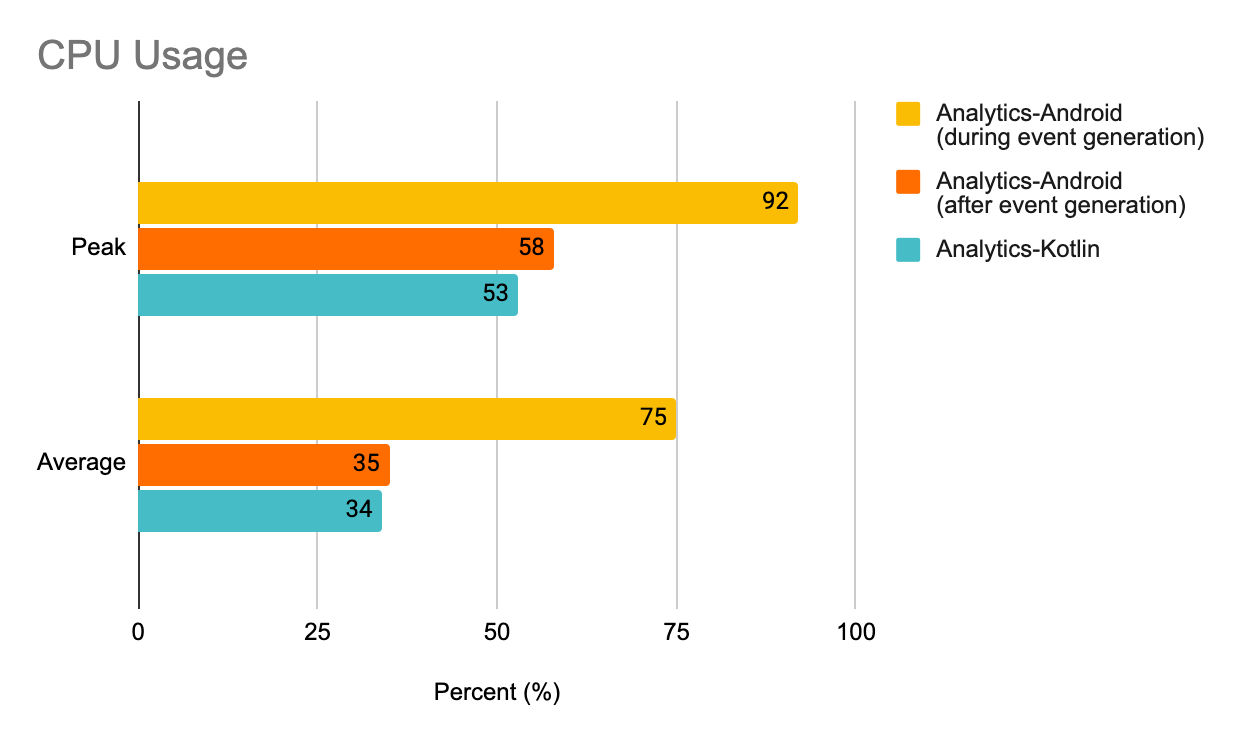
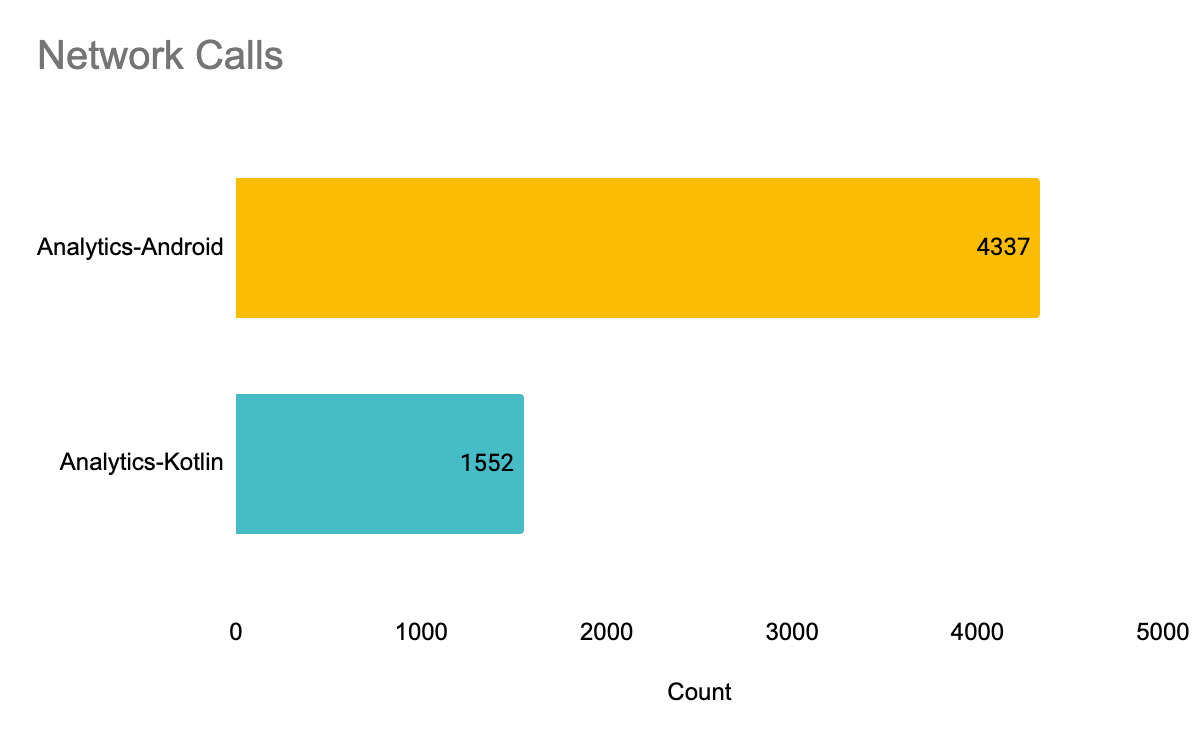
  • They are energy efficient, since less memory, CPU, and network resources are used.  

  • They are reliable, owing to high IOPS and less buffered events, thus bringing a higher level of data integrity.  

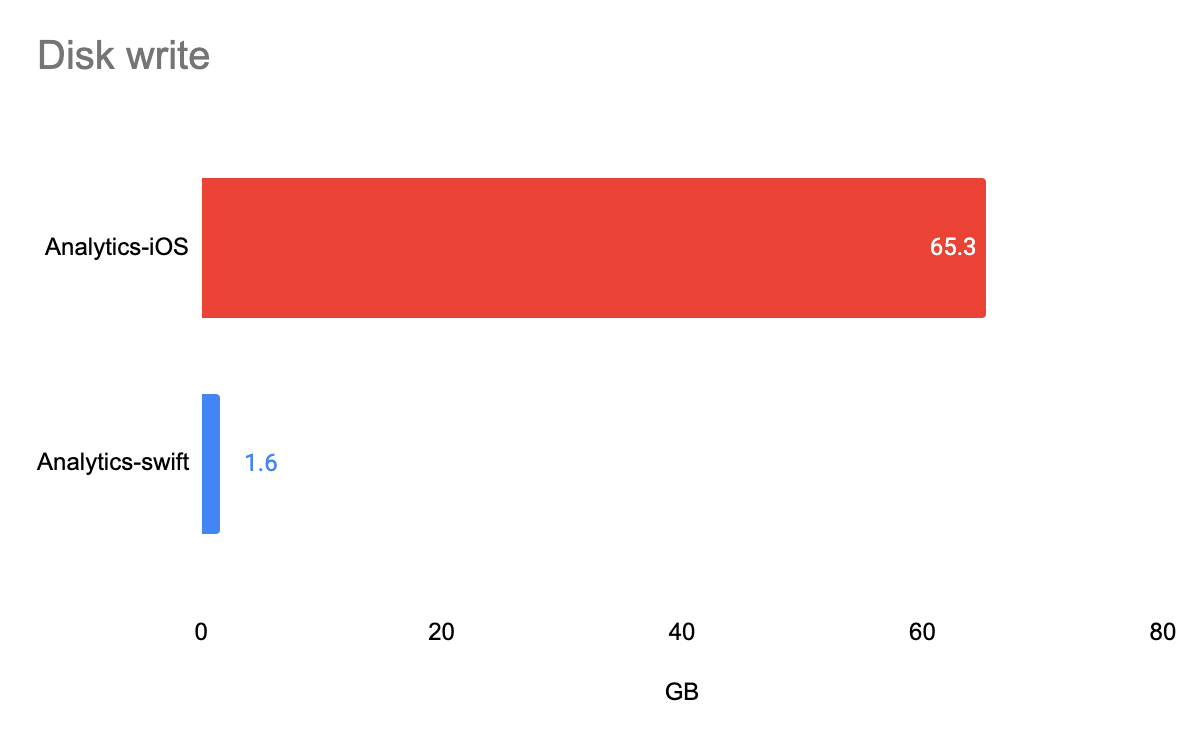
What’s more, the Swift library only writes necessary data to disk, which in turn saves significant battery. The Kotlin library is light-weight. During our tests, we were able to use only one single thread to boot Analytics-Kotlin.

Getting Started With Twilio Segment

Looking to get started with Twilio Segment? The Developer Toolkit gives developers the tools they need to extend the Twilio Segment platform and support the custom configurations required to streamline data collection, customize integrations as needed, and scale their data infrastructure effortlessly. Better yet – it’s available to all Twilio Segment customers. 

Building your custom data infrastructure is easy – simply sign up for a free account or request a personalized demo.

The State of Personalization 2023

Our annual look at how attitudes, preferences, and experiences with personalization have evolved over the past year.

Get the report
SOP 2023

The State of Personalization 2023

Our annual look at how attitudes, preferences, and experiences with personalization have evolved over the past year.

Get the report
SOP 2023

Share article

Want to keep updated on Segment launches, events, and updates?

We’ll share a copy of this guide and send you content and updates about Twilio Segment’s products as we continue to build the world’s leading CDP. We use your information according to our privacy policy. You can update your preferences at any time.