Faster Insights with Custom Dashboards for Twilio Segment Sources
This week we launched Segment Sources — a new way to bring together all of your customer touch points into a single database.
This week we launched Segment Sources — a new way to bring together all of your customer touch points into a single database.
This week we launched Segment Sources — a new way to bring together all of your customer touch points into a single database. More than 11,000 developers and analysts already rely on Segment to help load data from their websites and mobile apps into their data warehouse for advanced analysis. Now you can add in brand new dimensions of the customer experience that happen outside of your product in other cloud services like sales calls, support tickets, texts, payments and more.
But bringing all of your data into one place is only the first part of the story. The next step is exploring your data to answer important questions about your business. Connecting these apps — Salesforce, Zendesk, Mandrill, Stripe and more — to your database with Segment Sources opens up new possibilities for analysis and understanding the complete customer experience.
To help you get your insights faster, we’ve built some getting started queries and detailed documentation around Sources schemas. However, we’re most excited to announce new offerings from our business intelligence partners to help you explore and visualize this data.
The fine folks at BIME, Mode, Looker, Periscope, and Chartio have built useful, new resources to help you analyze your Sources data. Take a look their offerings below, so you can start answering new questions about your customers as quickly as possible.
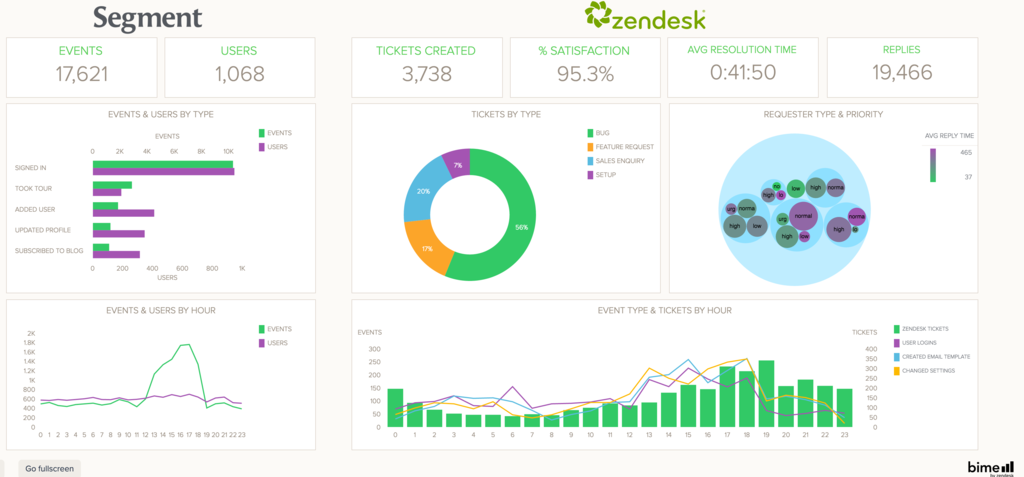
BIME is a visualization platform that’s great for business users. You don’t need to know SQL to build impressive reports and charts. Now a part of the Zendesk family, BIME has built handy dashboards for the Zendesk Source.
Resources:
Walk in your customer’s shoes with Segment and BIME — This article lays out how you can get started with Zendesk, Segment, and BIME and analyses you can run right away.
Customer Support Control Center — Layer on this dashboard to your Zendesk data in BIME and immediately see all of the important metrics for your customer care team. The dashboard covers everything from volume by ticket type, to average resolution time, requester distribution and more!
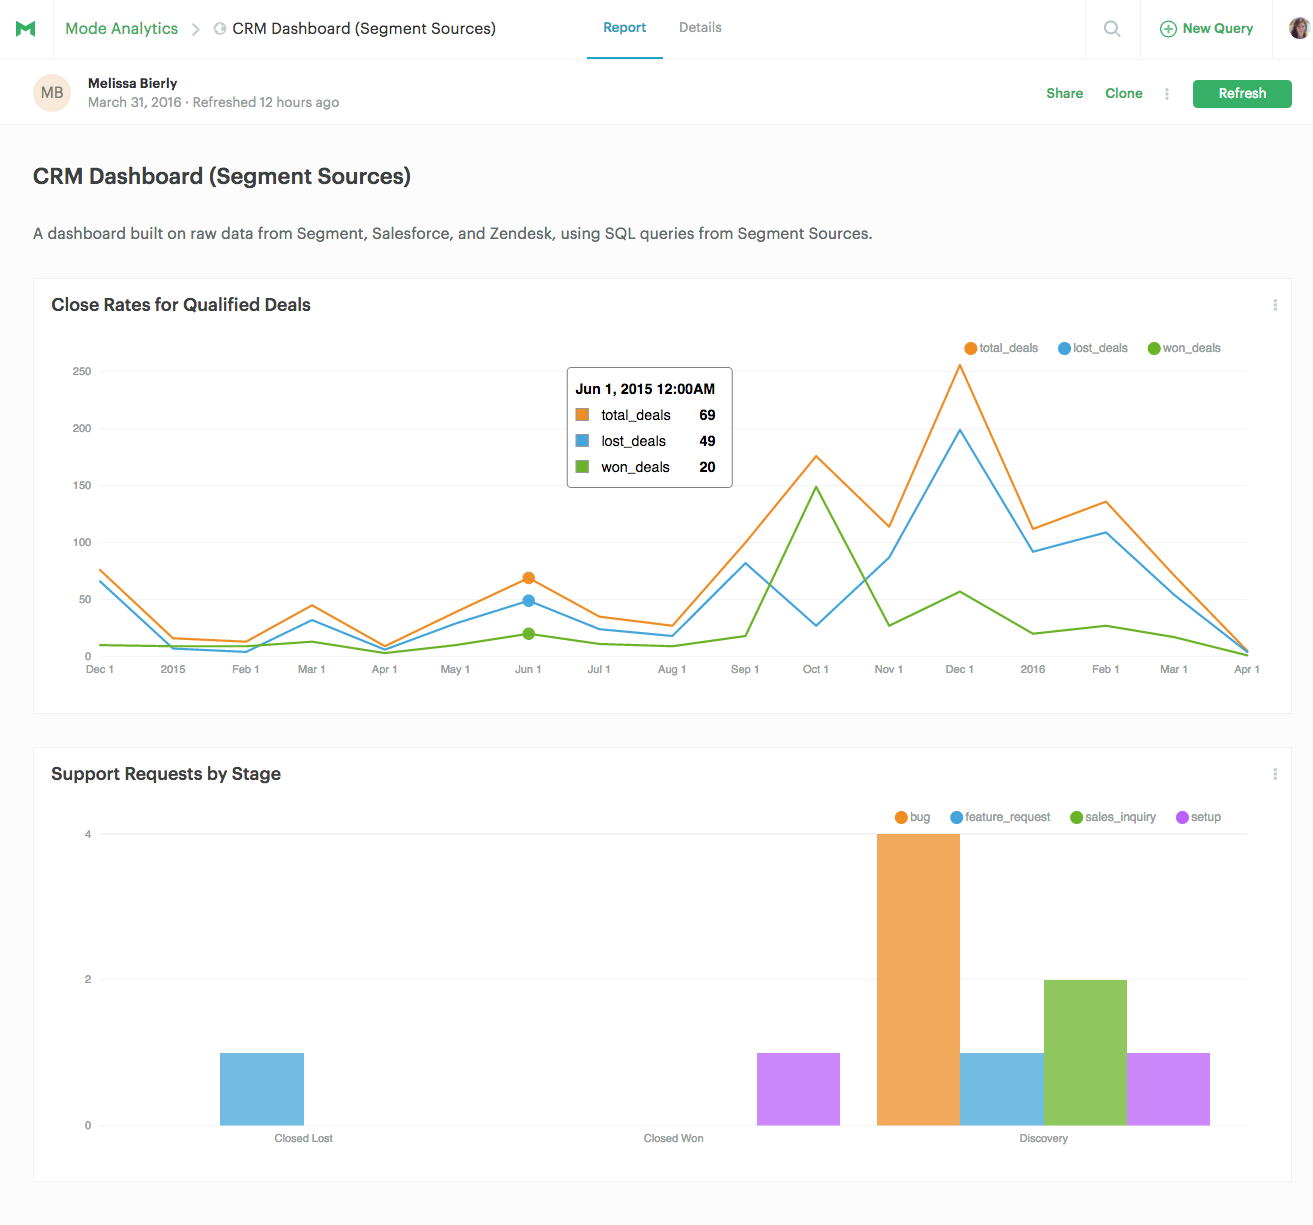
Mode is a powerful platform for analysis, great for ad hoc queries and sharing data stories with everyone at your company. Mode has a number of awesome resources for Sources data, particularly around analyzing Salesforce data
Resources:
Your Customer Data in One Place — Learn how to become a customer-driven organization by analyzing the complete customer experience and asking the right questions.
Sources Dashboards — Check out the dashboards Mode has built using some of our recipes for Stripe, Salesforce, and Zendesk. In just one click you can clone the reports and hook them up to your data.
Analyzing CRM Data? Familiarize Yourself with these 5 Salesforce Objects — Get the scoop on the most popular Salesforce collections for analysis. This is a great starting point if you’re new to CRM data in SQL.
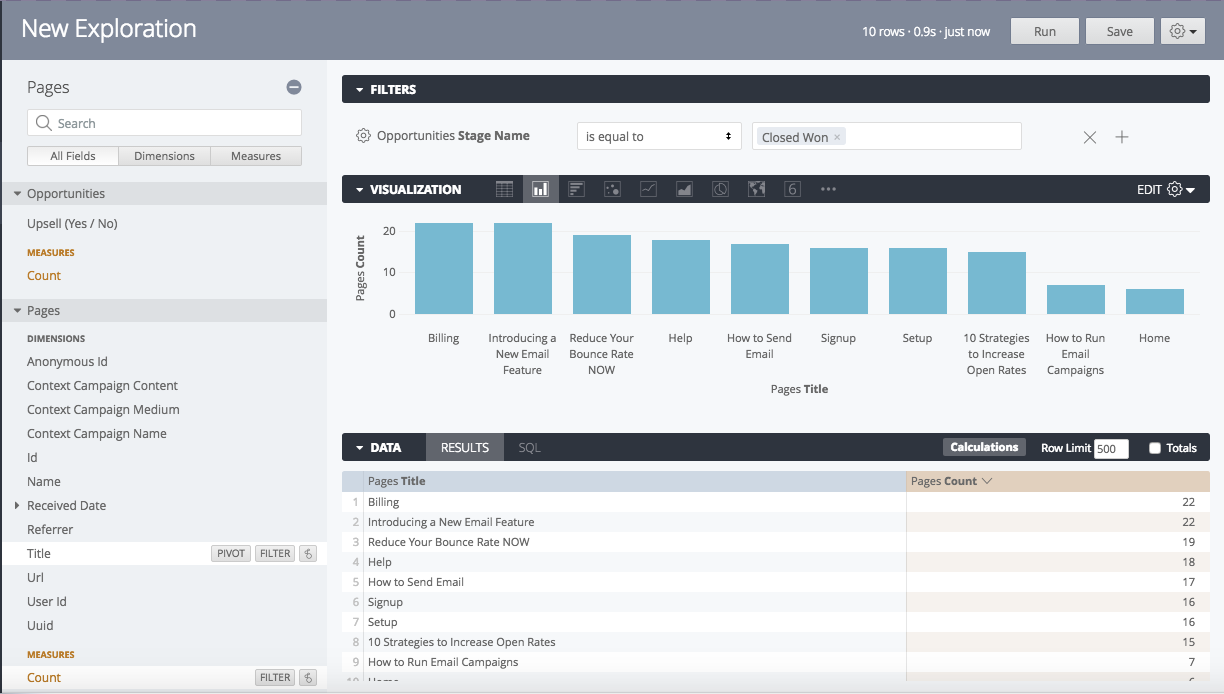
Looker makes it easy for analytics teams to create a data platform that everyone in their organization can explore. They support building data driven cultures, by taking the time upfront to define a common data model for your company. Looker has a number of analytics resources for Segment-Looker customers, from their pre-built “Blocks” for Segment and Salesforce data, to education on joining user IDs across platforms.
Resources:
How to Combine Segment and Salesforce Data with Looker — Walk through helpful queries for combining your product and sales data. Answer questions including “what does our lead funnel look like?” and “what content should we send our prospects?”.
Looker Block for Segment — Dive into your website and mobile data with Looker’s Block for Segment. Find out-of-the-box analysis for session reporting, funnel analysis, and conversion funnels. You can also add in their Block for Salesforce to explore your CRM data.
Creating a Single Source of Truth Learn how to create a single source of truth for your data with Looker and Segment.
Identifying Users with a Universal ID— Explore solutions for connecting users across multiple devices in your analytics data.
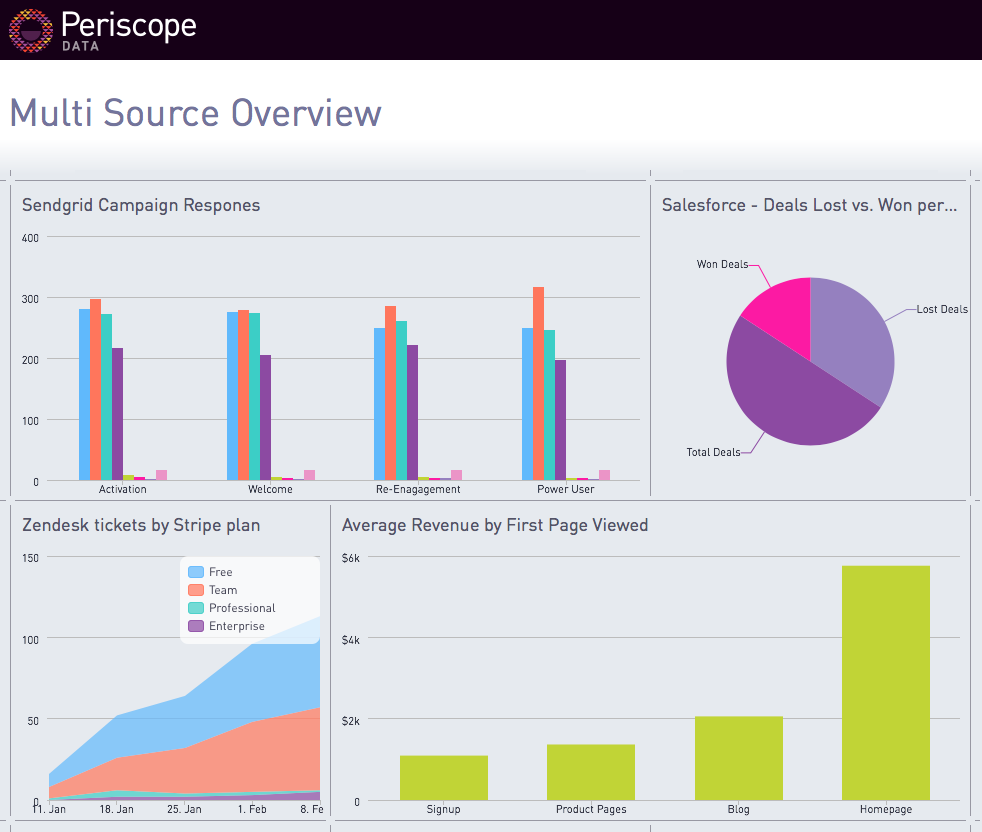
Periscope is a popular tool for dashboarding and SQL analysis. For Segment customers, the Periscope team is offering customized support and building sample dashboards to showcase how you can combine data across multiple sources. Their solutions team is available via live chat, as well.
Resources:
Analyzing Disparate Data with Segment Sources — Take a walk through a few examples of how Periscope and Segment can answer a strategic question about your business.
Talk to the support team — If you’re new to SQL or just have some questions about how to join your data, the Periscope team is here to help.
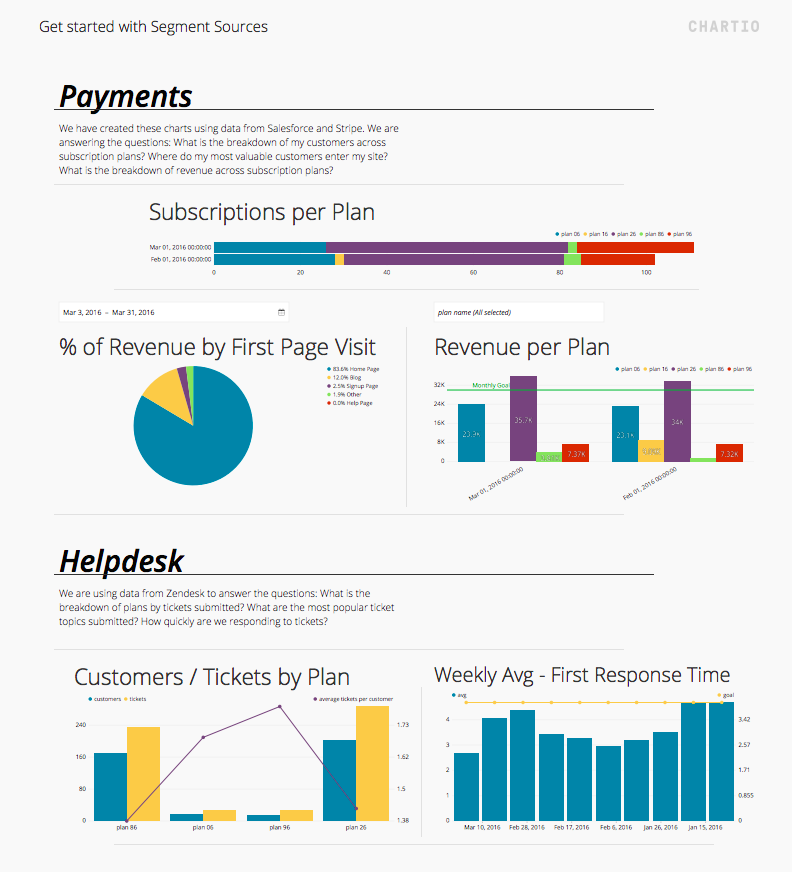
Chartio is an analytics platform designed to empower anyone in your company to explore and visualize data in a meaningful way. With an easy-to-use interface, anyone can build custom reports and drill down into anomalies without using SQL. Segment Source customers using Chartio will be able to discover hidden business insights even more easily with pre-built dashboards and queries that will get them started in minutes.
Resources:
Introducing Segment Sources with Chartio — Learn how Chartio and Segment work together to help you get more out of your data.
Pre-built dashboards — Every Chartio customer with a Segment Source connection will have dashboards ready and waiting for them in the app.
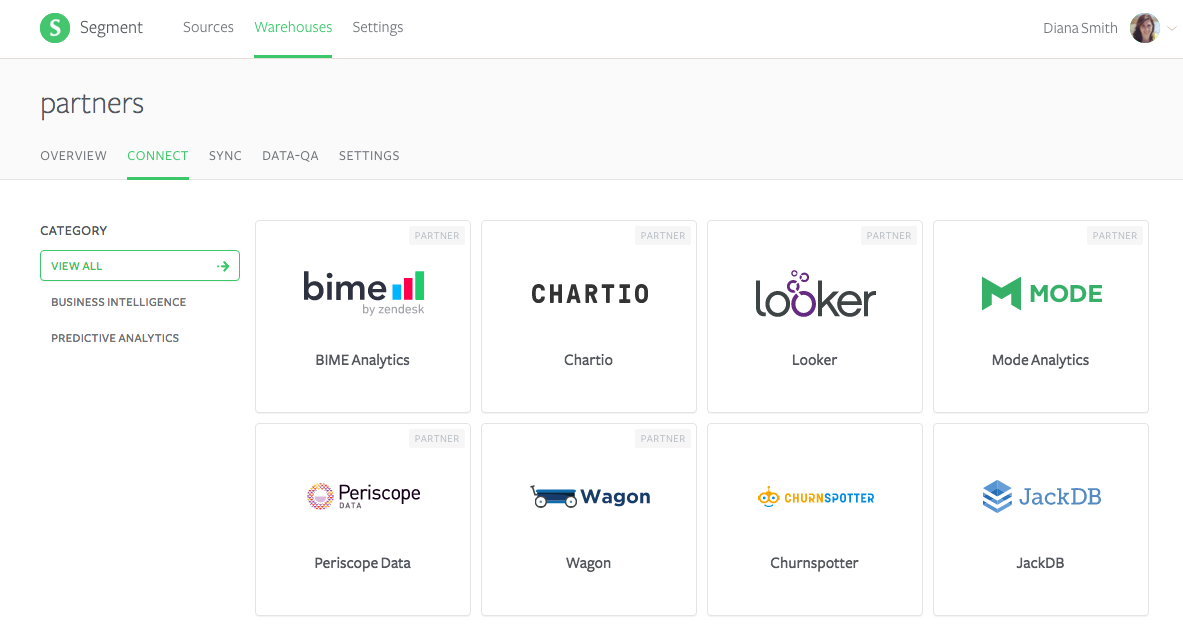
Many thanks to our BI partners for helping to make querying Segment data a delightful experience! Each team has been working hard to close the loop between getting your data where you want it and finding insights in that data. If you’re using Segment Warehouses already, you can discover all of these tools directly in the Segment app under Warehouses Connect!
To learn more about the new types of data you can pull into your warehouse with Segment Sources, sign up for our webinar on April 19!
Our annual look at how attitudes, preferences, and experiences with personalization have evolved over the past year.