Centrifuge: a reliable system for delivering billions of events per day
By Calvin French-Owen

Today, we’re excited to share the architecture for Centrifuge–Segment’s system for reliably sending billions of messages per day to hundreds of public APIs. This post explores the problems Centrifuge solves, as well as the data model we use to run it in production.
At Segment, our core product collects, processes, and delivers hundreds of thousands of analytics events per second. These events consist of user actions like viewing a page, buying an item from Amazon, or liking a friend’s playlist. No matter what the event is, it’s almost always the result of some person on the internet doing something.
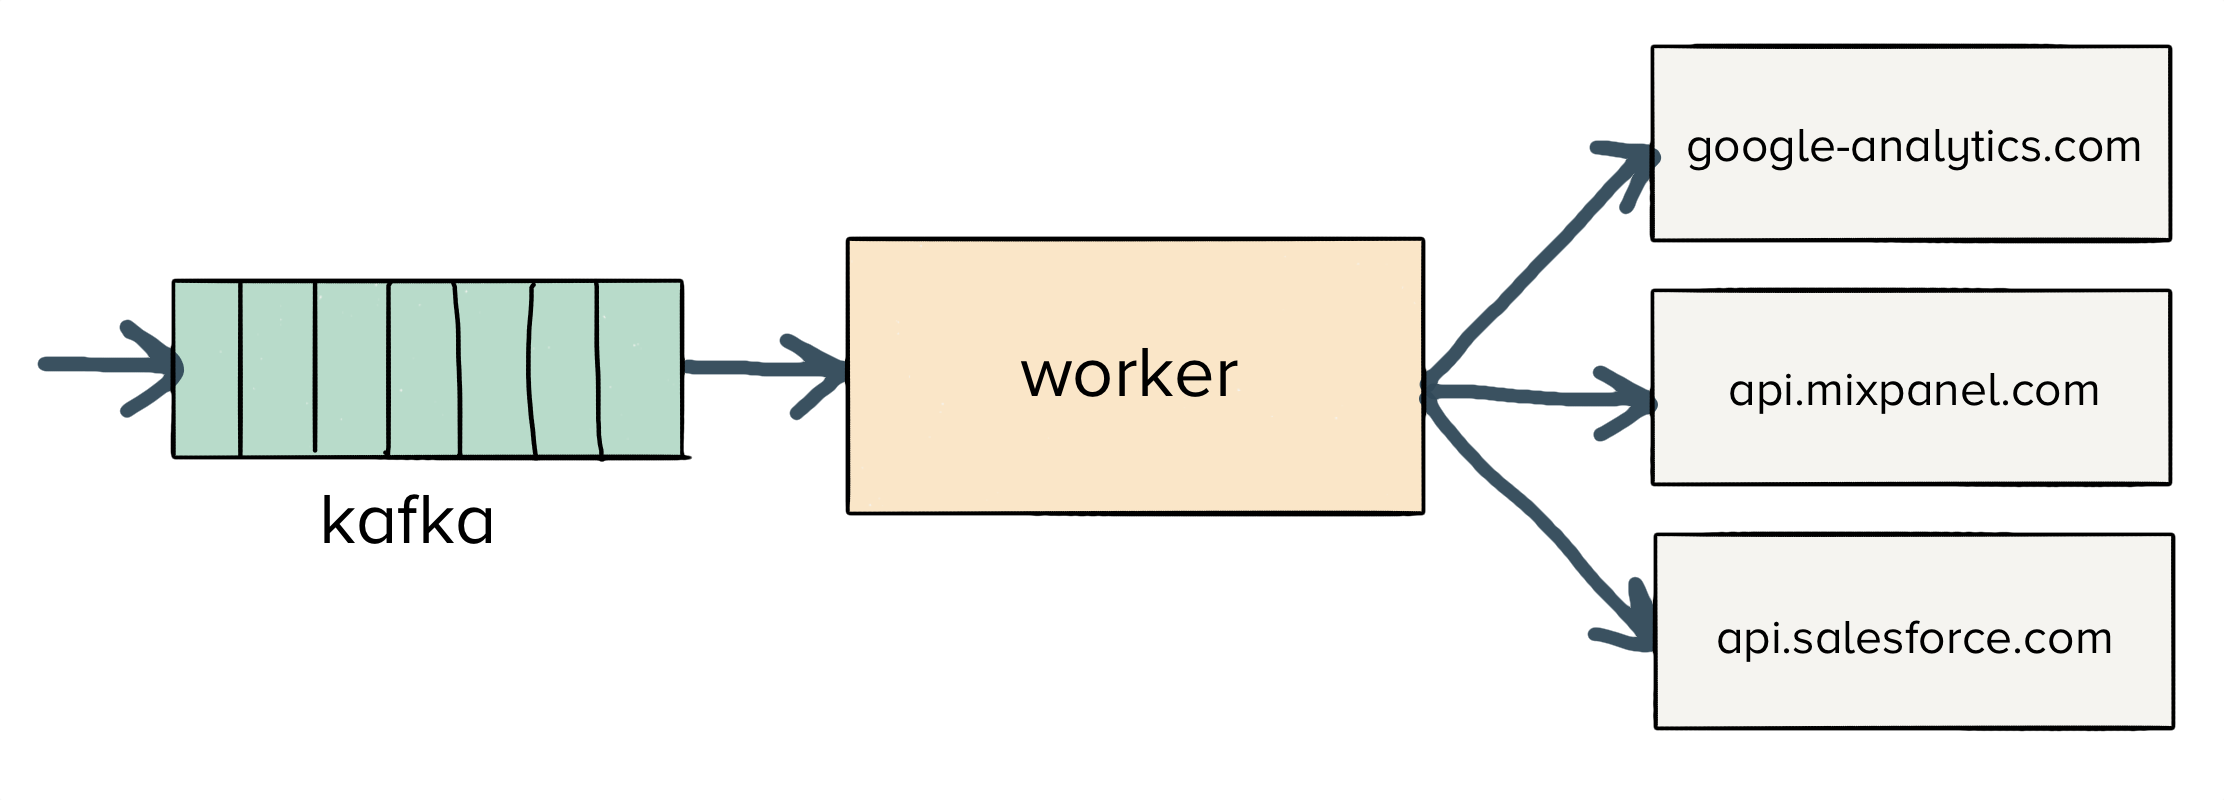
We take these incoming events and forward them to hundreds of downstream endpoints like Google Analytics, Salesforce, and per-customer Webhooks.
At any point in time, dozens of these endpoints will be in a state of failure. We’ll see 10x increases in response latency, spikes in 5xx status codes, and aggressive rate limiting for single large customers.
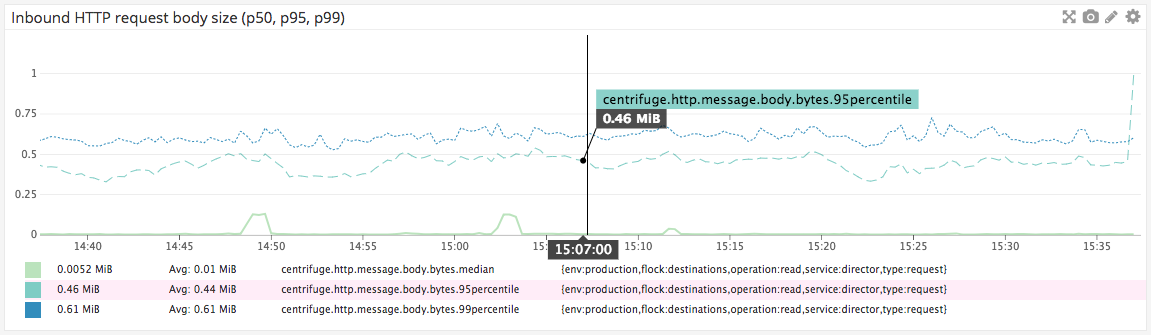
To give you a flavor, here are the sorts of latencies and uptimes I pulled from our internal monitoring earlier today.
In the best case, these API failures cause delays. In the worst case, data loss.
As it turns out, ‘scheduling’ that many requests in a faulty environment is a complex problem. You have to think hard about fairness (what data should you prioritize?), buffering semantics (how should you enqueue data?), and retry behavior (does retrying now add unwanted load to the system?).
Across all of the literature, we couldn't find a lot of good 'prior art' for delivering messages reliably in high-failure environments. The closest thing is network scheduling and routing, but that discipline has very different strategies concerning buffer allocation (very small) and backpressure strategies (adaptive, and usually routing to a single place).
So we decided to build our own general-purpose, fully distributed job scheduler to schedule and execute HTTP requests reliably. We've called it Centrifuge.
You can think of Centrifuge as the layer that sits between our infrastructure and the outside world–it's the system responsible for sending data to all of our customers destinations. When third-party APIs fail, Centrifuge is there to absorb the traffic.
Under normal operation, Centrifuge has three responsibilities: it delivers messages to third-party endpoints, retries messages upon failure, and archives any undelivered messages.
We've written this first post as a guide to understand the problems Centrifuge solves, its data model, and the building blocks we’ve used to operate it in production. In subsequent posts, we’ll share how we’ve verified the system’s correctness and made it blindingly fast.
Let’s dive in.
Before discussing Centrifuge itself, you might be thinking "why not just use a queue here? Building a fully distributed job scheduler seems a bit overdone”.
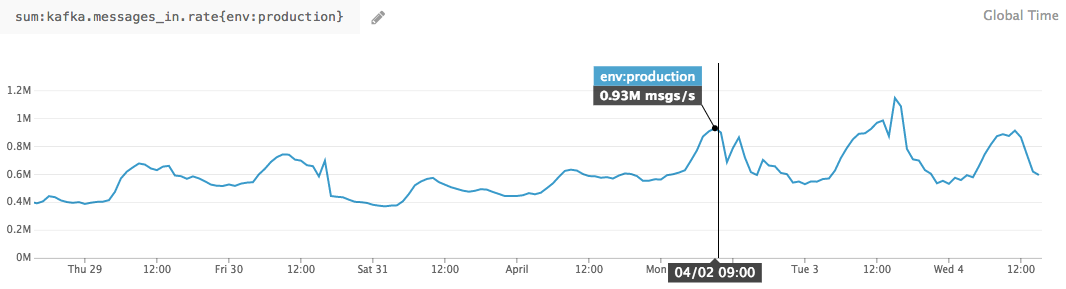
We've asked ourselves the same question. We already use Kafka extensively at Segment (we're passing nearly 1M messages per second through it), and it’s been the core building block of all of our streaming pipelines.
The problem with using any sort of queue is that you are fundamentally limited in terms of how you access data. After all, a queue only supports two operations (push and pop).
To see where queues break down, let's walk through a series of queueing topologies that we’ve implemented at Segment.
To start, let’s first consider a naive approach. We can run a group of workers that read jobs from a single queue.
Workers will read a single message off the queue, send to whatever third-party APIs are required and then acknowledge the message. It seems like it should protect us from failure, right?
This works okay for awhile, but what happens when we start seeing a single endpoint get slow? Unfortunately, it creates backpressure on the entire message flow.
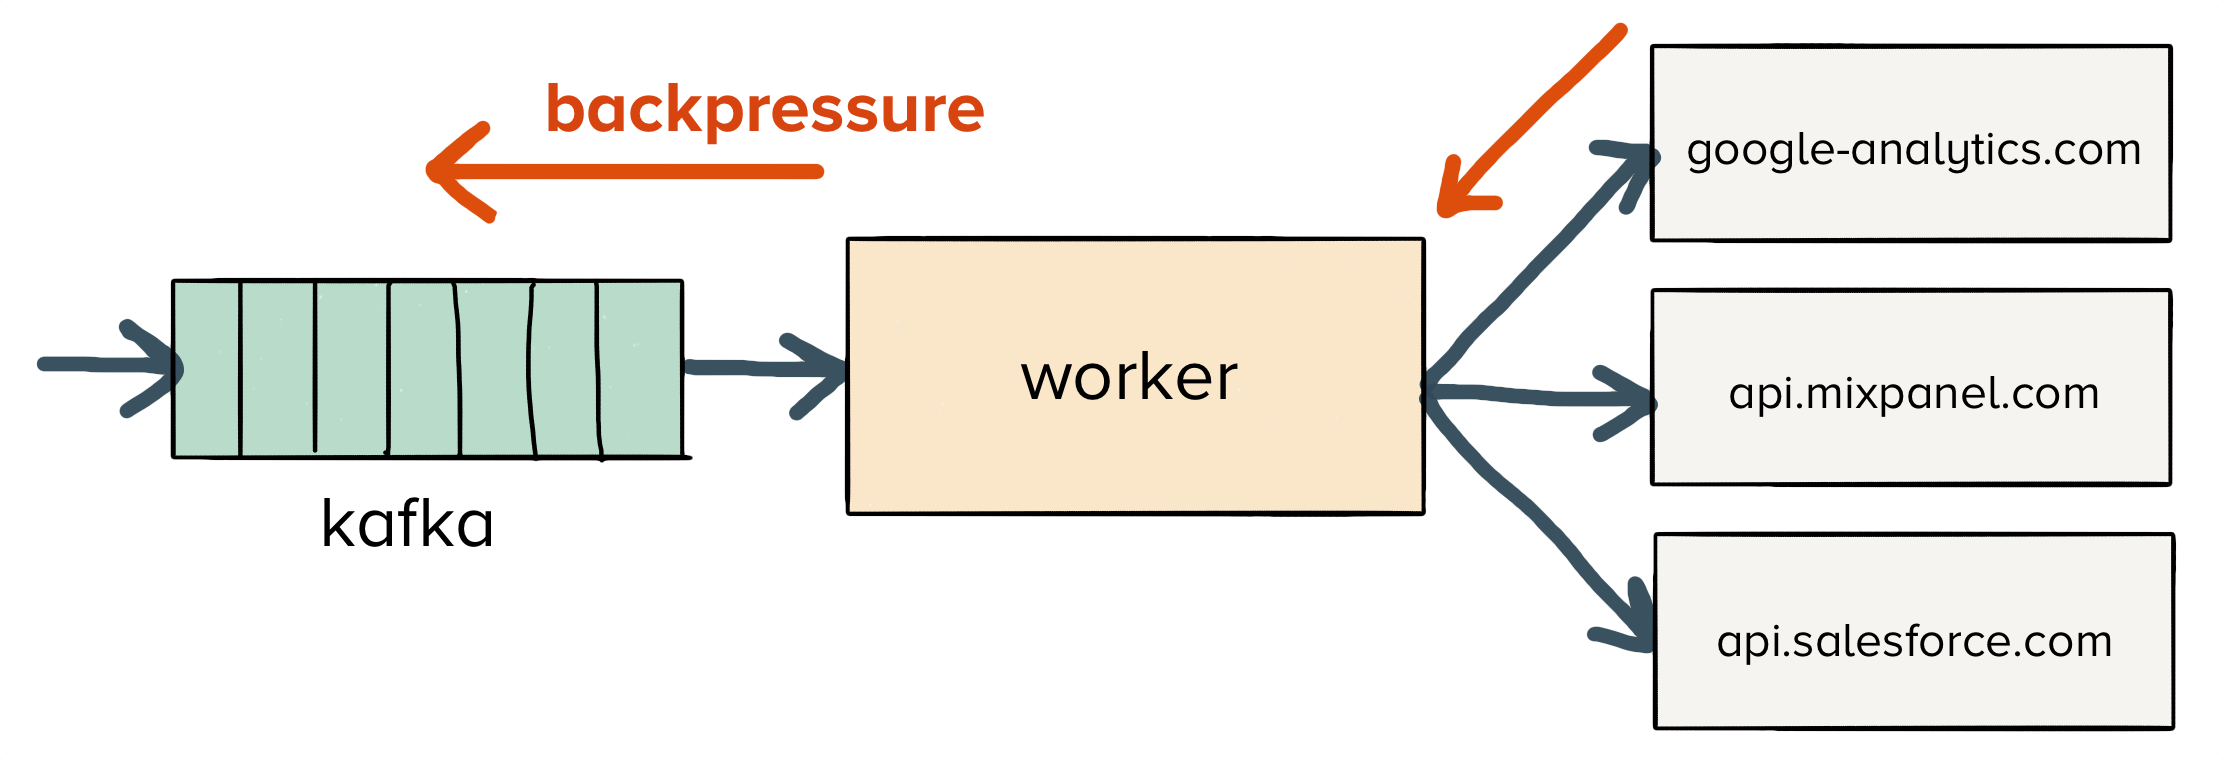
Clearly, this isn’t ideal. If a single endpoint can bring down the entire pipeline, and each endpoint has an hour-long downtime each year (99.9% available), then with 200+ endpoints, we’ll be seeing hour-long outages once per day.
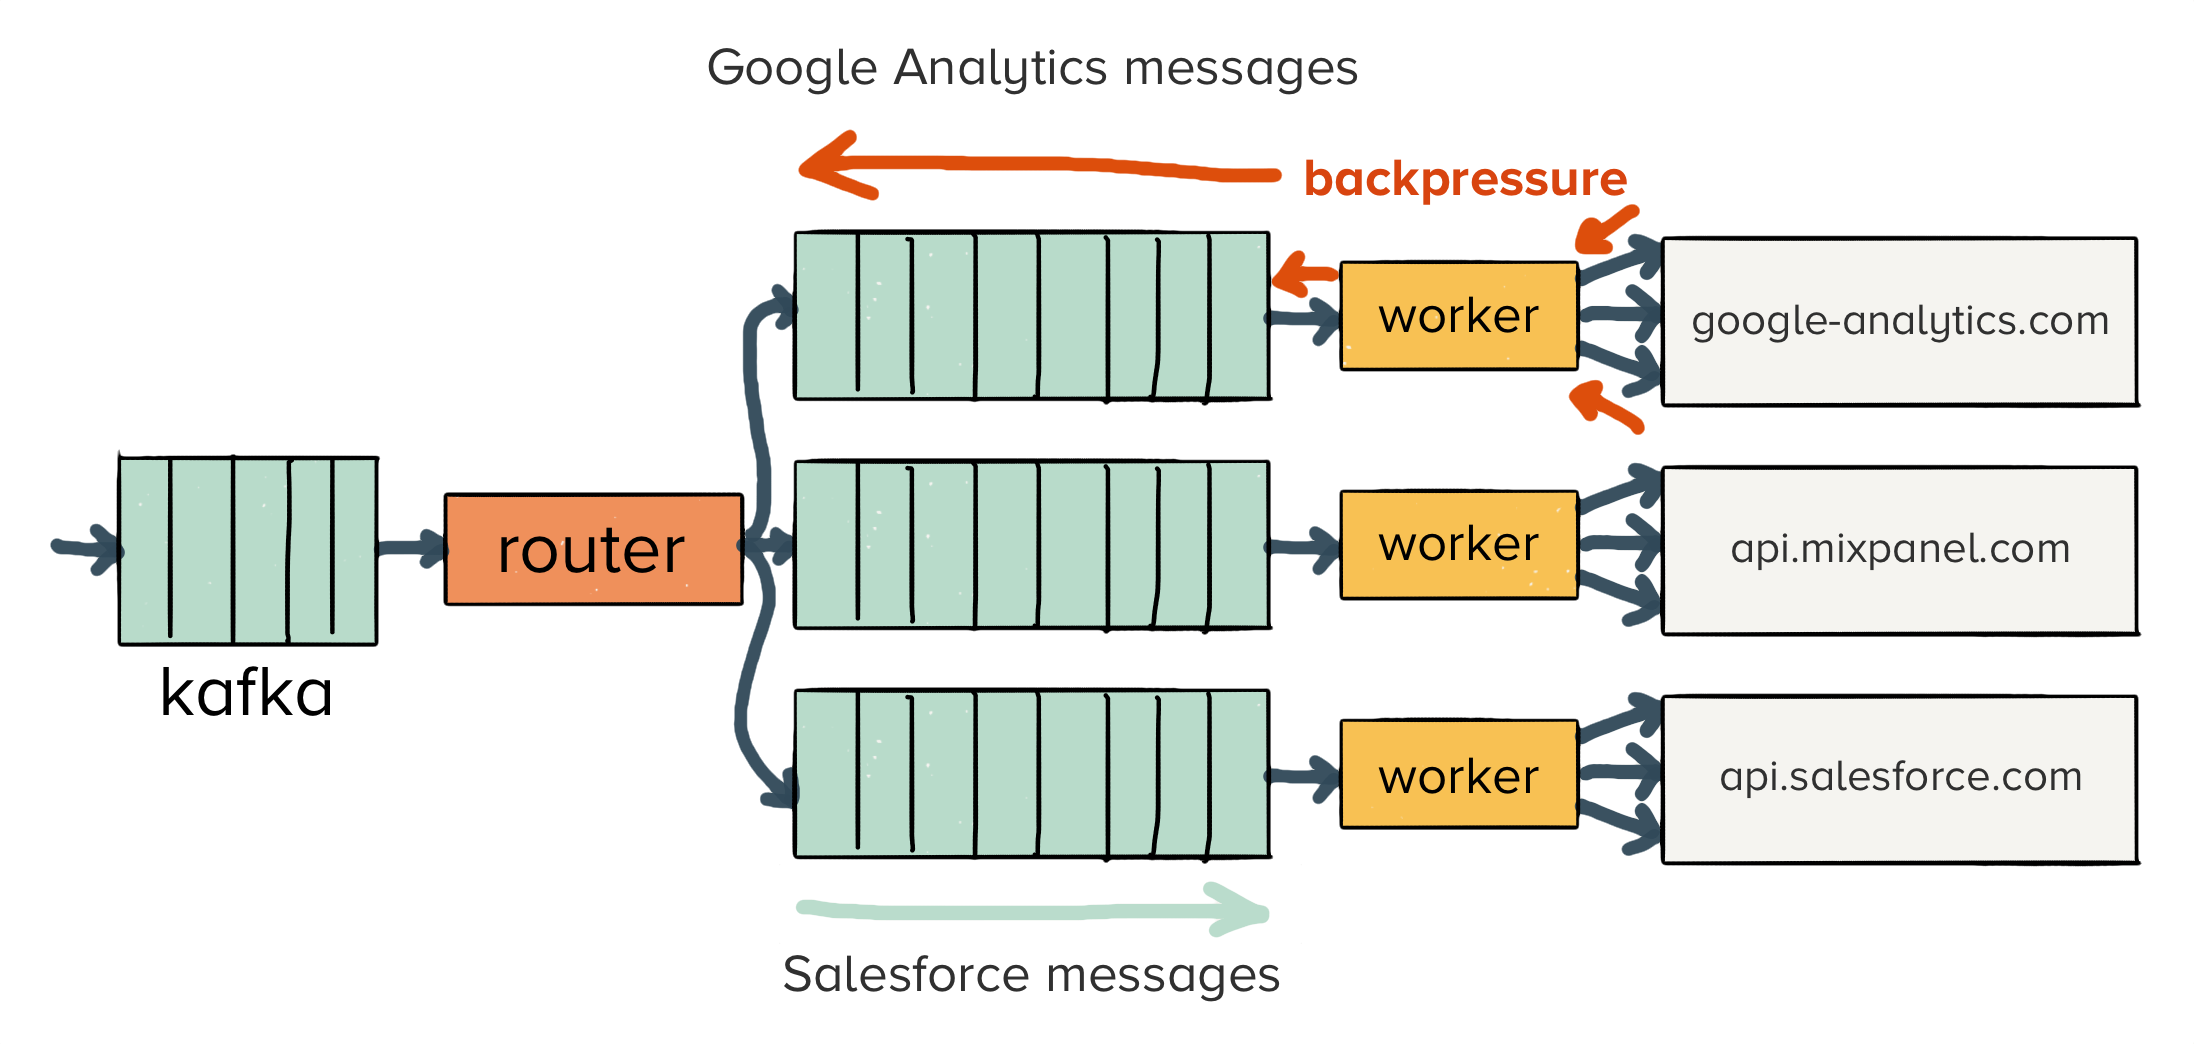
After seeing repeated slowdowns on our ingestion pipeline, we decided to re-architect. We updated our queueing topology to route events into separate queues based upon the downstream endpoints they would hit.
To do this, we added a router in front of each queue. The router would only publish messages to a queue destined for a specific API endpoint.
Suppose you had three destinations enabled: Google Analytics, Mixpanel, and Salesforce. The router would publish three messages, one to each dedicated queue for Google Analytics, Mixpanel, and Salesforce, respectively.
The benefit of this approach is that a single failing API will only affect messages bound for a single endpoint (which is what we want!).
Unfortunately, this approach has problems in practice. If we look at the distribution of messages which should be delivered to a single endpoint, things become a little more nuanced.
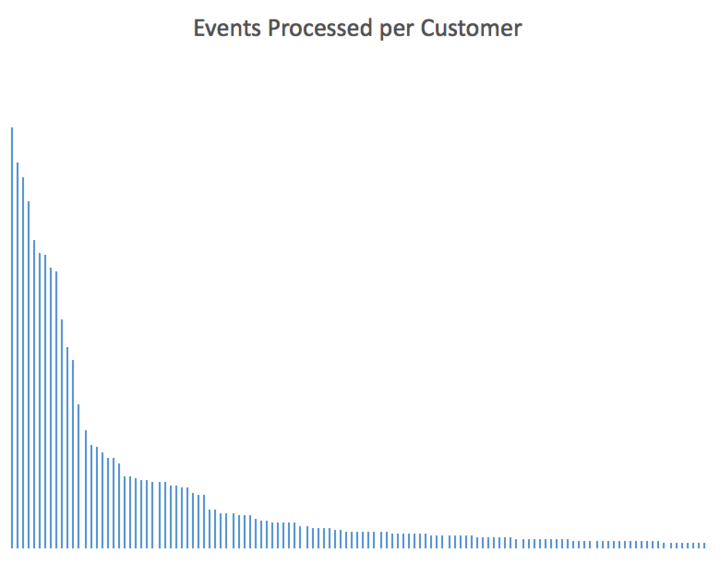
Segment is a large, multi-tenant system, so some sources of data will generate substantially more load than others. As you might imagine, among our customer base, this follows a fairly consistent power law:
When that translates to messages within our queues, the breakdown looks more like this:
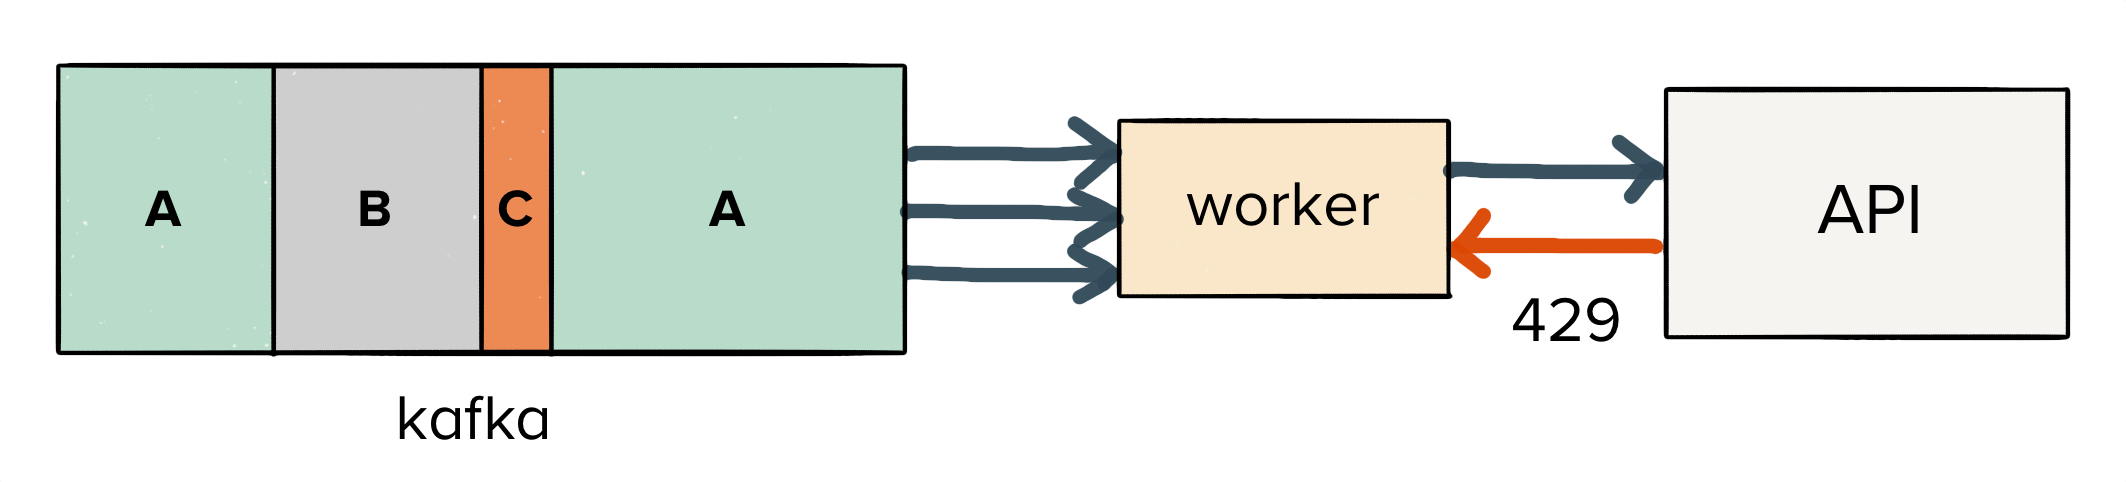
In this case, we have data for customers A, B, and C, all trying to send to the same downstream endpoint. Customer A dominates the load, but B and C have a handful of calls mixed in.
Let’s suppose that the API endpoint we are sending to is rated to 1,000 calls per second, per customer. When the endpoint receives more than 1,000 calls in a second for a given customer API key, it will respond with a 429 HTTP Header (rate limit exceeded).
Now let’s assume that customer A is trying to send 50,000 messages to the API. Those messages are all ordered contiguously in our queue.
At this point we have a few options:
we can try and send a hard cap of 1,000 messages per second, but this delays traffic for B and C by 50 seconds.
we can try and send more messages to the API for customer A, but we will see 429 (rate limit exceeded) errors. We’ll want to retry those failed messages, possibly causing more slowdowns for B and C.
we can detect that we are nearing a rate-limit after sending 1,000 messages for customer A in the first second, so we can then copy the next 49,000 messages for customer A into a dead-letter queue, and allow the traffic for B and C to proceed.
None of these options are ideal. We’ll either end up blocking the queue for all customers in the case where a single customer sends a large batch of data, or we’ll end up copying terabytes of data between dead-letter queues.
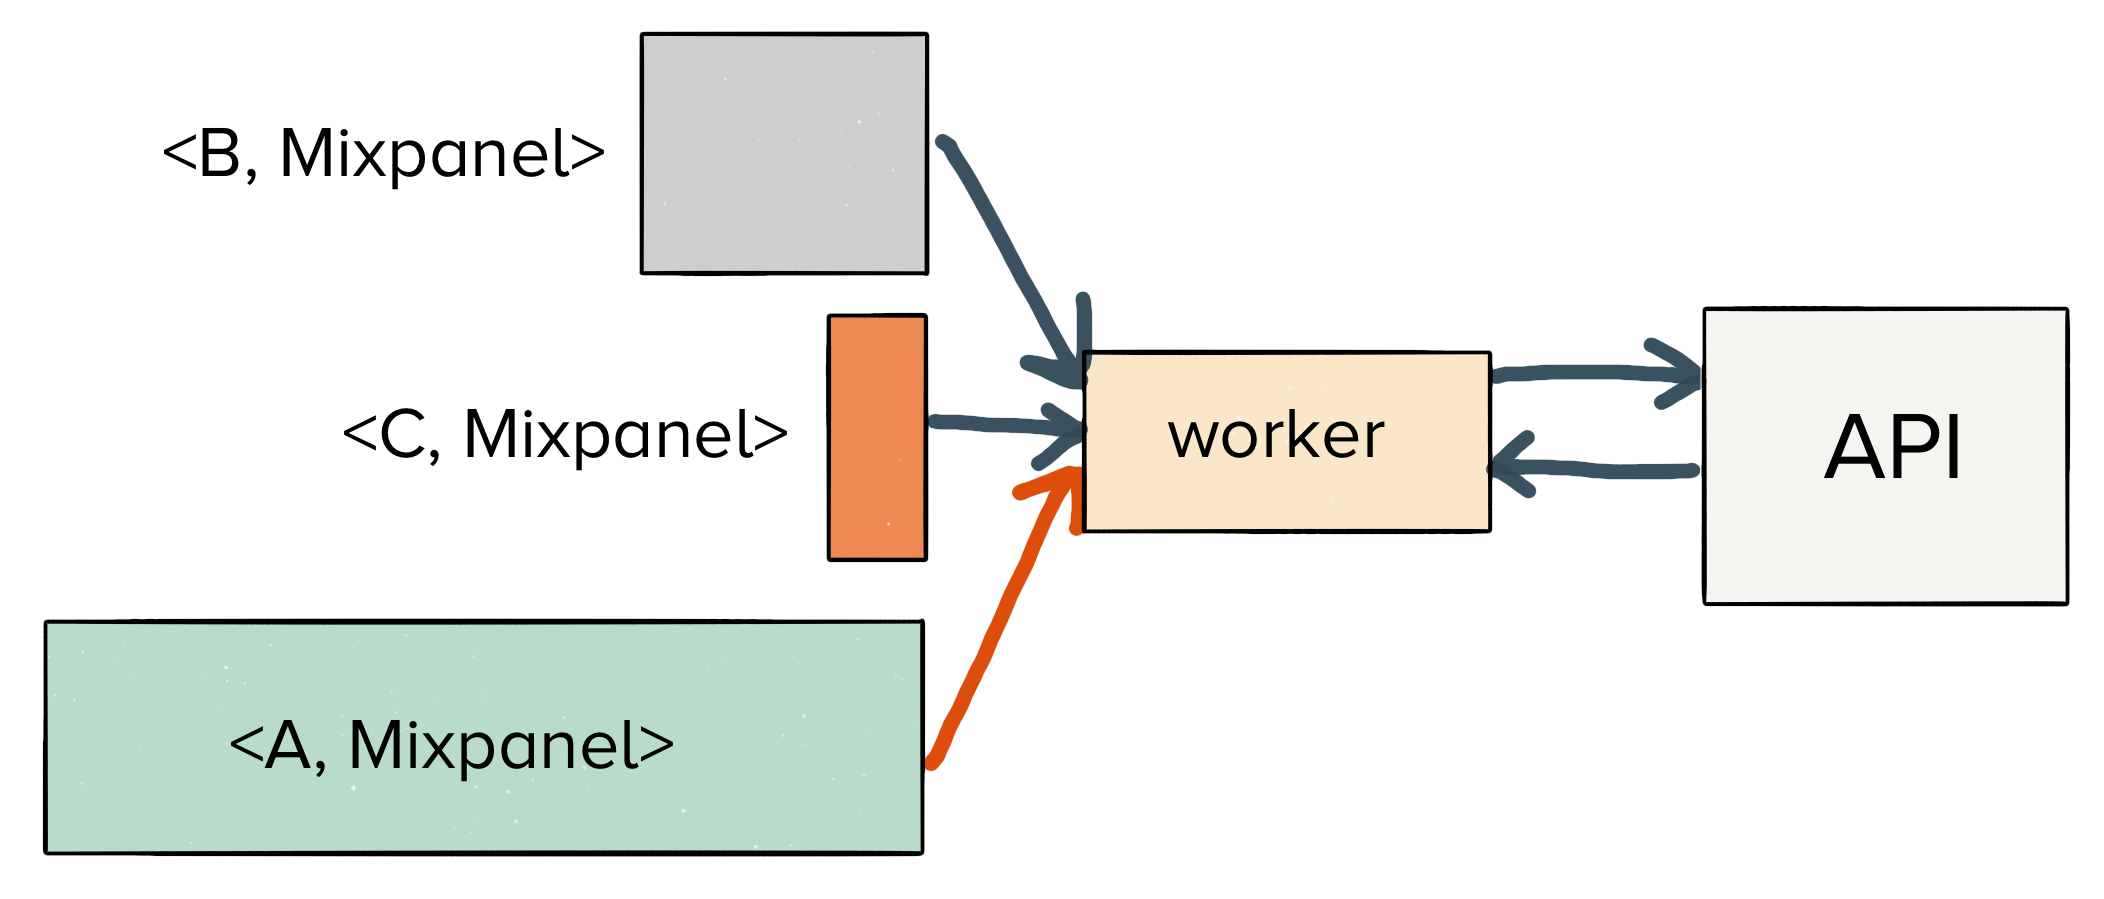
Instead, we want an architecture that looks more like the following diagram, where we have separate queues per combination of customer and endpoint. This architecture gives us much better isolation, as well as the ability to dynamically adjust throughput on a per-customer basis.
However, in a large, multi-tenant system, like Segment, this number of queues becomes difficult to manage.
We have hundreds of thousands of these source-destination pairs. Today, we have 42,000 active sources of data sending to an average of 2.1 downstream endpoints. That’s 88,000 total queues that we’d like to support (and we’re growing quickly).
To implement per source-destination queues with full isolation, we’d need hundreds of thousands of different queues. Across Kafka, RabbitMQ, NSQ, or Kinesis–we haven’t seen any queues which support that level of cardinality with simple scaling primitives. SQS is the only queue we’ve found which manages to do this, but is totally cost prohibitive. We need a new primitive to solve this problem of high-cardinality isolation.
We now have our ideal end-state: tens of thousands of little queues. Amongst those queues, we can easily decide to consume messages at different rates from Customers A, B, and C.
But when we start to think about implementation, how do we actually manage that many queues?
We started with a few core requirements for our virtual queue system:
1) Provide per-customer isolation
First and foremost, we need to provide per-customer isolation. One customer sending a significant amount of failing traffic shouldn’t slow down any other data delivery. Our system must absorb failures without slowing the global delivery rate.
2) Allow us to re-order messages without copying terabytes of data
Our second constraint is that our system must be able to quickly shuffle its delivery order without copying terabytes of data over the network.
In our experience working with large datasets, having the ability to immediately re-order messages for delivery is essential. We’ve frequently run into cases which create large backlogs in data processing, where our consumers are spinning on a set of consistently failing messages.
Traditionally there are two ways to handle a large set of bad messages. The first is to stop your consumers and retry the same set of messages after a backoff period. This is clearly unacceptable in a multi-tenant architecture, where valid messages should still be delivered.
The second technique is to publish failed messages to a dead-letter queue and re-consume them later. Unfortunately, re-publishing messages to dead-letter queues or ‘tiers’ of topics with copies of the same event incurs significant storage and network overhead.
In either case, if your data is sitting in Kafka–the delivery order for your messages is effectively ‘set’ by the producer to the topic:
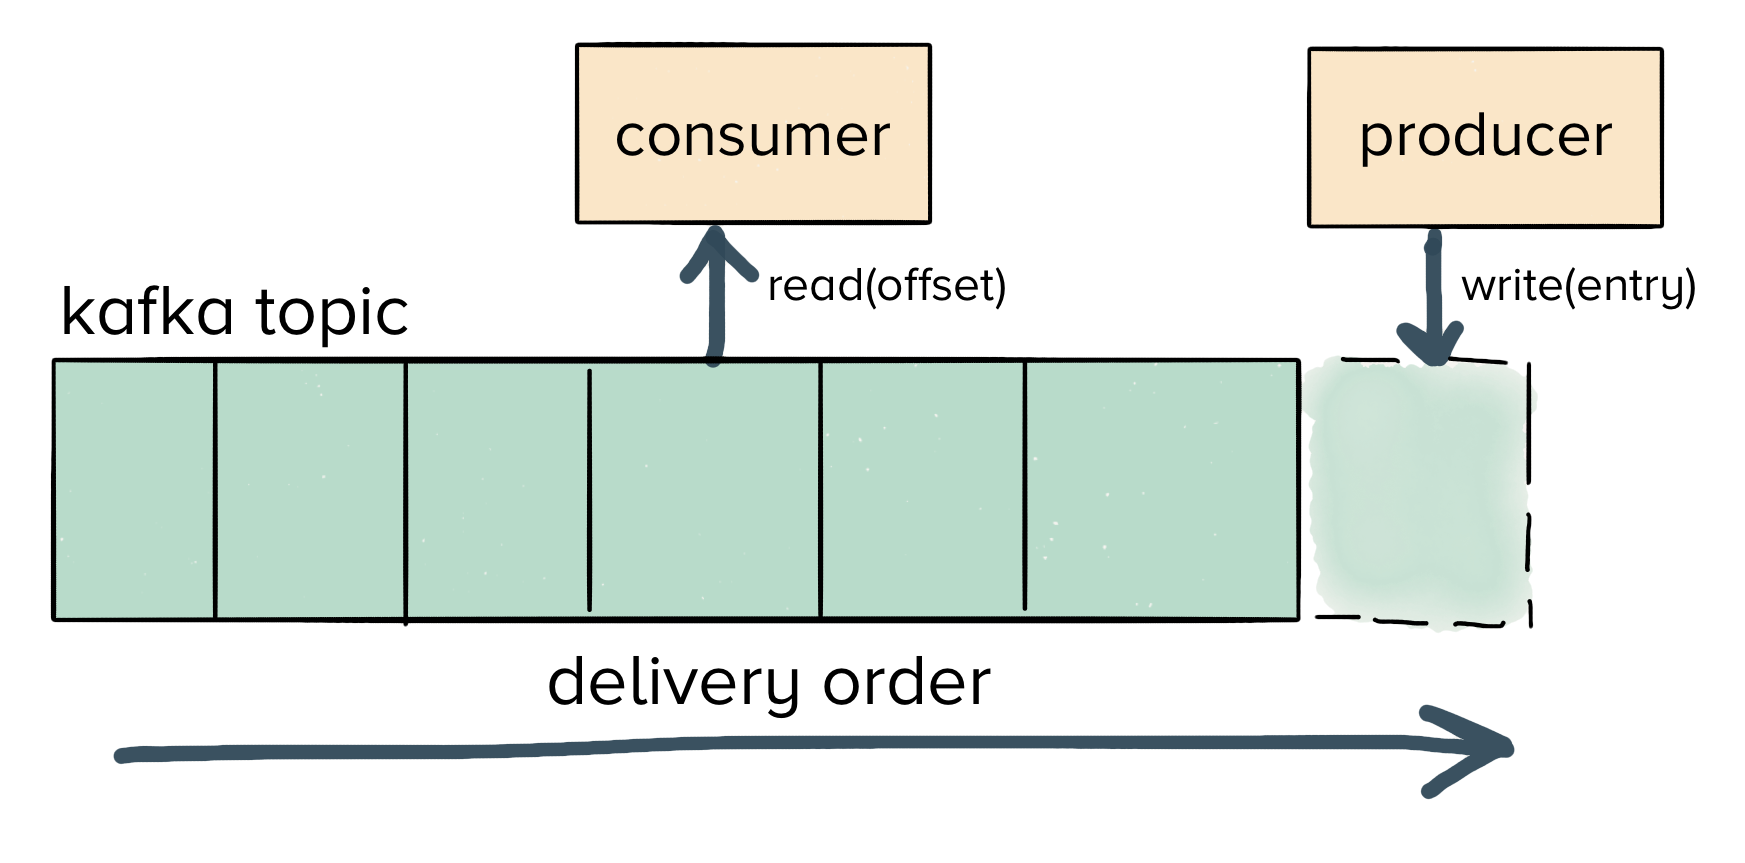
We want the ability to quickly recover from errors without having to shuffle terabytes of data around the network. So neither of these approaches works efficiently for us.
3) Evenly distribute the workload between many different workers
Finally, we need a system which cleanly scales as we increase our event volume. We don’t want to be continually adding partitions or doing additional sharding as we add customers. Our system should scale out horizontally based upon the throughput of traffic that we need.
By this point, we have a good idea of the problems that Centrifuge solves (reliable message delivery), the issues of various queueing topologies, and our core requirements. So let’s look at the Centrifuge data layer to understand how we’ve solved for the constraints we just listed above.
The core delivery unit of Centrifuge is what we call a job.
Jobs require both a payload of data to send, as well an endpoint indicating where to send the data. You can optionally supply headers to govern things like retry logic, message encoding, and timeout behavior.
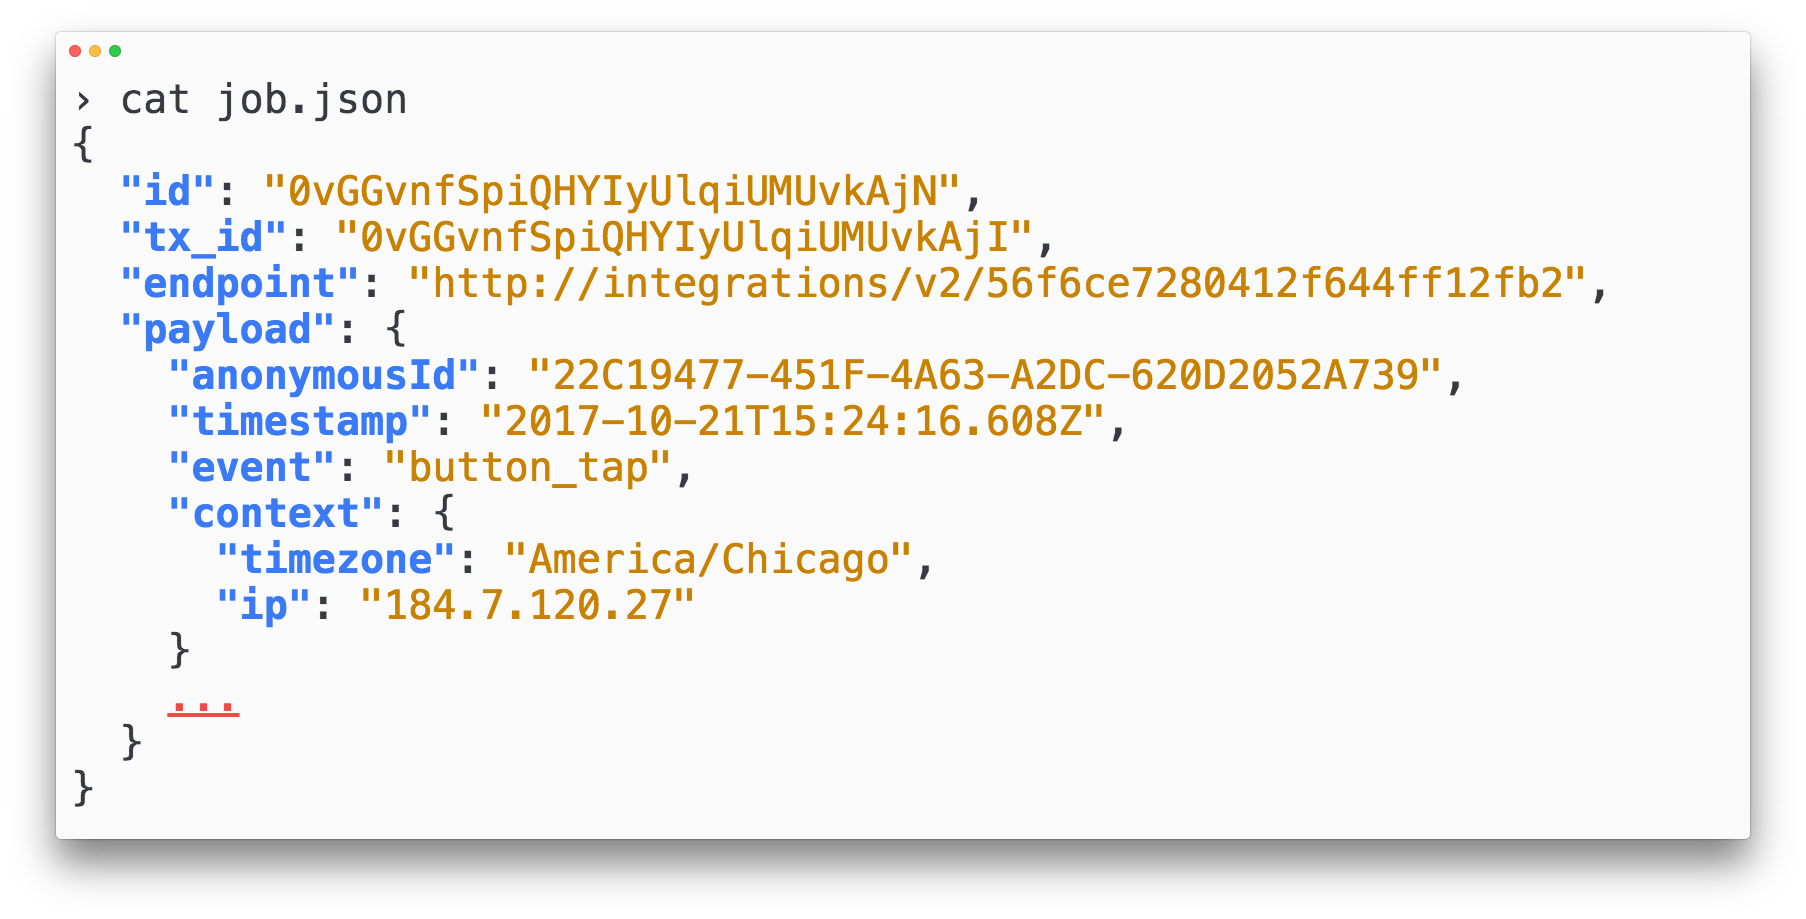
In our case, a job is a single event which should be delivered to a partner API. To give you an idea of what jobs look like in practice, here’s a sample Segment job:
Looking back at our requirements, we want a way of quickly altering the delivery order for our jobs, without having to create many copies of the jobs themselves.
A queue won’t solve this problem in-place for us. Our consumer would have to read and then re-write all of the data in our new ordering. But a database, on the other hand, does.
By storing the execution order inside a relational database, we can immediately change the quality of service by running a single SQL statement.
Similarly, whenever we want to change the delivery semantics for our messages, we don’t have to re-shuffle terabytes of data or double-publish to a new datastore. Instead, we can just deploy a new version of our service, and it can start using the new queries right away.
Using a database gives us the flexibility in execution that queues are critically lacking.
For that reason, we decided to store Centrifuge data inside Amazon’s RDS instances running on MySQL. RDS gives us managed datastores, and MySQL provides us with the ability to re-order our jobs.
The Centrifuge database model has a few core properties that allow it to perform well:
immutable rows: we don’t want to be frequently updating rows, and instead be appending new rows whenever new states are entered. We’ve modeled all job execution plans as completely immutable, so we never run updates in the database itself.
no database JOINs: rather than needing a lot of coordination, with locks across databases or tables, Centrifuge need only query data on a per job basis. This allows us to massively parallelize our databases since we never need to join data across separate jobs.
predominantly write-heavy, with a small working set: because Centrifuge is mostly accepting and delivering new data, we don’t end up reading from the database. Instead, we can cache most new items in memory, and then age entries out of cache as they are delivered.
To give you a sense of how these three properties interact, let’s take a closer look at how jobs are actually stored in our Centrifuge databases.
The jobs table
First, we have the jobs table. This table is responsible for storing all jobs and payloads, including the metadata governing how jobs should be delivered.
While the endpoint, payload, and headers fields govern message transmission, the expire_at field is used to indicate when a given job should be archived.
By splitting expire_at into a separate field, our operations team can easily adjust if we ever need to flush a large number of failing messages to S3, so that we can process them out-of-band.
Looking at the indexes for the jobs table, we’ve been careful to minimize the overhead of building and maintaining indexes on each field. We keep only a single index on the primary key.
The jobs table primary key is a KSUID, which means that our IDs are both are k-sortable by timestamp as well as globally unique. This allows us to effectively kill two birds with one stone–we can query by a single job ID, as well as sort by the time that the job was created with a single index.
Since the median size of the payload and settings for a single job is about 5kb (and can be as big as 750kb), we’ve done our best to limit reads from and updates to the jobs table.
Under normal operation, the jobs table is immutable and append-only. The golang process responsible for inserting jobs (which we call a Director) keeps a cached version of the payloads and settings in-memory. Most of the time, jobs can be immediately expired from memory after they are delivered, keeping our overall memory footprint low.
In production, we set our jobs to expire after 4 hours, with an exponential backoff strategy.
Of course, we also want to keep track of what state each job is in, whether it is waiting to be delivered, in the process of executing, or awaiting retry. For that, we use a separate table, the job_state_transitions table.
The job state transitions table
The job_state_transitions table is responsible for logging all of the state transitions a single job may pass through.
Within the database, the job state machine looks like this:
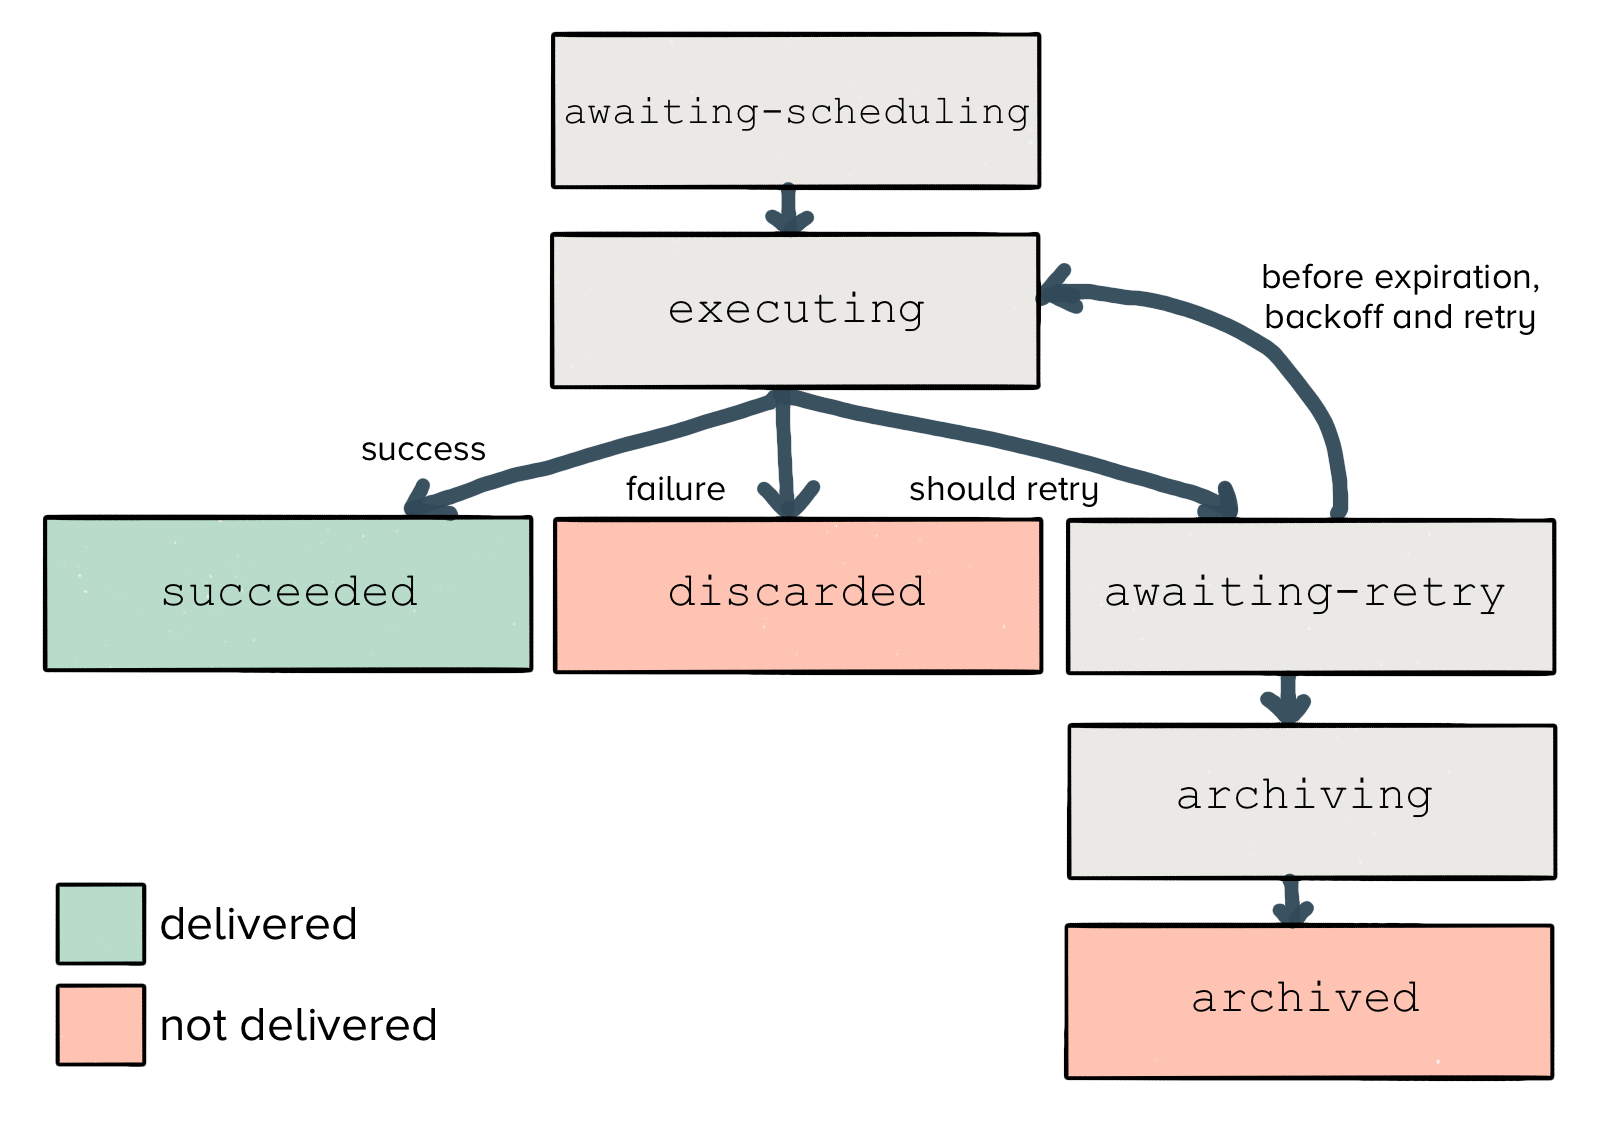
A job first enters with the awaiting_scheduling state. It has yet to be executed and delivered to the downstream endpoint.
From there, a job will begin executing, and the result will transition to one of three separate states.
If the job succeeds (and receives a 200 HTTP response from the endpoint), Centrifuge will mark the job as succeeded. There’s nothing more to be done here, and we can expire it from our in-memory cache.
Similarly, if the job fails (in the case of a 400 HTTP response), then Centrifuge will mark the job as discarded. Even if we try to re-send the same job multiple times, the server will reject it. So we’ve reached another terminal state.
However, it’s possible that we may hit an ephemeral failure like a timeout, network disconnect, or a 500 response code. In this case, retrying can actually bring up our delivery rate for the data we collect (we see this happen across roughly 1.5% of the data for our entire userbase), so we will retry delivery.
Finally, any jobs which exceed their expiration time transition from awaiting_retry to archiving. Once they are successfully stored on S3, the jobs are finally transitioned to a terminal archived state.
If we look deeper into the transitions, we can see the fields governing this execution:
Like the jobs table, rows in the job_state_transitions are also immutable and append-only. Every time a new attempt is made, the attempt number is increased. Upon job execution failure, the retry is scheduled with a retry_at time by the retry behavior specified in the job itself.
In terms of indexing strategy, we keep a composite index on two fields: a monotonically incrementing ID, as well the ID of the job that is being executed.
You can see here in one of our production databases that the first index in the sequence is always on the job_id, which is guaranteed to be globally unique. From there, the incrementing ID ensures that each entry in the transitions table for a single job’s execution is sequential.
To give you a flavor of what this looks like in action, here’s a sample execution trace for a single job pulled from production.
Notice that the job first starts in the awaiting-scheduling state before quickly transitioning to its first delivery attempt. From there, the job consistently fails, so it oscillates between executing and awaiting-retry.
While this trace is certainly useful for internal debugging, the main benefit it provides is the ability to actually surface the execution path for a given event to the end customer. (Stay tuned for this feature, coming soon!)
Up until this point, we’ve focused exclusively on the data model for our jobs. We’ve shown how they are stored in our RDS instance, and how the jobs table and jobs_state_transitions table are both populated.
But we still need to understand the service writing data to the database and actually executing our HTTP requests. We call this service the Centrifuge Director.
Traditionally, web-services have many readers and writers interacting with a single, centralized database. There is a stateless application tier, which is backed by any number of sharded databases.
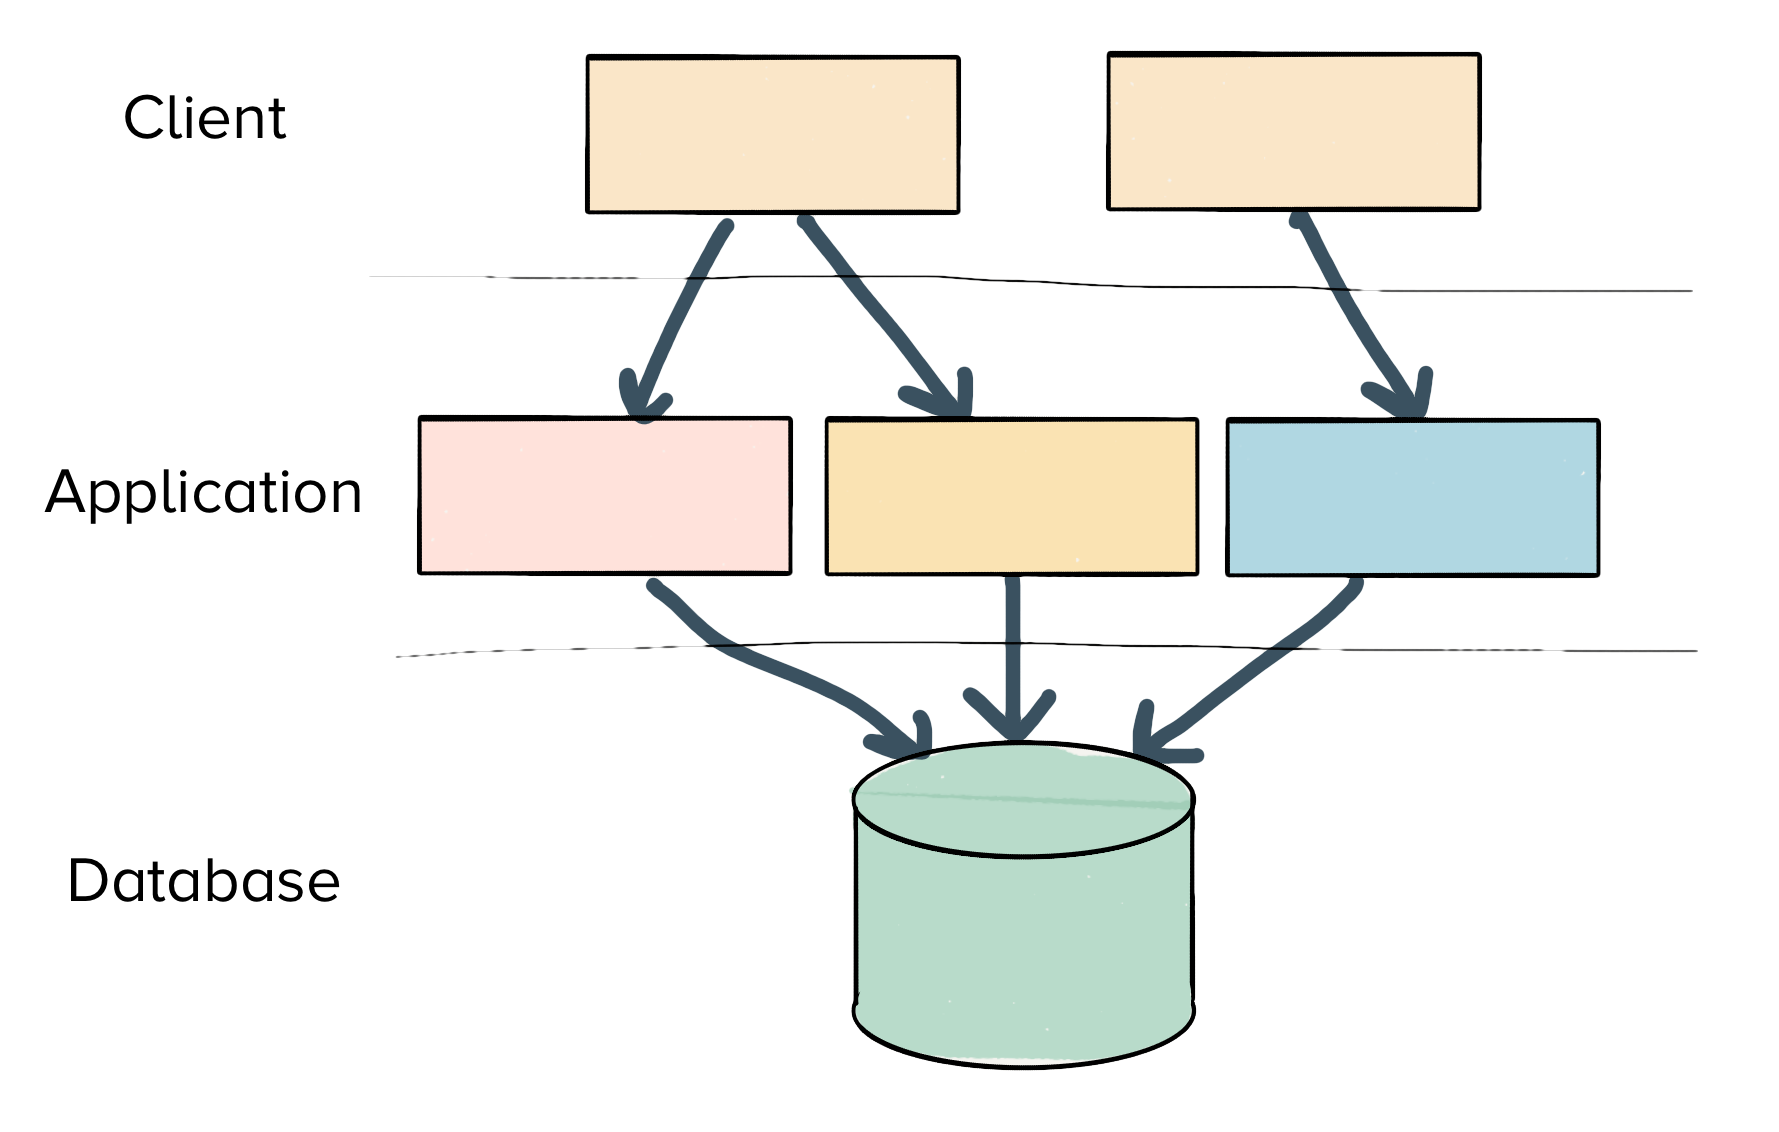
Remember though, that Segment’s workload looks very different than a traditional web-service.
Our workload is extremely write-heavy, has no reads, and requires no JOINs or query coordination across separate jobs. Instead, our goal is to minimize the contention between separate writers to keep the writes as fast as possible.
To do that, we’ve adopted an architecture where a single Director interacts with a given database. The Director manages all of its caching, locks, and querying in-process. Because the Director is the sole writer, it can manage all of its cache invalidations with zero-coordination.
The only thing a Director needs to globally coordinate is to which particular database it is writing. We call the attached database a JobDB, and what follows is a view into the architecture for how Directors coordinate to acquire and send messages to a JobDB.
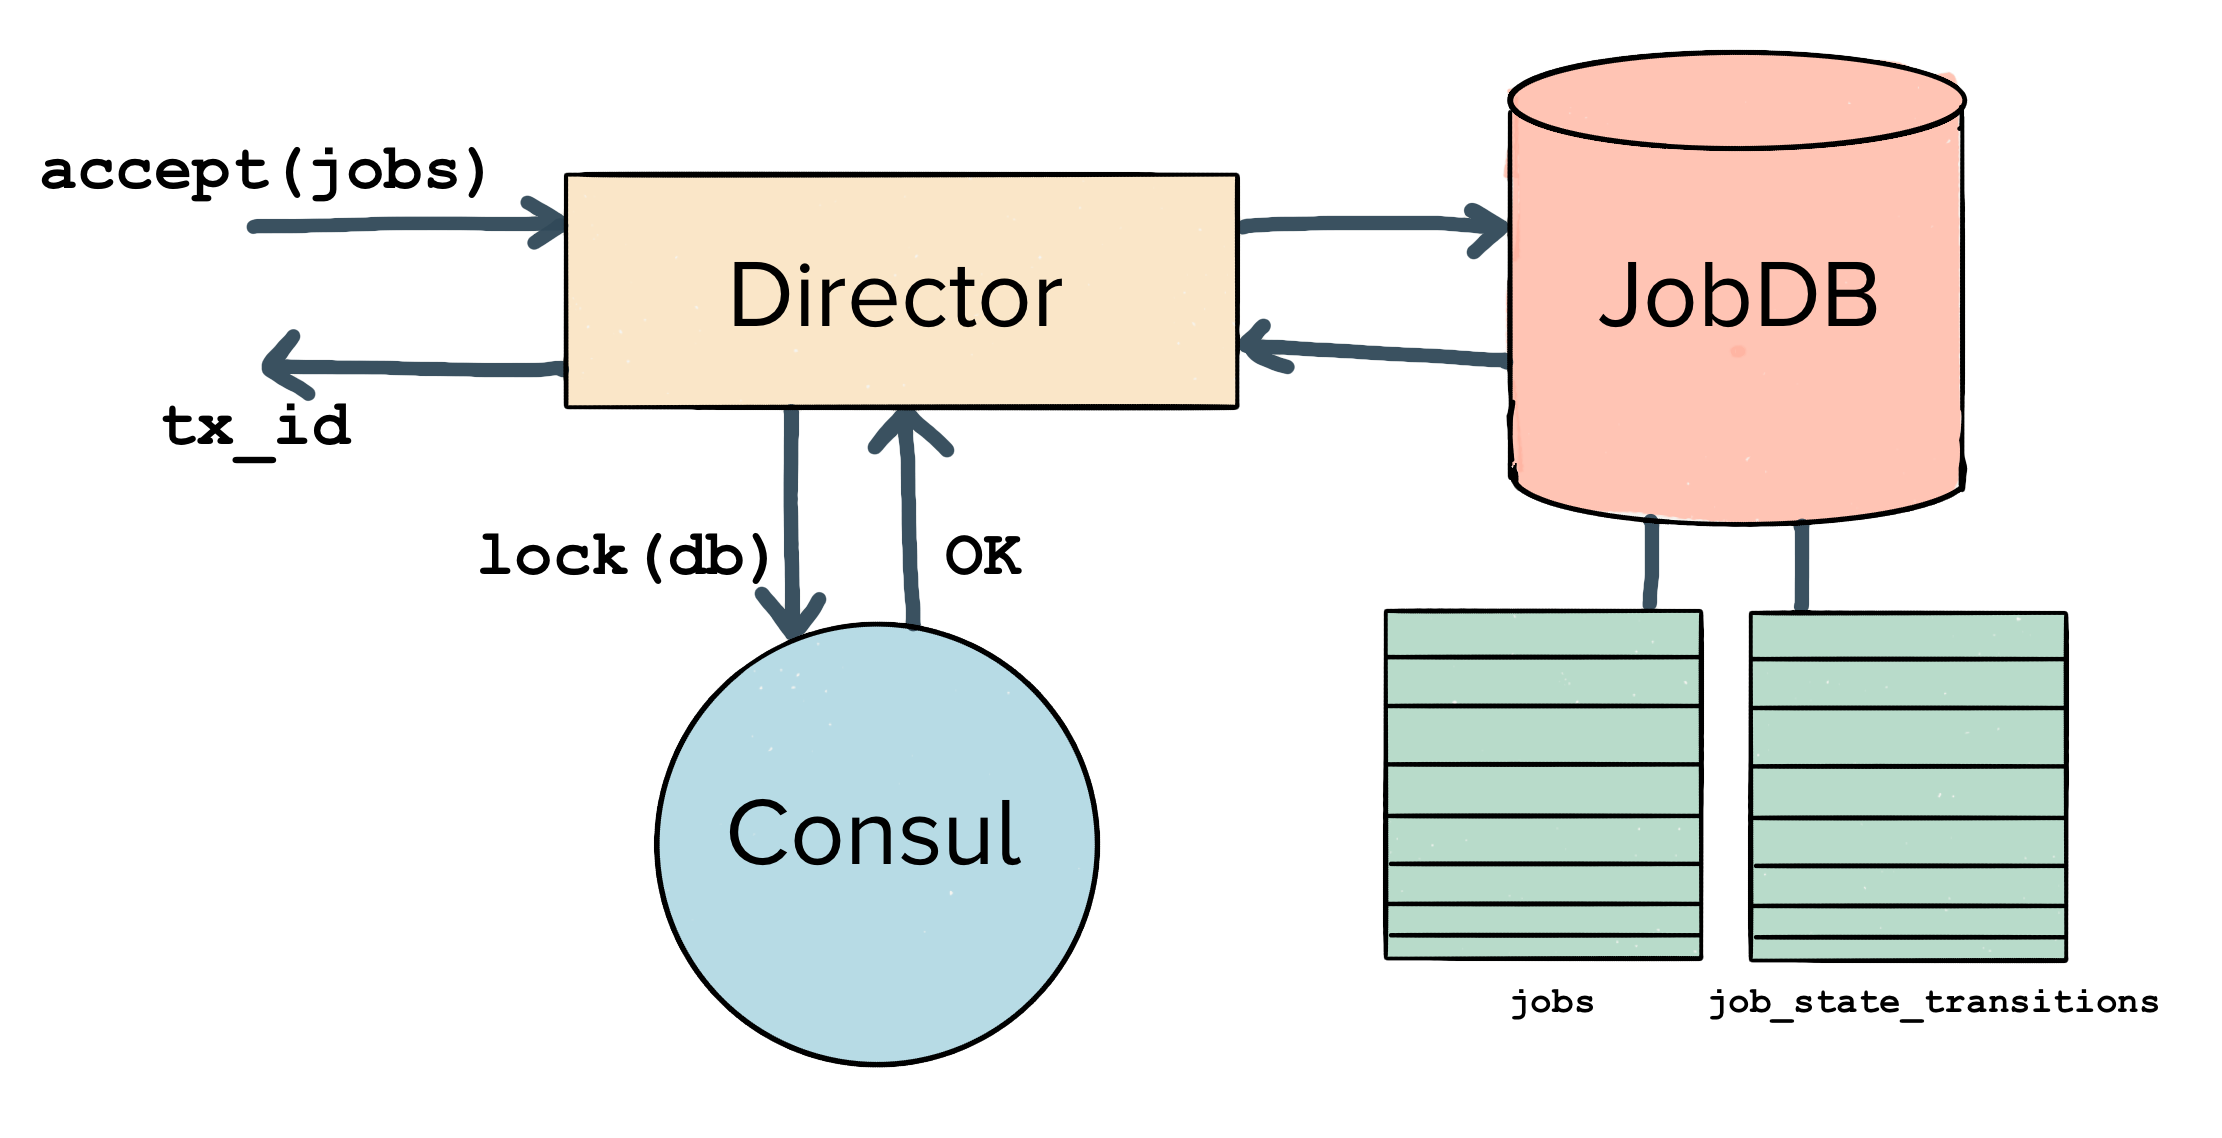
When a Director first boots up, it follows the following lifecycle:
Acquire a spare JobDB via Consul – to begin operating; a Director first does a lookup and acquires a consul session on the key for a given JobDB. If another Director already holds the lock, the current Director will retry until it finds an available spare JobDB.
Consul sessions ensure that a given database is never concurrently written to by multiple Directors. They are mutually exclusive and held by a single writer. Sessions also allow us to lock an entire keyspace so that a director can freely update the status for the JobDB in Consul while it continues to hold the lock.
Connect to the JobDB, and create new tables – once a Director has connected to a spare JobDB, it needs to create the necessary tables within the connected DB.
Rather than use an ORM layer, we’ve used the standard database/sql golang interface, backed by the go-sql-driver/mysql implementation. Many of these queries and prepared statements are generated via go:generate, but a handful are handwritten.
Begin listening for new jobs and register itself in Consul – after the Director has finished creating the necessary tables, it registers itself in Consul so that clients may start sending the Director traffic.
Start executing jobs – once the Director is fully running, it begins accepting jobs. Those jobs are first logged to the paired JobDB; then the Director begins delivering each job to its specified endpoint.
Now that we understand the relationship between Directors and JobDBs, we can look back at the properties of the system (immutable, extremely write-heavy with a small working set, no database JOINs), and understand how Centrifuge is able to quickly absorb traffic.
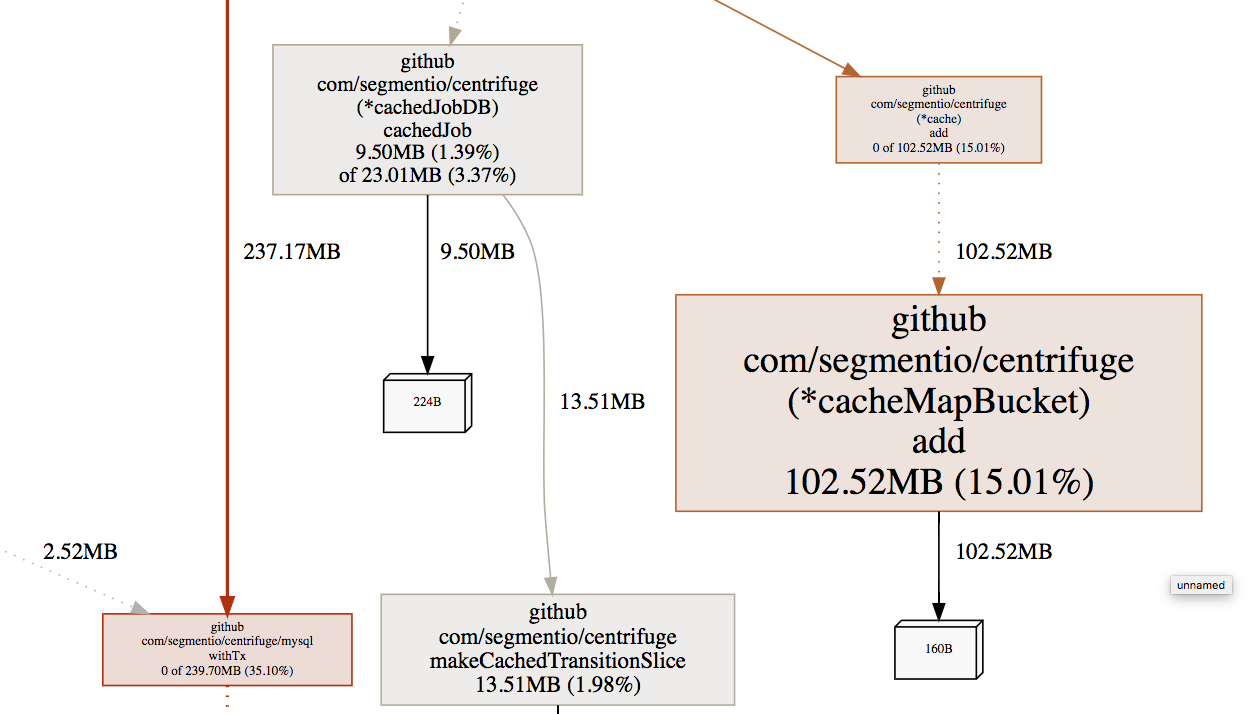
Under normal operation, the Director rarely has to read from the attached JobDB. Because all jobs are immutable and the Director is the sole writer, it can cache all jobs in-memory and expire them immediately once they are delivered. The only time it needs to read from the database is when recovering from a failure.
Looking at the pprof for our memory profile, we can see that a significant proportion of heap objects do indeed fall into the category of cached jobs:
And thanks to the cache, our writes dominate our reads. Here’s the example Cloudwatch metrics that we pulled from a single active database.
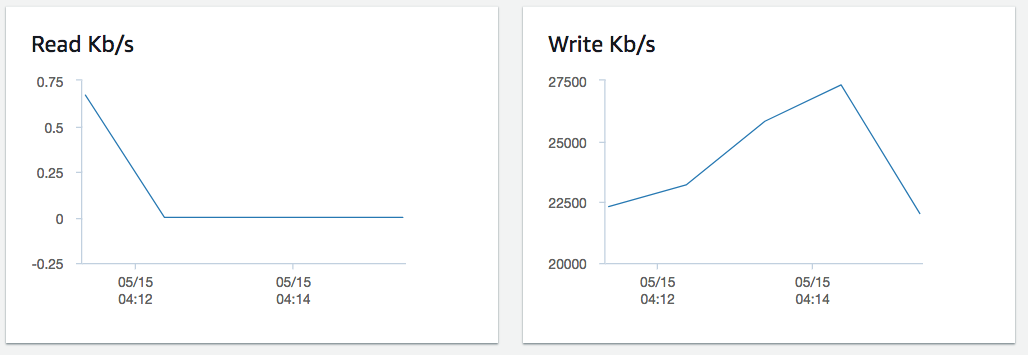
Since all jobs are extremely short-lived (typically only a few hundred milliseconds while it is being executed), we can quickly expire delivered jobs from our cache.
Taking a step back, we can now combine the concepts of the Centrifuge data model with the Director and JobDB.
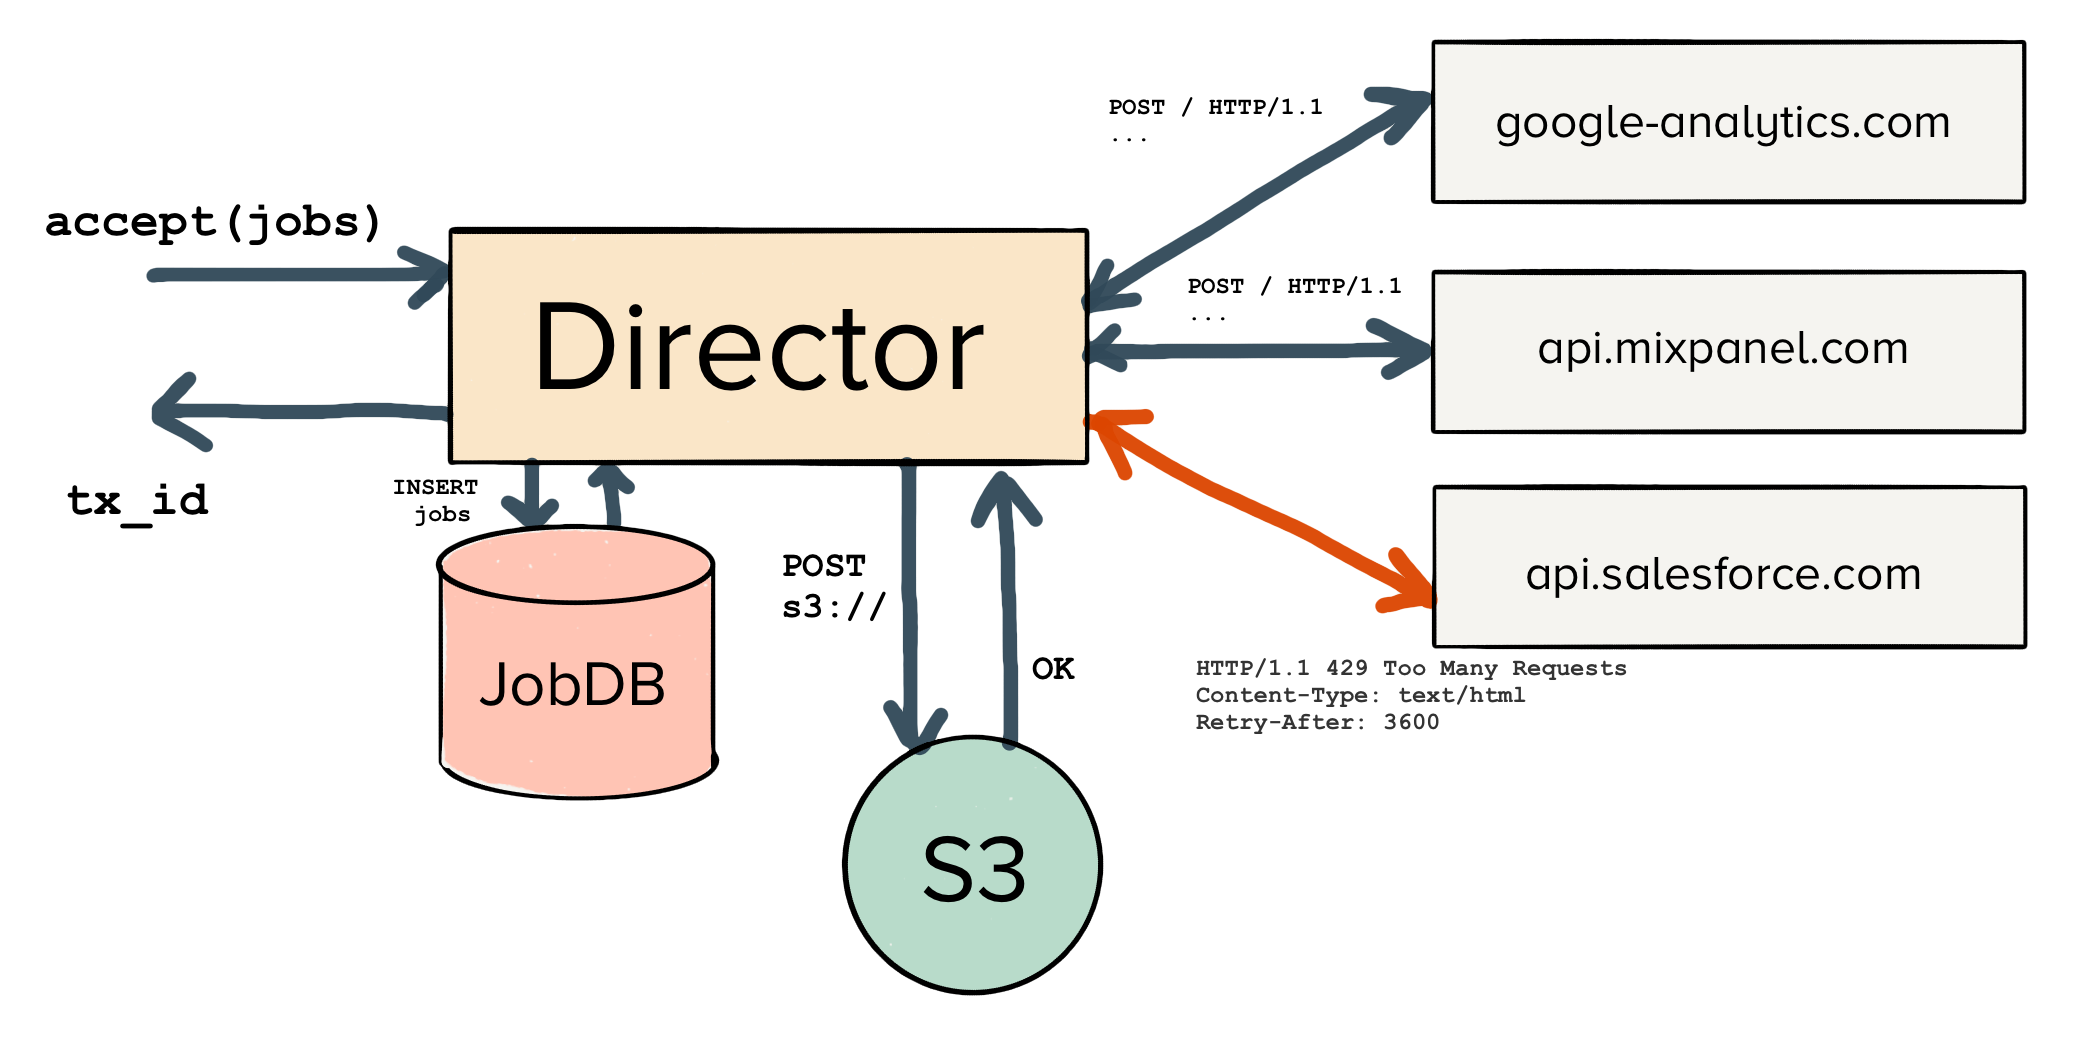
First, the Director is responsible for accepting new jobs via RPC. When it receives the RPC request, it will go ahead and log those jobs to the attached JobDB, and respond with a transaction ID once the jobs have been successfully persisted.
From there, the Director makes requests to all of the specified endpoints, retrying jobs where necessary, and logging all state transitions to the JobDB.
If the Director fails to deliver any jobs after their expiration time (4 hours in our case), they are archived on S3 to be re-processed later.
Of course, a single Director wouldn’t be able to handle all of the load on our system.
In production, we run many of individual Directors, each one which can handle a small slice of our traffic. Over the past month, we’ve been running anywhere from 80 to 300 Directors at peak load.
Like all of our other services at Segment, the Directors scale themselves up and down based upon CPU usage. If our system starts running under load, ECS auto-scaling rules will add Directors. If we are over capacity, ECS removes them.
However, Centrifuge created an interesting new motion for us. We needed to appropriately scale our storage layer (individual JobDBs) up and down to match the scaling in our compute layer (instances of Director containers).
To do that, we created a separate binary called the JobDB Manager. The Manager’s job is to constantly adjust the number of databases to match the number of Directors. It keeps a pool of ‘spare’ databases around in case we need to scale up suddenly. And it will retire old databases during off-peak hours.
To keep the ‘small working set’ even smaller, we cycle these JobDBs roughly every 30 minutes. The manager cycles JobDBs when their target of filled percentage data is about to exceed available RAM.
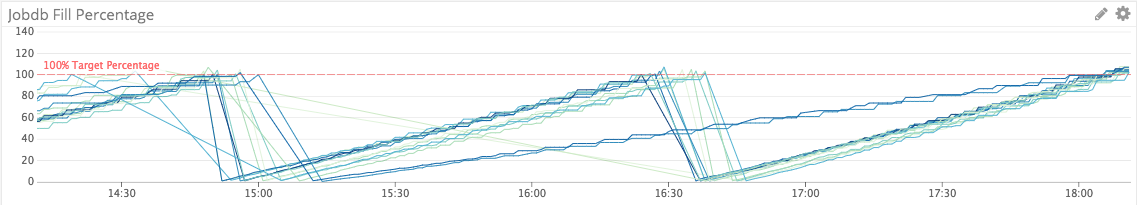
This cycling of databases ensures that no single database is slowing down because it has to keep growing its memory outside of RAM.
Instead of issuing a large number of random deletes, we end up batching the deletes into a single drop table for better performance. And if a Director exits and has to restart, it must only read a small amount of data from the JobDB into memory.
By the time 30 minutes have passed, 99.9% of all events have either failed or been delivered, and a small subset are currently in the process of being retried. The manager is then responsible for pairing a small drainer process with each JobDB, which will migrate currently retrying jobs into another database before fully dropping the existing tables.
Today, we are using Centrifuge to fully deliver all events through Segment. By the numbers this means:
800 commits from 5 engineers
50,000 lines of Go code
9 months of build, correctness testing, and deployment to production
400,000 outbound HTTP requests per second
2 million load-tested HTTP requests per second
340 billion jobs executed in the last month
On average, we find about 1.5% of all global data succeeds on a retry, where it did not succeed on the first delivery attempt.
Depending on your perspective, 1.5% may or may not sound like a big number. For an early-stage startup, 1.5% accuracy is almost meaningless. For a large retailer making billions of dollars in revenue, 1.5% accuracy is incredibly significant.
On the graph below, you can see all successful retries split by ‘attempt number’. We typically deliver the majority of messages on their second try (the large yellow bar), but about 50% of retries succeed only on the third through the tenth attempts.
Of course, seeing the system operate at ‘steady-state’ isn’t really the most interesting part of Centrifuge. It’s designed to absorb traffic in high-load failure scenarios.
We had tested many of these scenarios in a staging account, but had yet to really see a third-party outage happen in production. One month after the full rollout, we finally got to observe the system operating in a high-failure state.
At 4:45 pm on March 17th, one of our more popular integrations started reporting high latencies and elevated 500s. Under normal operation, this API receives 16,000 requests per second, which is a fairly significant portion of our outbound traffic load.
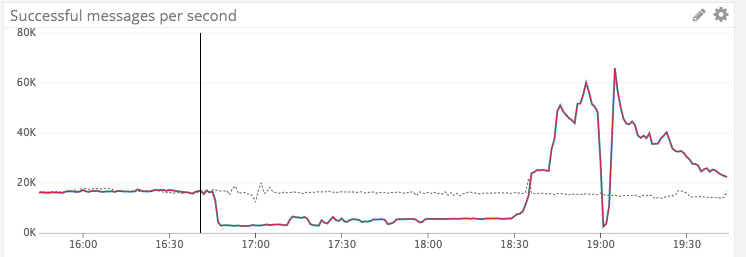
From 4:45pm until 6:30pm, our monitoring saw a sharp decline and steeply degraded performance. The percentage of successful calls dropped to about 15% of normal traffic load.
Here you can see the graph of successful calls in dark red, plotted against the data from one week before as the dashed thin line.
During this time, Centrifuge began to rapidly retry the failed requests. Our exponential backoff strategy started to kick in, and we started attempting to re-send any requests which had failed.
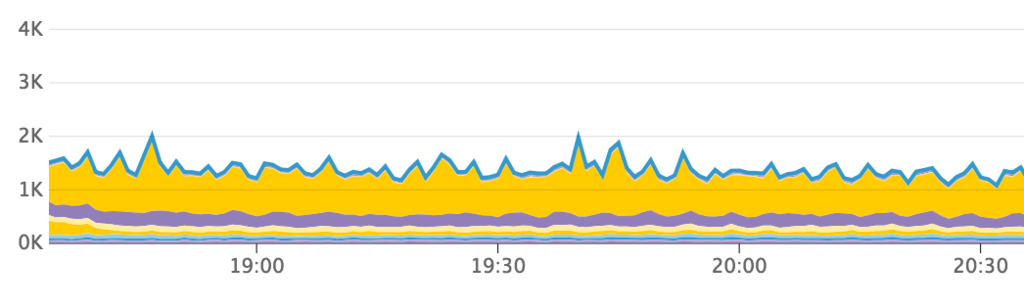
Here you can see the request volume to the third-party’s endpoint. Admittedly this strategy still needs some tuning–at peak, we were sending around 100,000 requests per second to the partner’s API.
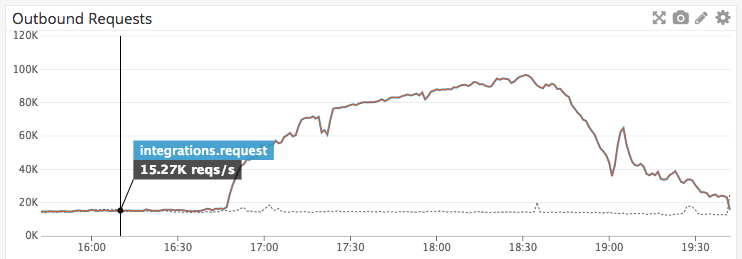
You can see the requests rapidly start retrying over the first few minutes, but then smooth out as they hit their exponential backoff period.
This outage was the first time we’d really demonstrated the true power of Centrifuge. Over a 90-minute period, we managed to absorb about 85 million analytics events in Segment’s infrastructure. In the subsequent 30 minutes after the outage, the system successfully delivered all of the queued traffic.
Watching the event was incredibly validating. The system worked as anticipated: it scaled up, absorbed the load, and then flushed it once the API had recovered. Even better, our mutual customers barely noticed. A handful saw delays in delivering their data to the third-party tool, but none saw data loss.
Best of all, this single outage didn’t affect data delivery for any other integrations we support!
All told, there’s a lot more we could say about Centrifuge. Which is why we’re saving a number of the implementation details around it for further posts.
In our next posts in the series, we plan to share:
how we’ve verified correctness and exactly-once delivery while moving jobs into Centrifuge
how we’ve optimized the system to achieve high performance, and low-cost writes
how we’ve built upon the Centrifuge primitives to launch an upcoming visibility project
which choices and properties we plan on re-thinking for future versions
Until then, you can expect that Centrifuge will continue evolving under the hood. And we’ll continue our quest for no data left behind.
Interested in joining us on that quest? We’re hiring.
Since you've made it this far, perhaps you want to check out Segment? Sign up for a free workspace here or a get a demo here 👉
Centrifuge is the result of a 9-month development and roll-out period.
Rick Branson designed and architected the system (as well as christened it with the name). Achille Roussel built out most of the core functionality, the QA process, and performance optimizations. Maxence Charriere was responsible for building the initial JobDB Manager as well as numerous integration tests and checks. Alexandra Noonan built the functionality for pairing drainers to JobDBs and helping optimize the system to meet our cost efficiency. And Tom Holmes wrote most of the archiving code, the drainer processes, and tracked down countless edge cases and bugs. Julien Fabre helped architect and build our load testing environment. Micheal Lopez designed the amazing logo.
Special thanks to James Cowling for advising on the technical design and helping us think through our two-phase-commit semantics.
To close, we wanted to share a few of the moments in development and rollout:
June 23rd, 2017: Max, Rick, and Achille begin testing Centrifuge on a subset of production traffic for the first time. They are stoked.

Sept 22, 2017: Achille gets some exciting ideas for cycling databases. Feverish whiteboarding ensues.

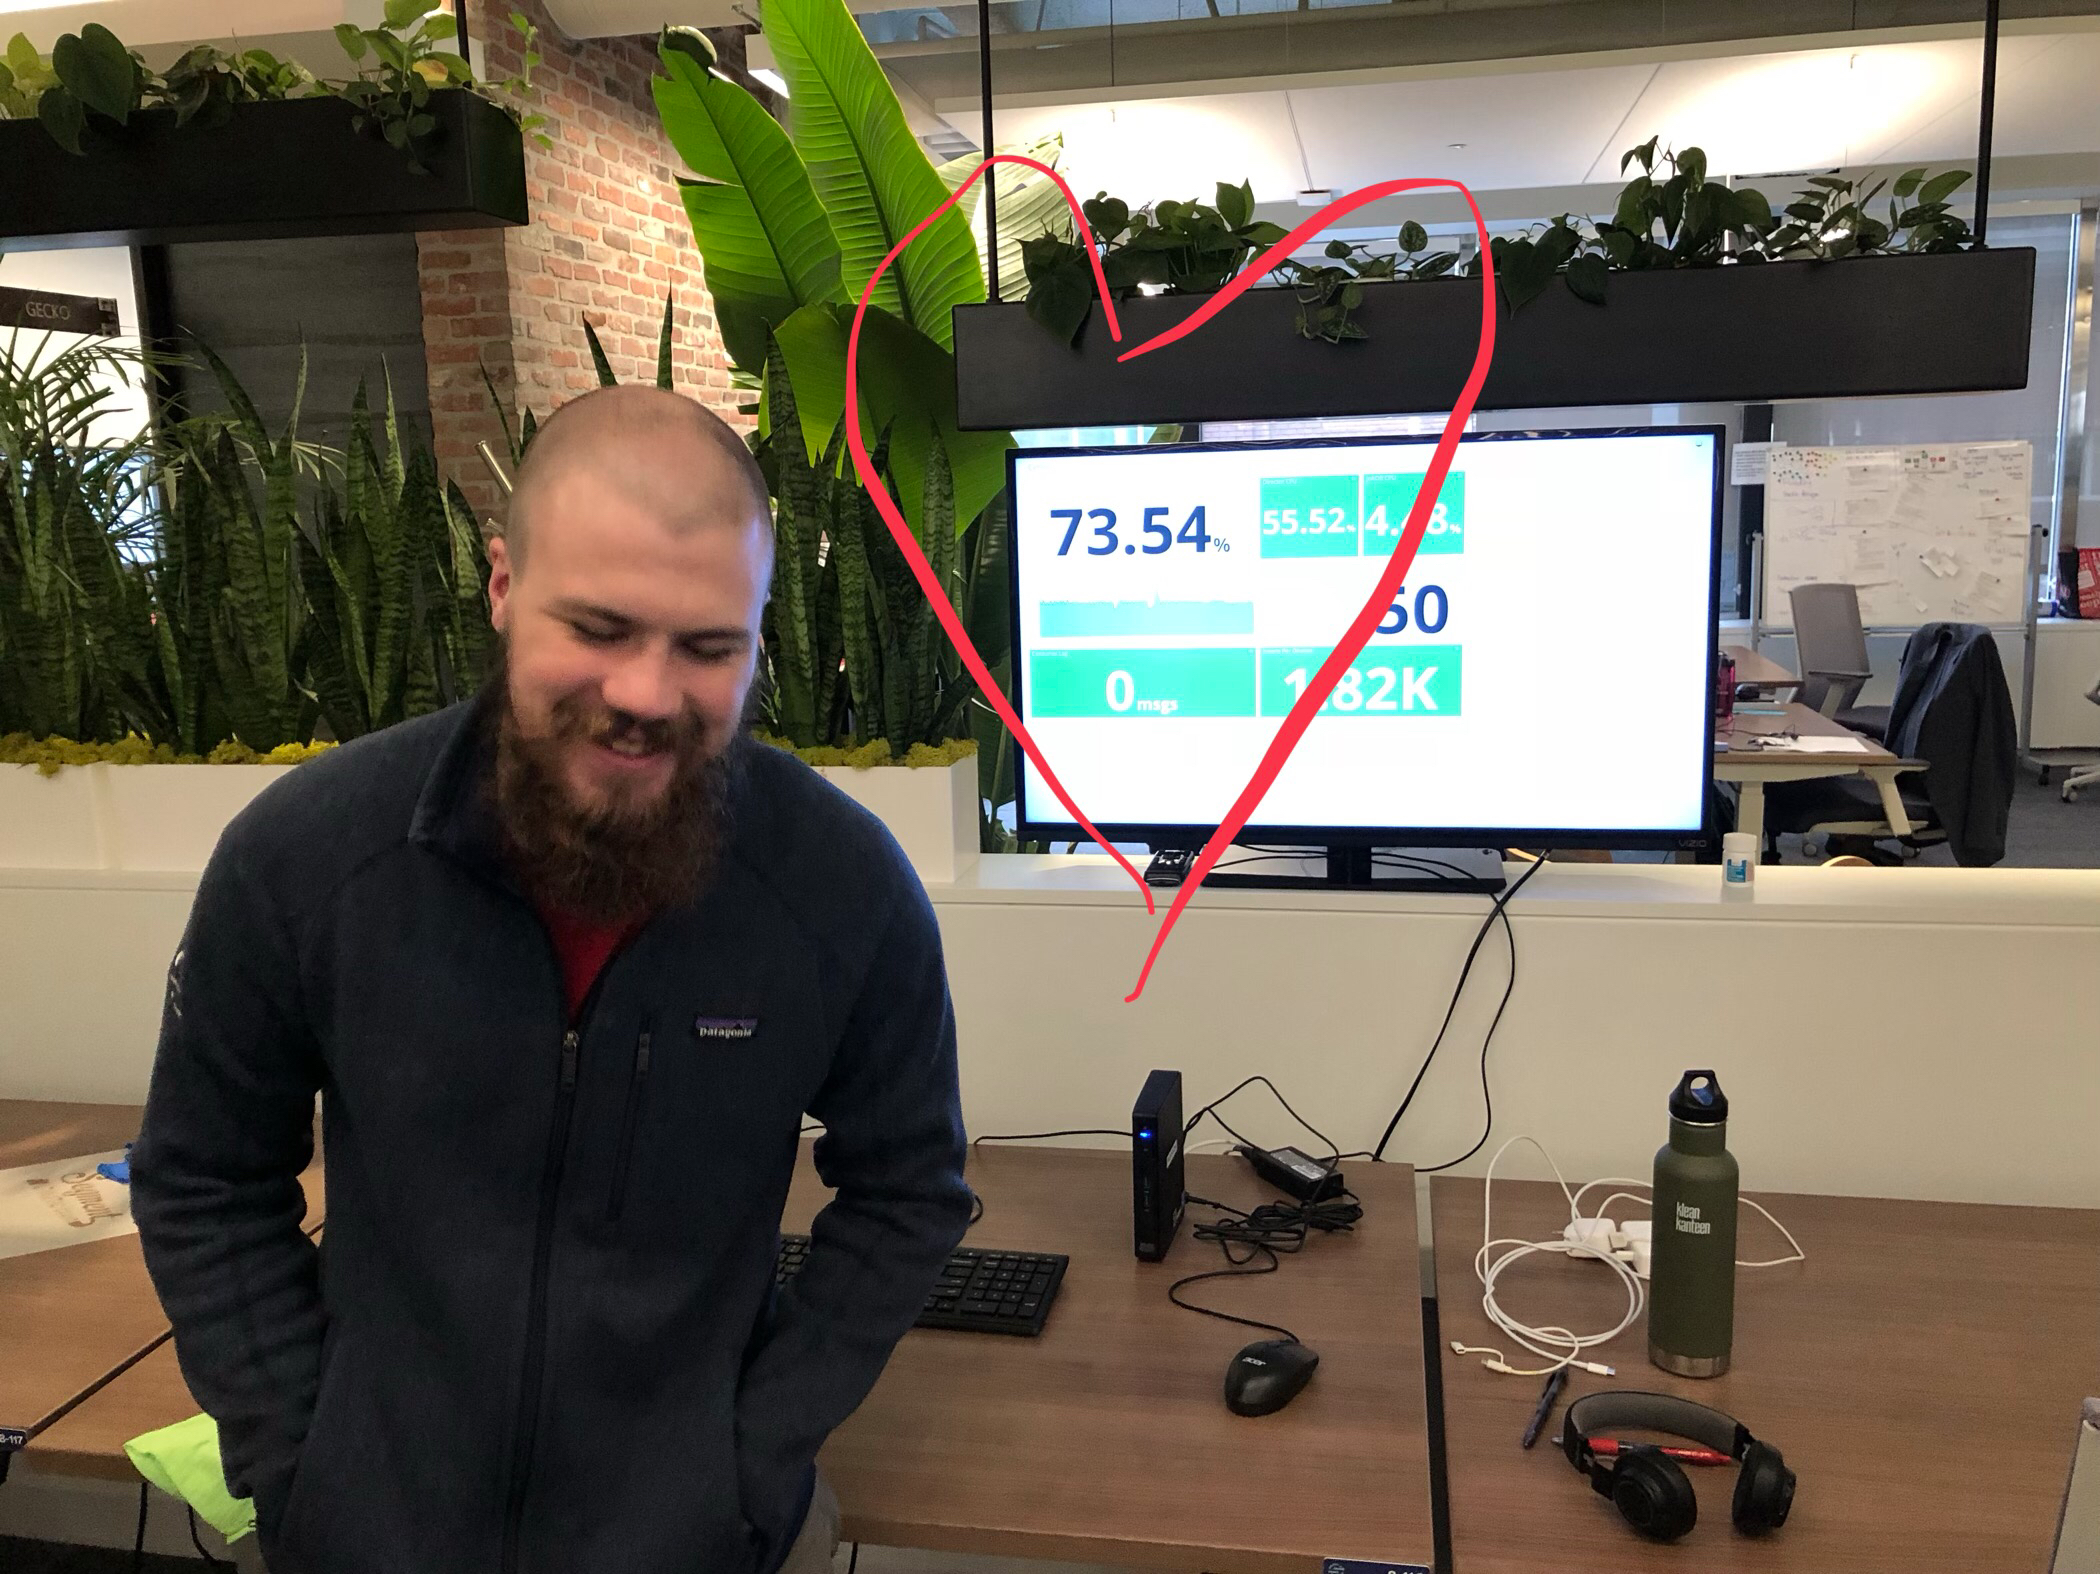
January 12, 2018: we hit a major milestone of 70% traffic flowing through the system. Tom bows for the camera.
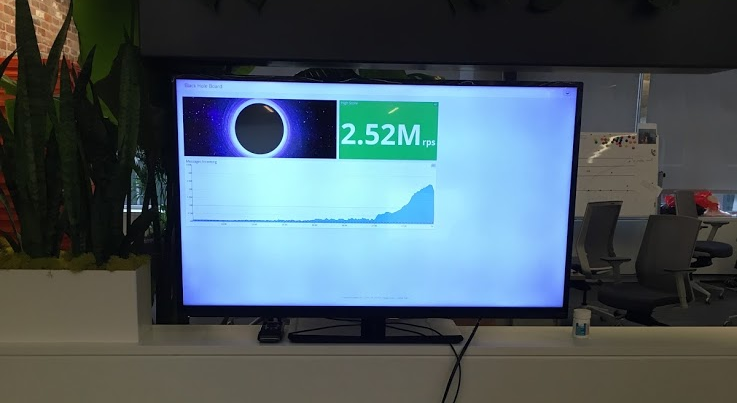
Mar 14, 2018: We hit a new load test record of 2M messages per second in our “Black Hole” account.
May 22, 2018: Tom, Calvin, Alexandra, and Max take a group picture, since we forgot to earlier. Rick and Achille are traveling


Our annual look at how attitudes, preferences, and experiences with personalization have evolved over the past year.