The 3 Stages to Product Analytics Mastery
How do product managers get started with analytics? In this guest post, learn how to track the most important product metrics using Segment.
By Enzo Avigo
How do product managers get started with analytics? In this guest post, learn how to track the most important product metrics using Segment.
For many years, I was lost in data.
I was what people refer to as a "non-technical product manager". I didn’t have a fancy CS degree, but had a background in finance and a business school diploma instead.

Me discovering MySQL at N26
Yet somehow I had spent 7 years working as a product manager for data-driven companies like Intercom and N26. And because of my math background, I was often the one to bring data to the decision "table" (excuse the pun).
And boy, I felt lost so many times.
Lost learning a new SQL formula (thanks again, Stack Overflow 🤗)
… only to realize that the graph library I used was not compatible with my query.
Lost spending weeks to build expertise through webinars and blog posts
… only to recreate the same analysis in my data visualization tool.
Lost trying to come up with fancy success metrics
… only to realize my team and I forgot to add tracking events before releasing in production.
Lost.
This feeling eventually led me and my co-founders to build June, a lightweight product analytics app built on top of Segment. We’re on a mission to demystify analytics for product team members.
Whether you are early into using analytics for your product or an expert with data I wanted to share a simple framework I wish I had when I started. It covers 80% of the use cases I've seen in my career in three simple steps, and can help answer many of the day-to-day decisions you’ll have to make as a product manager.
Better still, if you use a CDP like Segment already, using this analytics framework like the one below is only two clicks away. No extra set up required.
Let's dive in.
(Note: This guide is especially relevant for subscription businesses. If you like it, let me know and I'll make one for non-subscription businesses too)
You don't need to be an analyst anymore to get started with analytics.
You don't have to spend hours on this either. Here are the critical mindset and metrics to get there in minutes, not weeks.
The best initiatives start with a quantifiable goal, for instance, “Get more customers” or “Get customers to spend more”.
You should set a quantifiable goal per new product or feature releases.
The second rule is to adopt a “Lean analytics” process.
The main mistake people make is to think they need to sequence their work as follow:
❌ Define ALL success metrics
❌ Track ALL important user behaviors
❌ Run ALL analyses
A better approach consists of picking ONE release and its metrics. The process should be as follows:
✅ Define ONE success metric
✅ Track ONE important user behavior
✅ Run ONE analysis
By taking this approach, you will reach the first successful moment of your analytics journey, fast. It gives you room to learn about your process and iterate, and the confidence and motivation to keep iterating.
When starting anything new, it's critical that you build a habit around it. This is especially the case with data analysis. Teams frequently start with lots of enthusiasm for analyzing data, but then quickly forget about it when other priorities emerge
The best way to fight this is to make analytics integrated into your workflows. Here are three killer ways you can do this:
1. Slack notifications with main data points: Segment does it, Zapier and June are good alternatives.
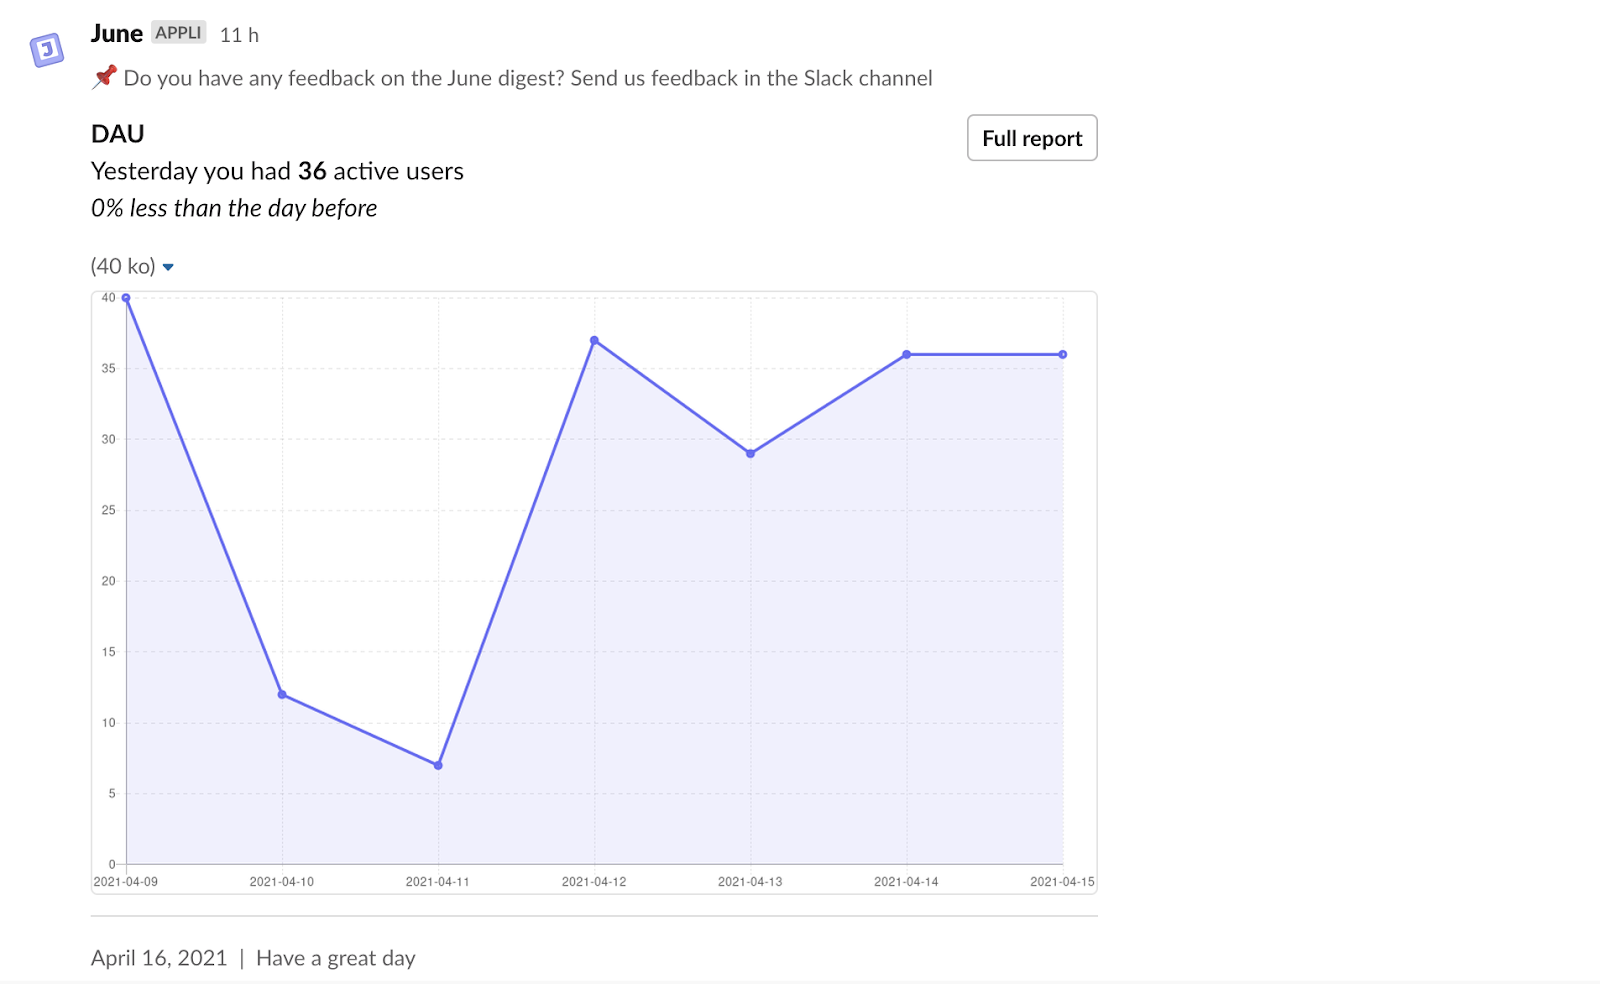
Image Source: june.so
2. A TV screen: If you operate from an office, you may display your main metrics on a TV screen.

Image Source: Geckoboard
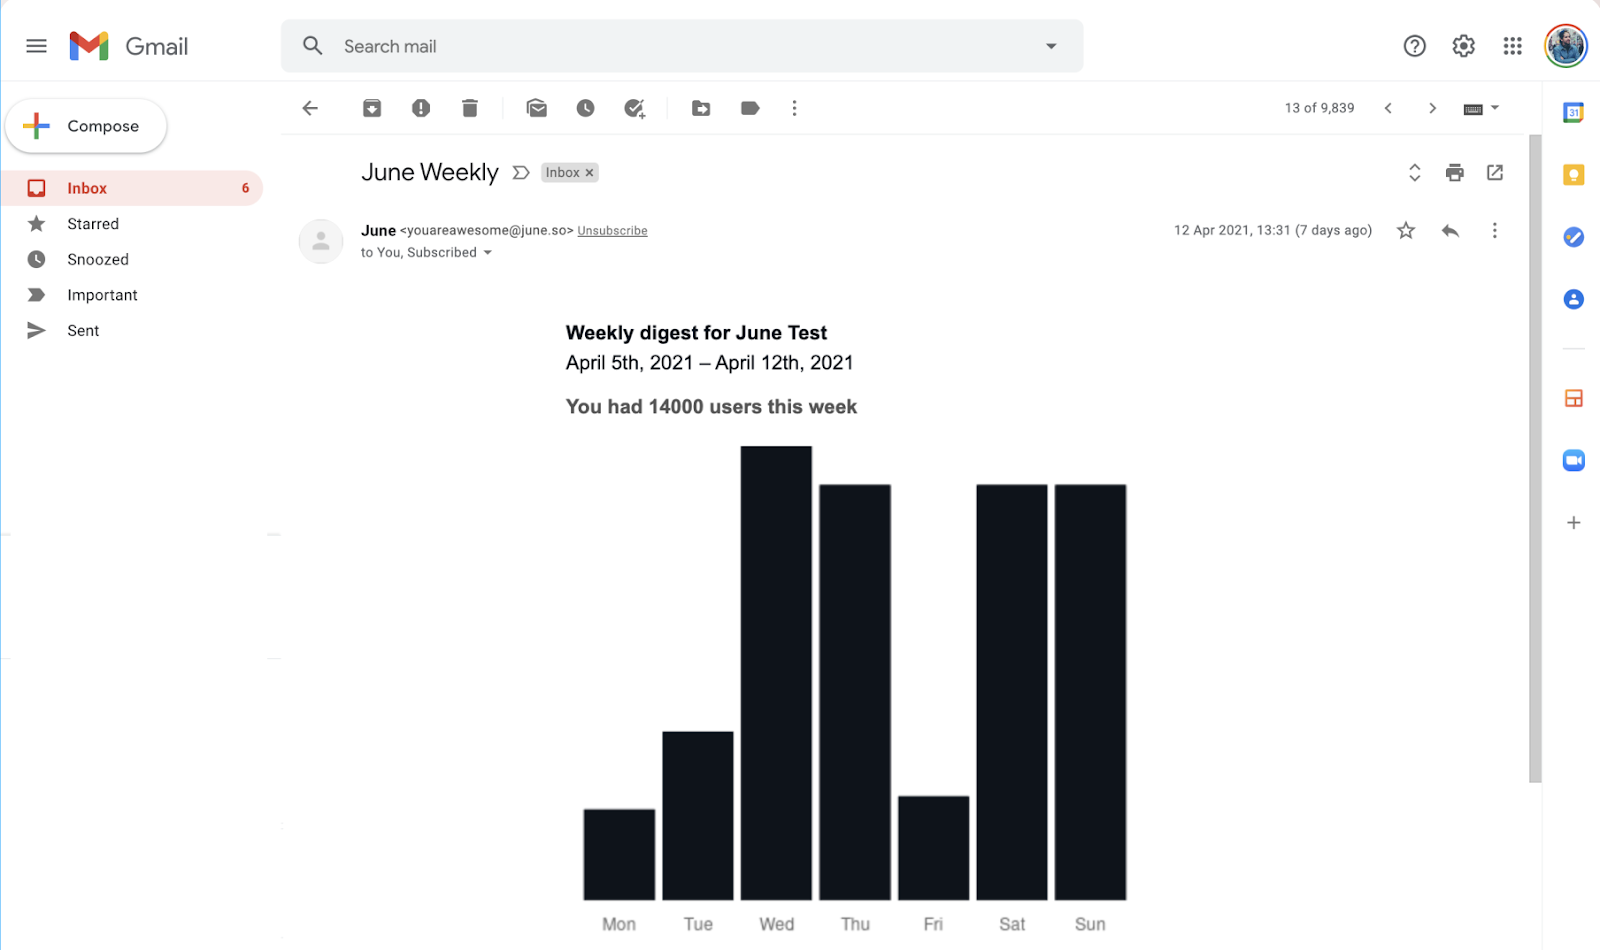
3. An email with your main data points: Weekly or monthly round-ups of important trends and patterns your team should know about.
Another classic mistake is trying to measure too much. Over time, you can go as deep with analytics, we suggest you keep things simple. Here are the six main metrics we suggest you use to get started.
Number of signups: Without users, you’re building for no one.
Feature activation: the % of users using a specific feature at least once. This is the lowest level of engagement on your product, but also the easiest way to understand if a portion of your product is being used or not.
Active users: “Active” means your customers are gaining unique value from your product. Measuring your active users means you are not only growing but only making people stick.
Product retention: The % of users that stay over a specific period of time (usually 1, 3, or 6 months). This is another way to look at active users.
Acquisition cohort: Users’ retention based on the date they started using your product. This is a time-based view of your product retention. It tells you if your retention improves over time.
Feature retention: Similar concept to product retention, except at a single feature level.
Side note: A very frequent question asked by early-stage companies is whether they should look at acquisition or retention first. This is a false dichotomy.
It is almost impossible to grow if your retention is terrible and all your users churn. It is impossible to succeed if no customers are signing up.
This phase is when things get a little more complex. It is also where most people get lost.
There are two concepts you need to understand to up your analytics games. Yes, you heard me, two, no more.
Both are extra information you can pass on:
The first one is an extra field for the actions taken. It’s called a “property”.
The other one is an extra field about the users themselves. It’s called a “trait”.
Once you start passing these extra fields, your analyses will become much richer.
“Properties” are sub-information you can pass when tracking is triggered.
By adding “properties” to tracking events, you will be able to break down your tracking into meaningful audiences of users (see metrics below).
Here is an example where the event “user registered” contains two properties: “plan” and “accountType”:
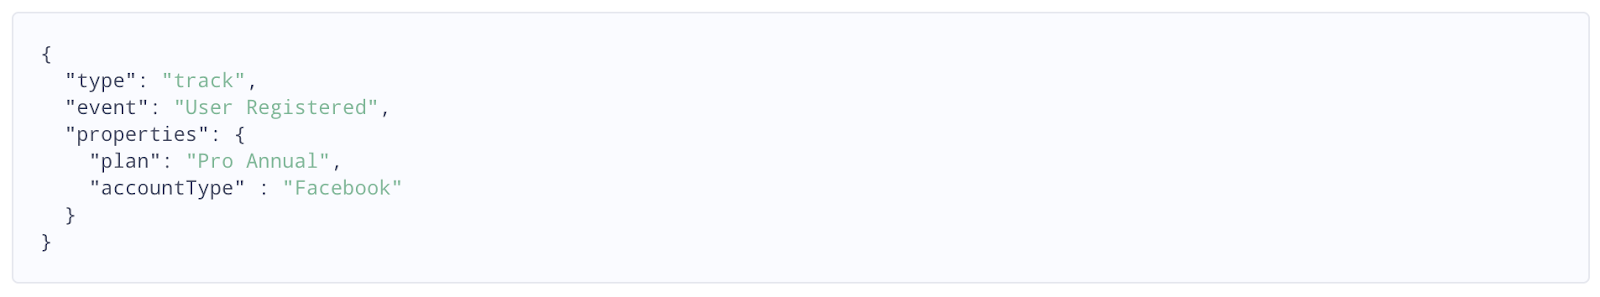
Event properties are used to give context to a tracking event. In this case, a user has registered, and we know it was for an annual Facebook plan.
This is a similar concept, but for users.
This is an example of a user for whom we pass traits such as “name” and “email”.
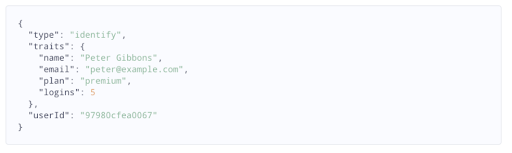
Common traits include:
Username
User email
Device locale
User company
User spending
Enriching your users with traits means that you can create a segment of users based on it (these are referred to as audiences or cohorts).
Events properties and user traits unlock new kinds of analysis that are much more rich and granular.
The three analyses below are worth running by isolating the right set of users based on traits or properties:
Feature audit: take your current product, analyze feature usage and plot it on a graph. The horizontal axis consists of the % of your users using this feature. The vertical axis consists of the frequency at which a user uses a feature.
Revenue: you can find your income by doing a sum of your “plan purchased” property. Traditionally, revenue analysis does not fall under product analytics, but it’s a great practice to have it under the radar to ensure the customers you build for are paying ones.
Funnels: this is the sequence of events you’d expect the user to navigate through to achieve an ultimate goal or conversion, and gives you a good overall view of product usability. Such as the below events.
Signup: % of users who started your sign up and completed it
Onboarding: % of users who started your onboarding and finished it
Free to paid: % of users who began using a free plan and switch to a paid one
Virality: % of users invited someone to join them.
Ok, so what’s left to become a master? In one word: consistency.
The best product teams figure out how to run analysis consistently. They make it a team sport. Here are powerful yet simple rules to help you get there.
Assign metrics to teams and reward them for hitting them. Give teams ownership and make metrics visible to the organization. Don't ship new features without a clear tracking plan.
Measure the outcome of work that is shipped.
Only move a project into the “done” state when the data analysis has been completed. A good hack consists of creating an “Analysis” task when starting a new project.
Don’t forget, data quality is more important than data volume. Structure your events to answer business questions.
Here are the three most common analyses you'll need to master analytics.
Activation: The set of actions you customers need to take to become active. Once you find them, you can make these actions part of the critical user flow of your product. Examples of activation criteria:
Twitter: they used several feed views to help predict potential revenue. They knew income was tied to feed views.
Dropbox: For Dropbox, the critical action for engagement was getting users to place at least one file in a Dropbox folder.
Slack: Slack focused on getting companies to hit a milestone of 2,000 messages sent, which corresponded to a 93% retention rate.
Facebook: Facebook found out that connecting is critical. They aim for you to add 7 friends in 10 days.
Power users: histogram of users' engagement based on the total number of days they were active in a month.
Fake doors: the % of users that complete a specific action. The fake door technique is a powerful, quick, waste-reducing way to determine if people want a product, feature, or service.
Congratulations if you made it until this point 🎉
The practices and analyses you find here should cover 80% of the use cases you have as a product team.
Next time you feel lost, come back to this framework :) It will shed some light on the standard metrics to measure to build a great product with data.

Our annual look at how attitudes, preferences, and experiences with personalization have evolved over the past year.