ROAS: How to Calculate & Improve Advertising Spend in 2021
A guide for marketing teams on how customer data platforms can optimize return on ad spend, improve conversion rates, and boost advertising efficiency.
By Geoffrey Keating
A guide for marketing teams on how customer data platforms can optimize return on ad spend, improve conversion rates, and boost advertising efficiency.
Twilio Segment Personas is now part of Segment’s Twilio Engage product offering.
In 1933, at the tail end of the Great Depression, Kraft introduced Miracle Whip. Despite the challenging economic circumstances, they launched what was then one of the biggest-ever advertising campaigns for a food product.
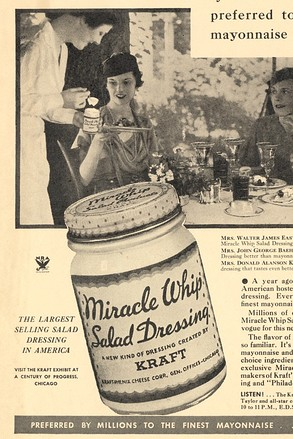
The result? In just six months, it became America’s best-selling salad dressing.
The idea of advertising during a recession has plagued marketers for close to a hundred years, and was well summarized by James Surowiecki in his 2009 New Yorker article“Hanging Tough,” His conclusion was that businesses face two choices: they could “sink the boat” (make a risky bet and make a bad situation worse) or “miss the boat” (let a great opportunity to gain additional market share pass).
In today’s COVID-19-induced economy, we’ve heard similar stories from hundreds of our customers. Should we spend more when others are spending less? Should we play offense when others are playing defense?
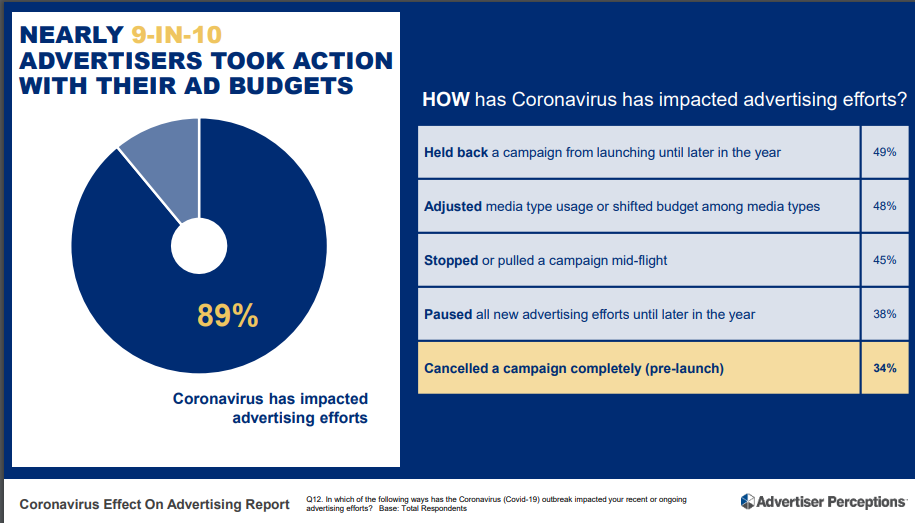
89% of advertisers took some sort of action with their ad budgets, whether it was pausing, reducing, or otherwise changing their ad spend.
The answers differ from customer to customer, but what unites them is a desire to make the most of each dollar they plan to spend on advertising.
To understand this, they’re looking to ROAS (return on ad spend) as their metric of choice.
Despite its importance to a businesses’ balance sheet, comparatively little has been written about ROAS compared to other metrics like CAC (Customer Acquisition Costs) and LTV (Lifetime Value).
So we thought this would be the perfect opportunity to share a handful of our most successful strategies to understanding and optimizing ROAS, with some recommended tools to help. (all of which are available in the Segment Catalog)
Return on ad spend (ROAS) is a ratio representing how much revenue you gain from each dollar you spend on advertising. It provides a clear understanding of whether a campaign is worth the money you put into it.
To calculate ROAS, you simply divide the revenue driven by the campaign by the cost of running the campaign. The formula for calculating ROAS looks like this:
ROAS = Campaign Revenue / Campaign Cost
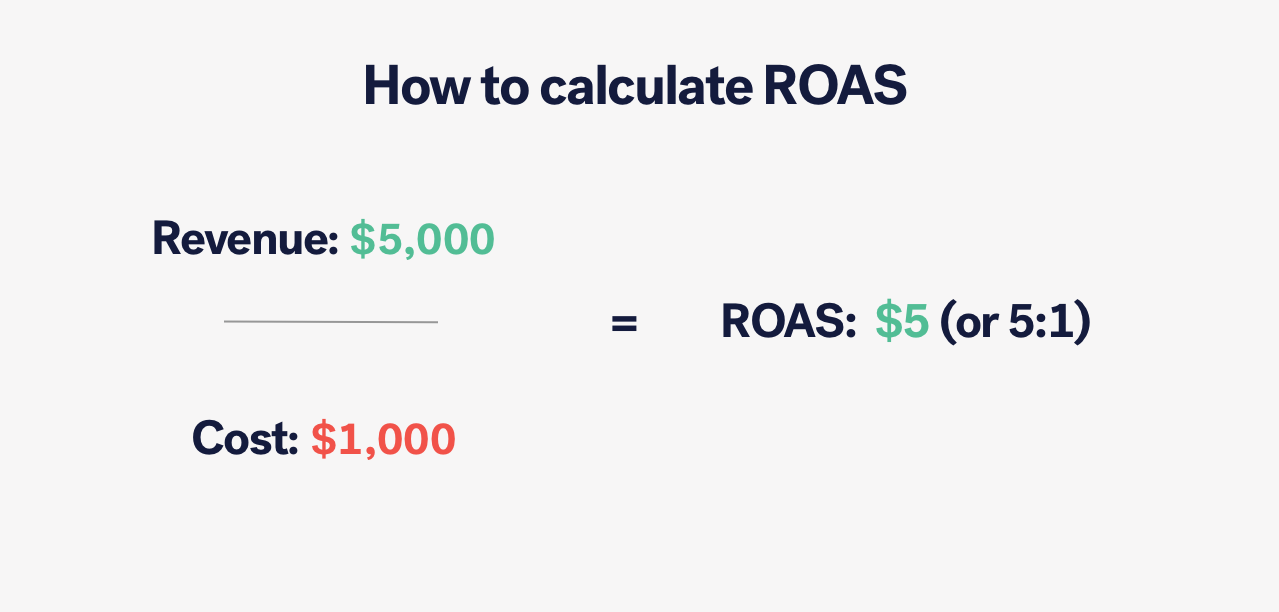
Here's an example: say you spend $1,000 on an online advertising campaign in one month. During that time, your campaign drove $5,000 in revenue. In this case, your ROAS is 5:1 (or $5); in other words, you gain five dollars in revenue for every dollar you spend on that campaign.
One important note for ROAS calculation is to remember that it's not return on investment (ROI), which takes into account profit margins and other expenses beyond the amount of money you plugged into the campaign. ROAS measures the success of specific tactics, while ROI measures the success of the overall strategy.
ROAS is a critical factor in determining the overall health of your business and the effectiveness of your marketing campaigns, so it’s a metric that’s often held under a magnifying glass by VCs.
For every dollar that you spend on advertising, are you getting a dollar (or more) back?
This focus on capital efficiency is a welcome antidote to the growth at all costs mentality from a few years back and is best illustrated by two recent darlings of Wall St – Zoom andDatadog.
With low CAC, short payback periods, and long LTV, they are amongst the most efficient companies on the public market today, with rocketship valuations as a result.
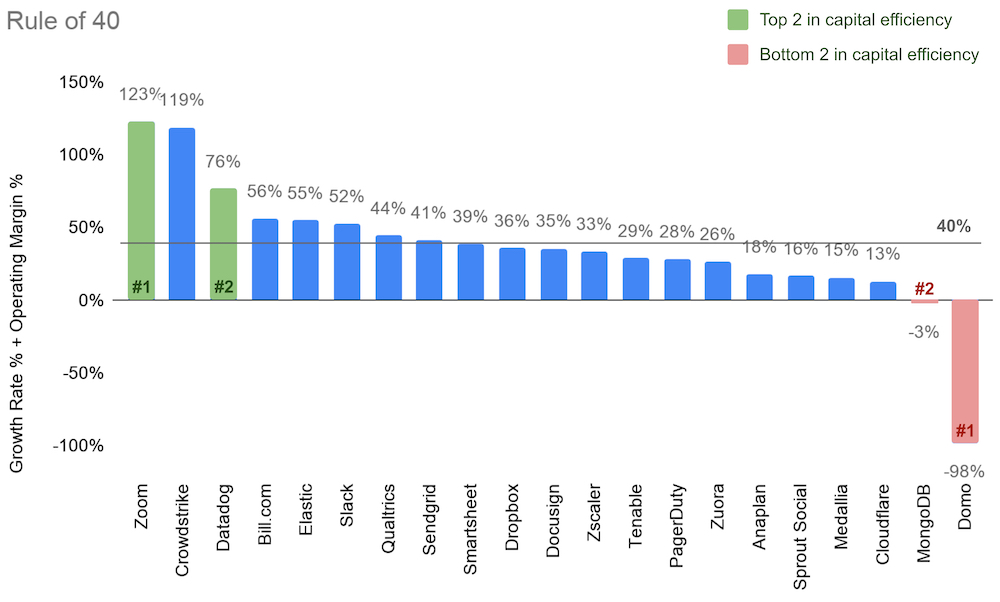
Assessing some recent IPOs according to The Rule of 40, a high-level gauge of company efficiency.
The success of these highly efficient companies has had a second-order effect on marketing budgets, whereby marketers are coming under increasing pressure to account for advertising spend.
ROAS is the metric that can undergird your marketing efforts and help you justify maintaining or even increasing ad spend during challenging economic circumstances.
What makes for a good ROAS depends on a lot of factors, like your technology stack, profit margin, your marketing strategy in general, overall business health, and more.
That said, the general rule is that 4:1 (or $4) is a high ROAS.
4:1 is where you start to turn a profit. 3:1 likely means you’re breaking even. Bearing in mind a businesses’ fixed and variable costs, 2:1 and 1:1 means you’re likely losing money.
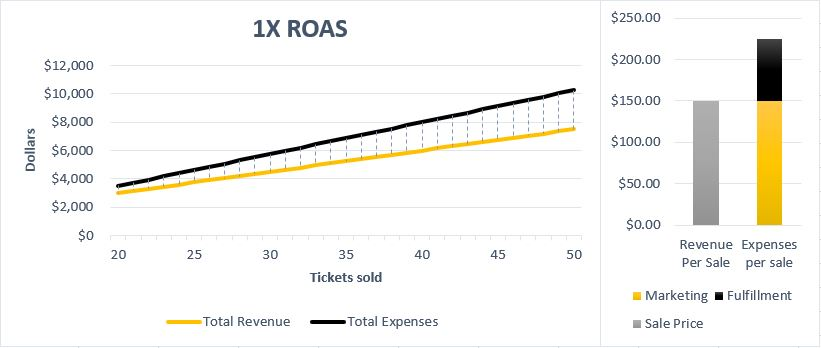
With a ROAS of 1:1, you’ll lose money on every conversion. Image source.
Much also depends on the life-cycle of your business. If you’re a cash-strapped startup, you probably want the most bang for your buck. If you’re an established, healthy business, you may be willing to settle for a lower ROAS in exchange for increased brand awareness.
But regardless of what type of business you have, there are a few tried and tested strategies you can do to keep ROAS steady in the short term and help you reap the benefits in the long term.
As a quick reminder, Segment is a customer data platform that captures data from every interaction someone has with your advertising, consolidates that data into centralized user profiles and audiences, and federates that data to over 300 different tools, including all of the advertising tools you know and love.
The tips below for optimizing ROAS assume you’ve been tracking some customer data with Segment already, but if not, you can import historical data into Segment to get started.
To improve ROAS, you first need to get a baseline of which channels and ad campaigns are working, and which are not.
Most marketers find it frustratingly hard to answer these simple questions. To aggregate spend across Facebook and Google Ads, you’d have to export data from each network on a weekly or monthly interval, merge it into a single file, and work some pivot table magic. And that’s just to understand the basics.
A simple solution is to use Segment Sources for Facebook Ads and Google Adwords. It pulls data directly from the Facebook Insights and Adwords Reports APIs, schematizes the data, and loads it into the data warehouse of your choice (Amazon Redshift or Postgres) with just a few clicks!
No writing code, no maintaining data pipelines, no pulling data from Excel.
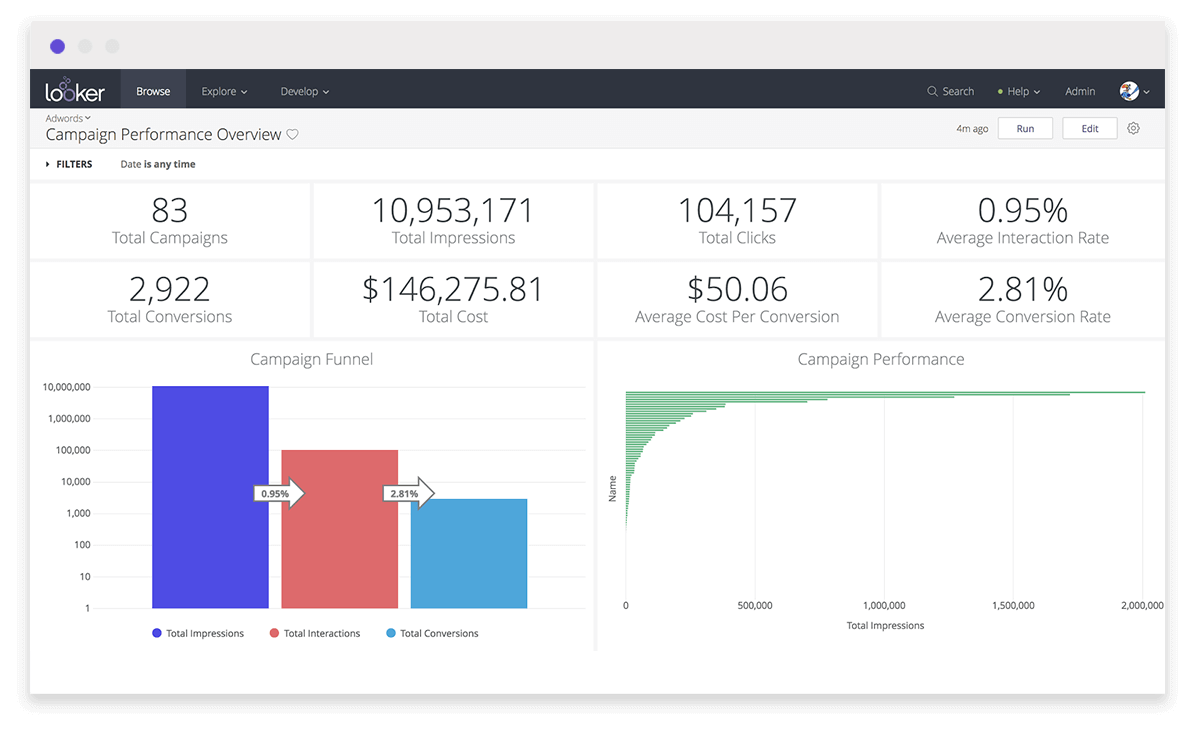
With this level of insight, you can not only surface opportunities and issues quickly, but also act on them right away, and quickly make the case for maintaining or increasing your advertising budget.
Pro-tip: Instead of starting from scratch, you can use Looker and Segment's attribution block, a pre-packaged piece of code to get up and running quickly.
Tools that’ll help:
So you’ve got a handle on your spend, impressions, clicks from each platform – great job!
But before we get too carried away, remember that these metrics only tell one part of the story. You need to combine your top-of-funnel data with the rest of your down-funnel engagement data to understand true profitability.
Let’s say you're advertising on both Google and Facebook.
A potential customer clicks your ad on Facebook; this costs you $5. Subsequently, the same potential customer clicks your ad on Google; this also costs you $5.
The customer converts and buys something that generates $8 in revenue. If you are using Google Analytics or Facebook Insights to optimize your campaigns, both will report that you have $3 in profit.
The problem is that you actually spent $10 ($5 each on Facebook and Google) and that $8 in revenue is actually a loss of $2. There is no way that Google or Facebook could know this because they can't calculate cost and revenue independently.
To get around this, you can use a tool like Attribution, which gives you a more complete picture of your advertising spend. For example, you can view your break-even calculation by daily, weekly, or monthly cohorts.
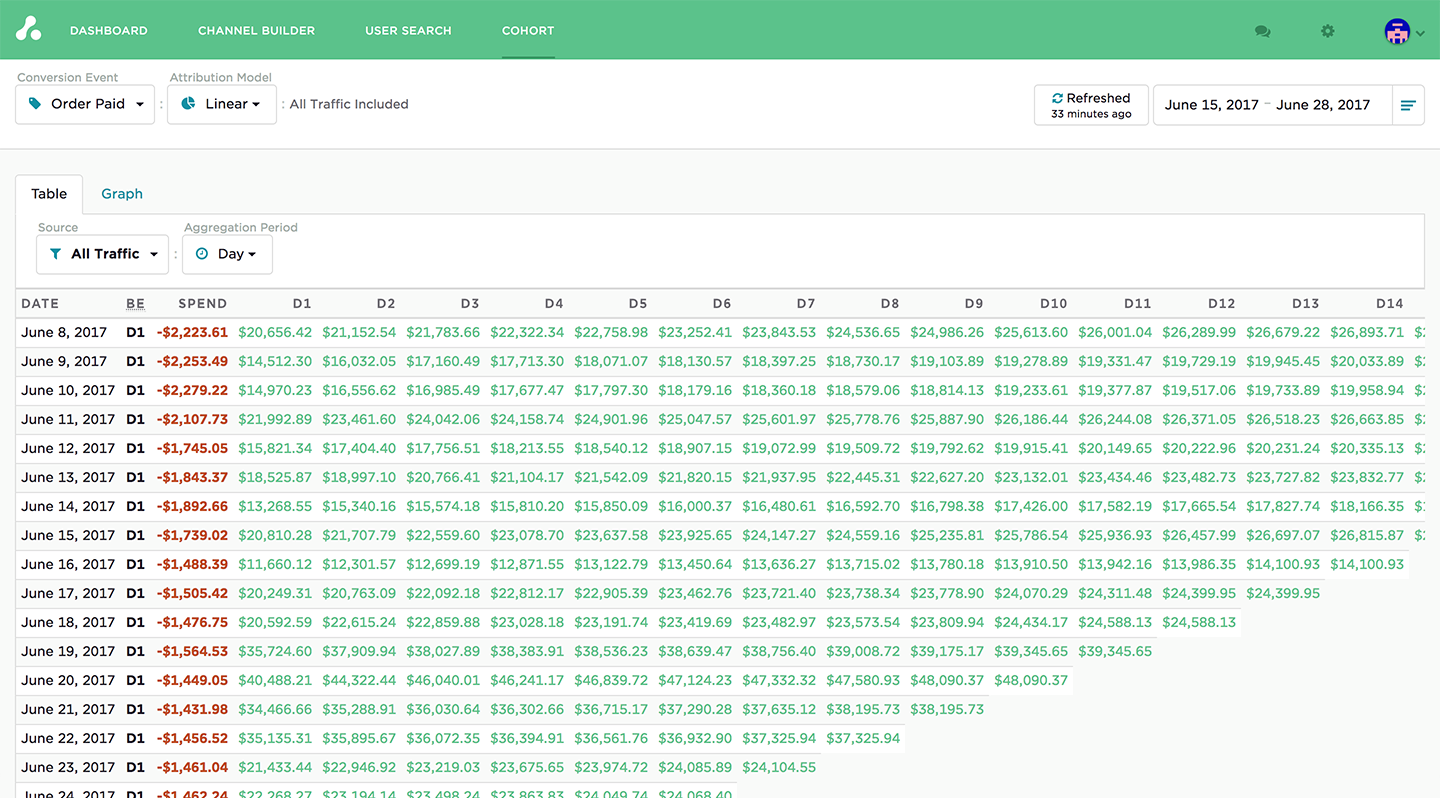
This helps you understand how your advertising efforts should be allocated to conversions and revenue based on the entire customer journey. And help you iterate on your advertising campaigns accordingly.
Tools that’ll help:
An attribution tool like Attribution
"Half the money I spend on advertising is wasted; the trouble is I don't know which half."
John Wanamaker's' famous quote may have been uttered in the early 1900s, but it is as true today as ever. 21 cents of every dollar spent on advertising is wasted due to bad targeting and dirty data.
In order to improve your ROAS, we recommend focusing on advertising to customers that you know are a good fit for the product. This isn’t a time for casting the net wide with speculative bets.
Using Segment Personas, you can target users based on actions you've seen them take in the past on any channel.
Let’s look at a real example.
Let’s say we wanted to launch an advertising campaign to customers who have spent more than $2,000. Using Segment’s product Personas, you’d create a new audience of all customers who have a purchased value greater than $2,000.
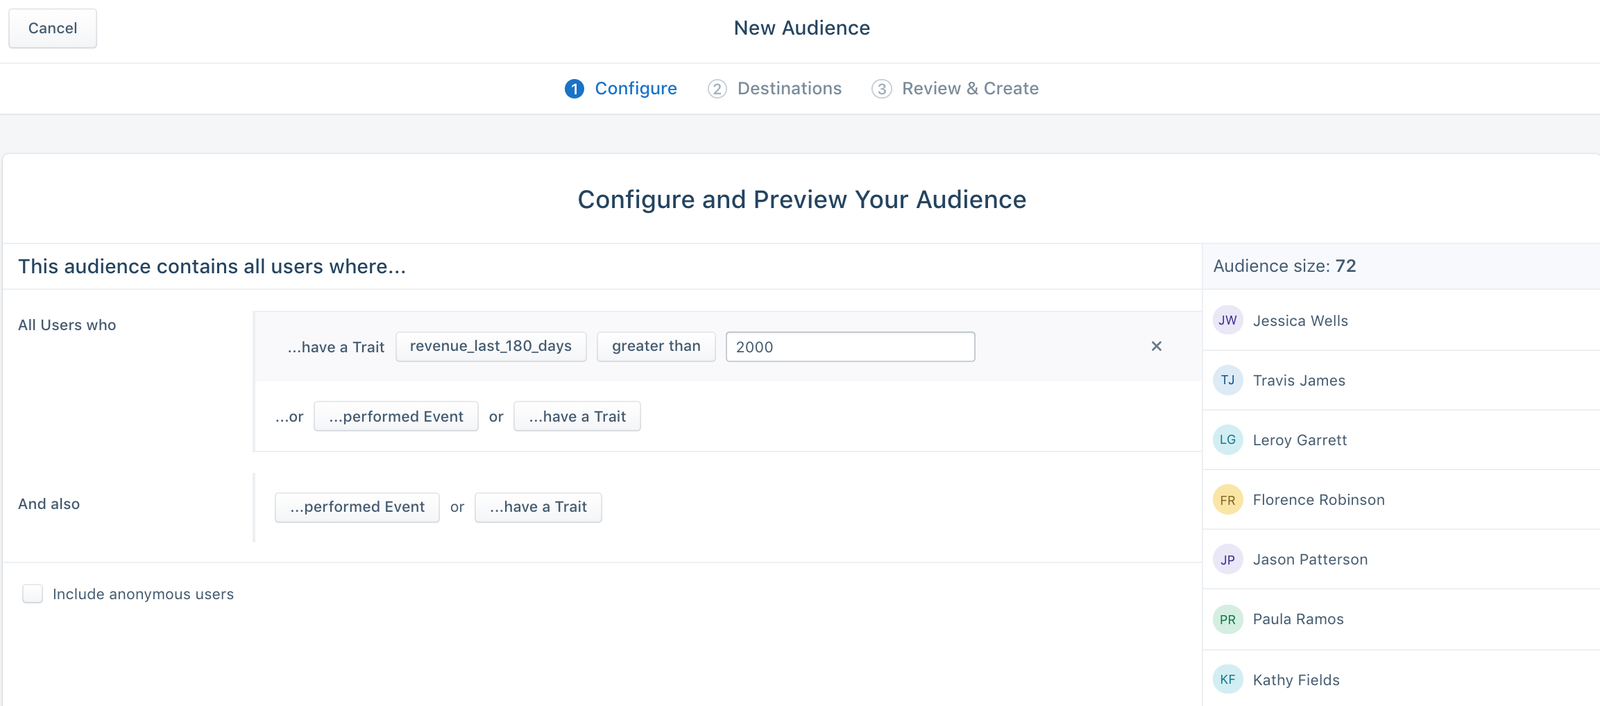
From there, you can import this group into Google Ads or Facebook Ads, which will give you the option to create a lookalike audience who have a similar propensity to spend that amount.
Tools that’ll help:
Facebook Ads or Google Ads to build a lookalike audience
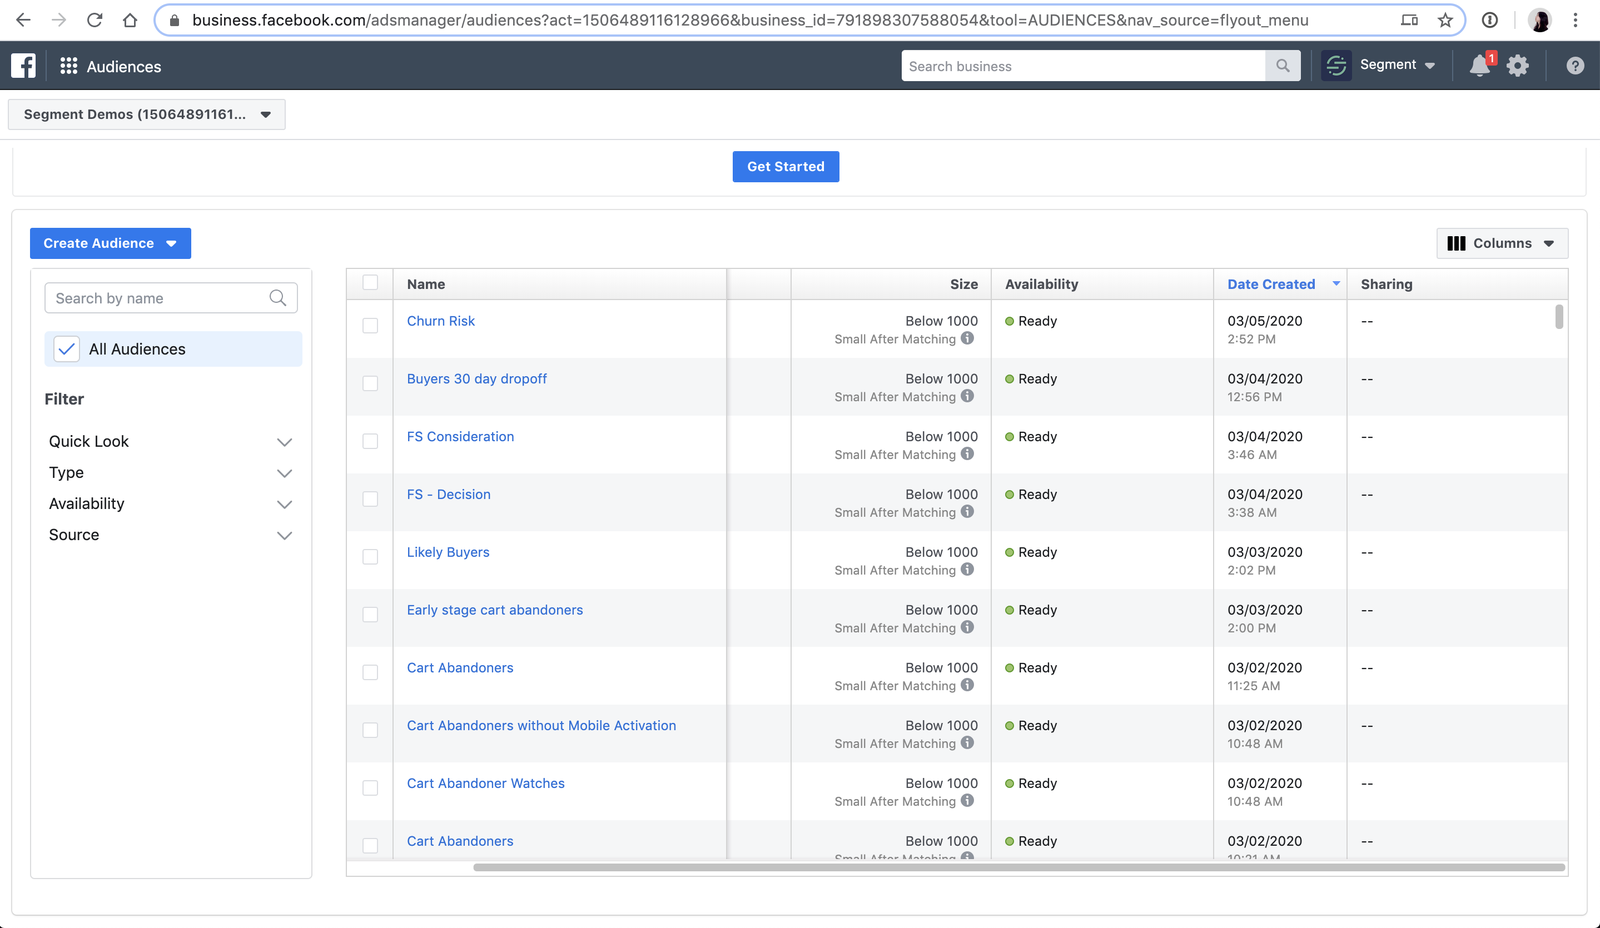
In the same way, you should be focusing your advertising on customers who have a high propensity to convert, you should also focus on reducing the amount you spend advertising to those that don’t.
With a customer data platform like Segment, this is made exponentially easier due to the fact that all your customer data is in one place.
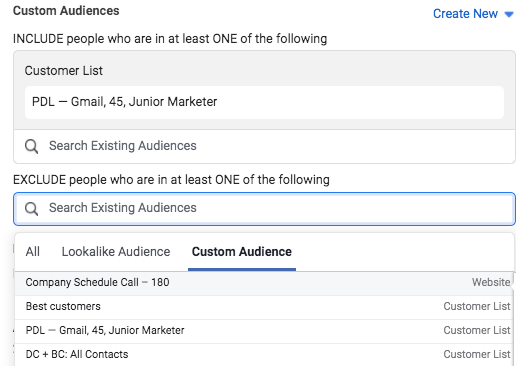
For example, let's say you wanted to exclude a group of users who had already bought your product. Using Segment Personas, simply create a group of users who purchased a product in the last 30 days. Like so:
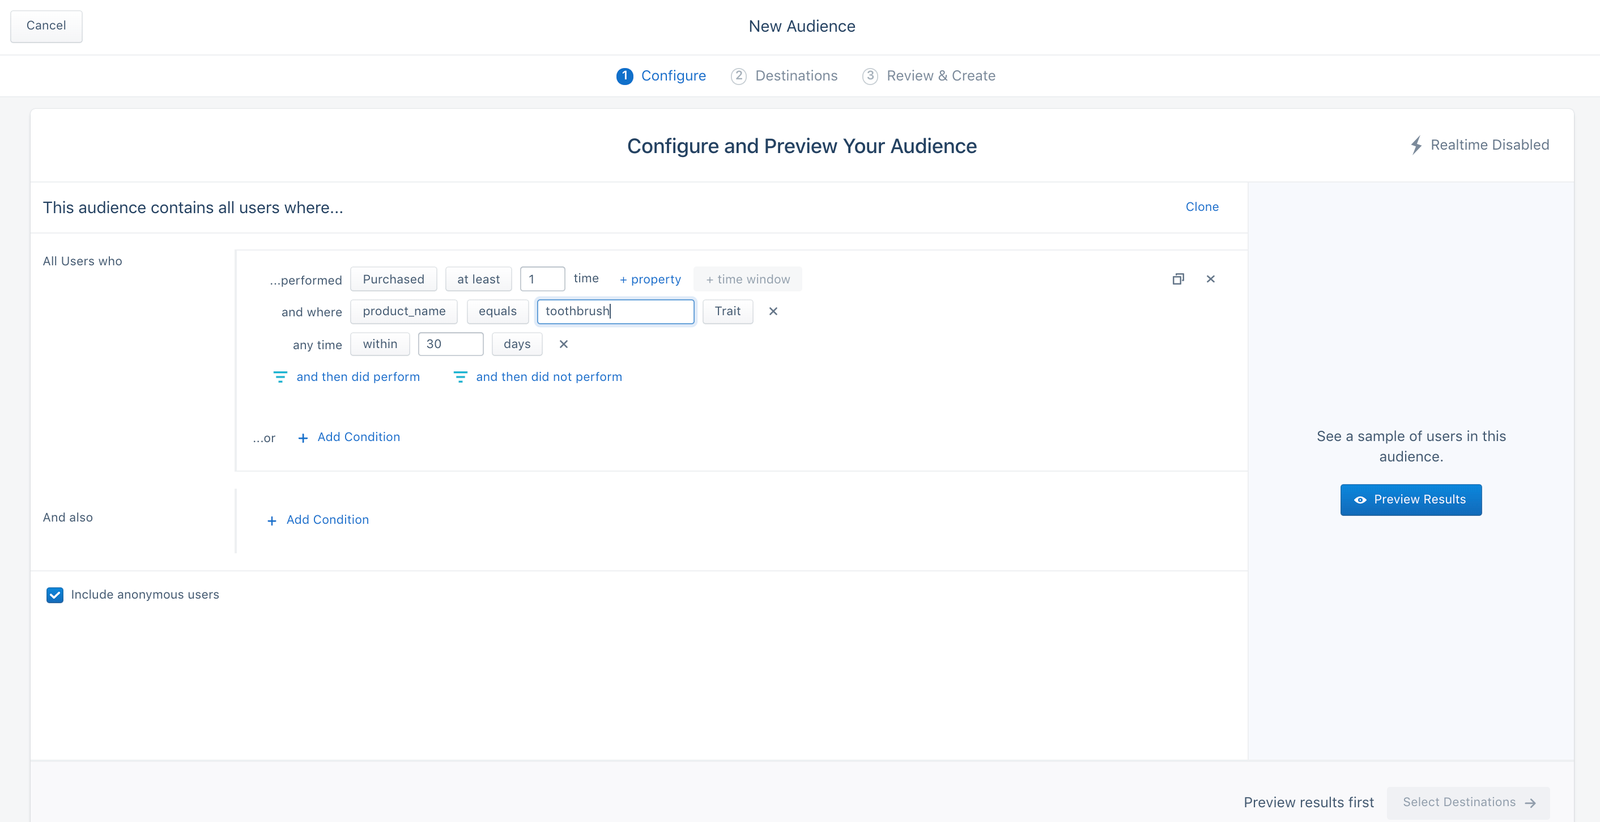
These audiences will then be synced automatically to the ad network of your choice. From there, you can use this list in your advertising platforms to exclude existing users from your campaigns.
By filtering out audiences that you predict are less likely to convert, we’ve seen customers reduce their ad spend by over 10% and improve their conversion rate.
Tools that’ll help:
Aberrations like COVID-19 force businesses to take decisive cost reduction effort. Cutting advertising costs unilaterally is often the first place they turn.
Before you do that, we recommend one thing – look at the data.
We guarantee you’ll find cost-savings, but it’s likely you’ll also find some opportunities for growth.
History teaches us that when a recession hits, a “soft market” emerges, where maintaining or increasing ad spend has an outsized effect on market share.
The below graph (from 1999, but the point still rings true) illustrates this point nicely – you can almost double your gains in market share with a modest increase in advertising.
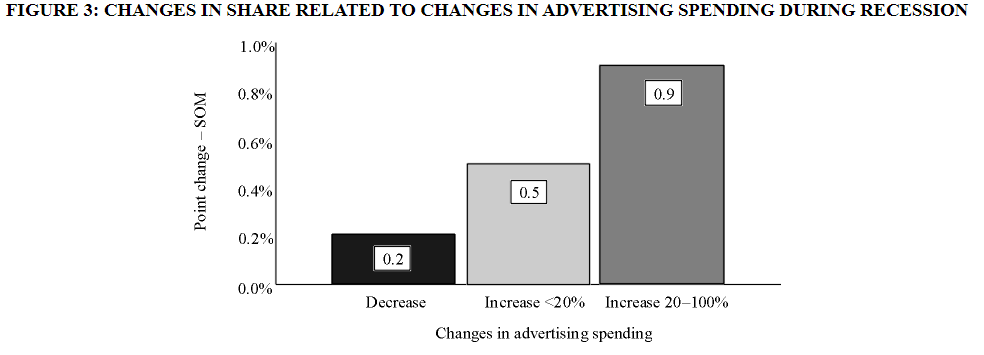
Source: Advertising in a Recession - the benefits of investing for the long term, NTC Publications, 1999
If you can spare the money, ad spend allows you to speak as others become quiet.
Which brings us nicely back to ROAS.
A good ROAS will make pitching this fact to leadership much easier because it makes spending money on advertising less of a risky investment. And with that runway, you can justify maintaining or even increasing ad spend during the recession, which can result in a permanent increase in market share once it’s over.
Now that is a return worth pursuing.
(P.S. If you want help with anything covered in this post, we've got you covered! Get started with Segment here )

Our annual look at how attitudes, preferences, and experiences with personalization have evolved over the past year.